Youngtown, AZ Investment Properties for Sale
Browse homes for sale and investment properties in Youngtown, AZ. Refine your search by price, property type, or more.
Best cash flowing properties in Youngtown, AZ

Active
$333,999
3
bds
|
2
ba
|
1,200
sqft
|
built
1958
11111 W Hollywood Ave, Youngtown, AZ 85363
$-247
Cash flow
-3.9%
Cash-on-Cash Return
4.8%
Cap rate
0.6%
Rent to Value Ratio

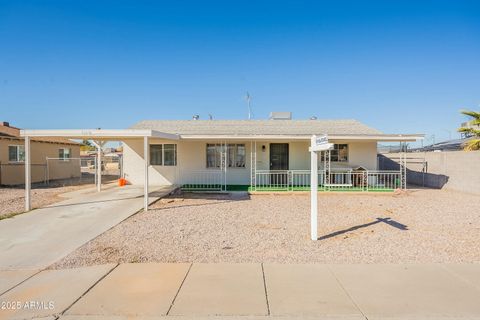
Active
$279,900
2
bds
|
1
ba
|
943
sqft
|
built
1955
12005 N 113th Ave, Youngtown, AZ 85363
$-266
Cash flow
-5.0%
Cash-on-Cash Return
4.5%
Cap rate
0.6%
Rent to Value Ratio
18 out of 22 properties for sale in Youngtown, AZ
Limited Results Shown
Create a free account, or log in to reveal all property listings and enjoy the complete experience.
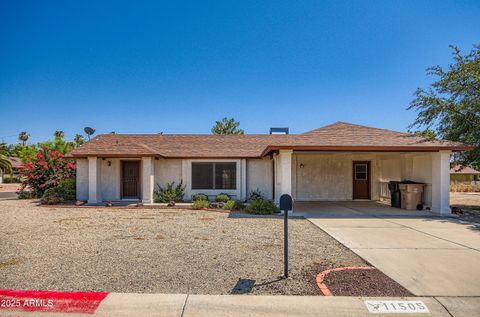
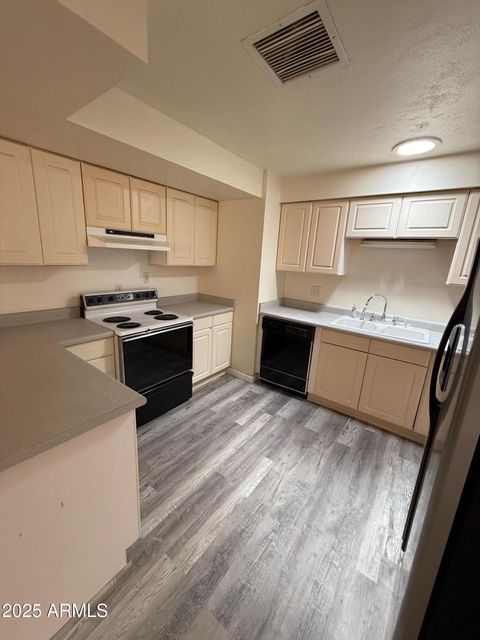
Active
$327,000
2
bds
|
2
ba
|
1,163
sqft
|
built
1985
11505 W Ohio Ave, Youngtown, AZ 85363
$-507
Cash flow
-8.1%
Cash-on-Cash Return
3.8%
Cap rate
0.5%
Rent to Value Ratio
Active
$319,000
3
bds
|
2
ba
|
1,677
sqft
|
built
1956
11102 W Indiana Ave, Youngtown, AZ 85363
$-366
Cash flow
-6.0%
Cash-on-Cash Return
4.3%
Cap rate
0.6%
Rent to Value Ratio

Active
$349,000
3
bds
|
2
ba
|
1,574
sqft
|
built
1963
12832 N 111th Dr, Youngtown, AZ 85363
$-607
Cash flow
-9.1%
Cash-on-Cash Return
3.6%
Cap rate
0.5%
Rent to Value Ratio

Active
$335,000
2
bds
|
3
ba
|
1,184
sqft
|
built
1955
11815 N 112th Dr, Youngtown, AZ 85363
$-531
Cash flow
-8.3%
Cash-on-Cash Return
3.8%
Cap rate
0.5%
Rent to Value Ratio

Active
$410,000
4
bds
|
3
ba
|
2,375
sqft
|
built
2003
11546 W Schleifer Dr, Youngtown, AZ 85363
$-754
Cash flow
-9.6%
Cash-on-Cash Return
3.5%
Cap rate
0.5%
Rent to Value Ratio
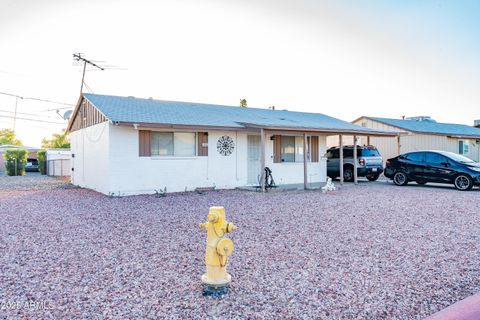
Active
$290,000
3
bds
|
1
ba
|
1,015
sqft
|
built
1955
12010 N 113th Ave, Youngtown, AZ 85363
$-312
Cash flow
-5.6%
Cash-on-Cash Return
4.4%
Cap rate
0.6%
Rent to Value Ratio
Active
$275,000
2
bds
|
1
ba
|
920
sqft
|
built
1965
13002 N 112th Ave, Youngtown, AZ 85363
$-319
Cash flow
-6.1%
Cash-on-Cash Return
4.3%
Cap rate
0.5%
Rent to Value Ratio

Active
$325,000
2
bds
|
2
ba
|
1,350
sqft
|
built
1959
11218 W Montana Ave, Youngtown, AZ 85363
$-291
Cash flow
-4.7%
Cash-on-Cash Return
4.6%
Cap rate
0.6%
Rent to Value Ratio
Active
$409,000
4
bds
|
3
ba
|
2,230
sqft
|
built
2005
11588 W Lee Ln, Youngtown, AZ 85363
$-758
Cash flow
-9.7%
Cash-on-Cash Return
3.5%
Cap rate
0.5%
Rent to Value Ratio

Active
$295,000
3
bds
|
2
ba
|
1,054
sqft
|
built
1955
11222 W Connecticut Ave, Youngtown, AZ 85363
$-346
Cash flow
-6.1%
Cash-on-Cash Return
4.3%
Cap rate
0.5%
Rent to Value Ratio

Active
$449,000
3
bds
|
3
ba
|
1,992
sqft
|
built
1957
11421 W Lakeshore Dr, Youngtown, AZ 85363
$-836
Cash flow
-9.7%
Cash-on-Cash Return
3.4%
Cap rate
0.4%
Rent to Value Ratio
Active
$349,900
2
bds
|
2
ba
|
1,350
sqft
|
built
1969
11024 N 114th Ave, Youngtown, AZ 85363
$-615
Cash flow
-9.2%
Cash-on-Cash Return
3.6%
Cap rate
0.5%
Rent to Value Ratio
Active
$289,000
3
bds
|
1
ba
|
1,075
sqft
|
built
1955
12026 N 113th Dr, Youngtown, AZ 85363
$-324
Cash flow
-5.8%
Cash-on-Cash Return
4.3%
Cap rate
0.6%
Rent to Value Ratio

Active
$375,000
3
bds
|
2
ba
|
1,245
sqft
|
built
2004
11543 W Mountain View Rd, Youngtown, AZ 85363
$-684
Cash flow
-9.5%
Cash-on-Cash Return
3.5%
Cap rate
0.5%
Rent to Value Ratio
Active
$335,000
2
bds
|
2
ba
|
1,051
sqft
|
built
2004
11553 W Purdue Ave, Youngtown, AZ 85363
$-486
Cash flow
-7.6%
Cash-on-Cash Return
3.9%
Cap rate
0.5%
Rent to Value Ratio
Active
$419,900
4
bds
|
3
ba
|
2,375
sqft
|
built
2003
11531 W Oglesby Ave, Youngtown, AZ 85363
$-792
Cash flow
-9.8%
Cash-on-Cash Return
3.4%
Cap rate
0.5%
Rent to Value Ratio