Chisago County Investment Properties for Sale
Browse homes for sale and investment properties in Chisago County. Refine your search by price, property type, or more.
Best cash flowing properties in Chisago County
Active
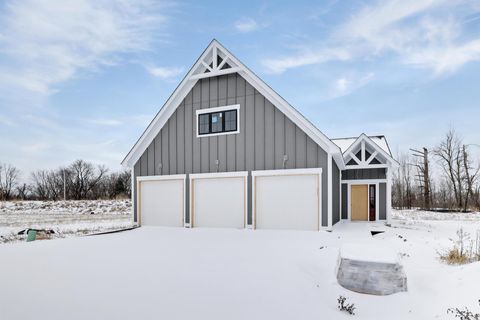
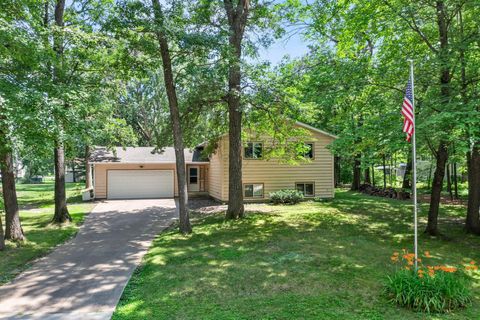
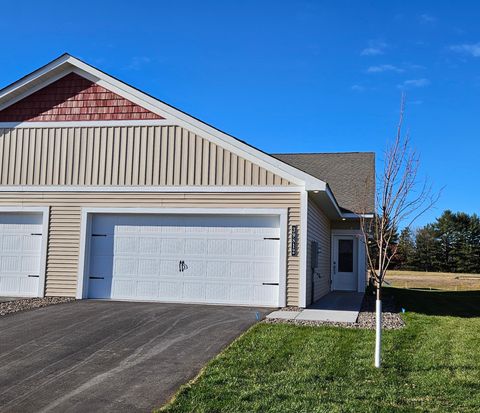
$459,000
2
bds
|
2
ba
|
1,703
sqft
|
built
2024
31710 Madison Rd, Lindstrom, MN 55045
$86
Cash flow
1.0%
Cash-on-Cash Return
5.9%
Cap rate
0.8%
Rent to Value Ratio
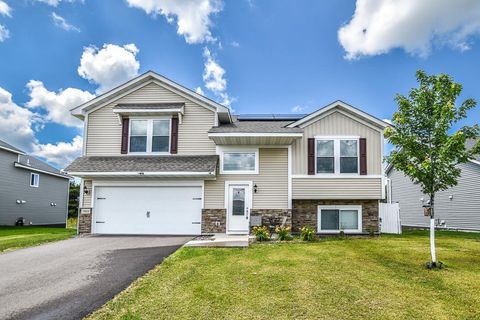
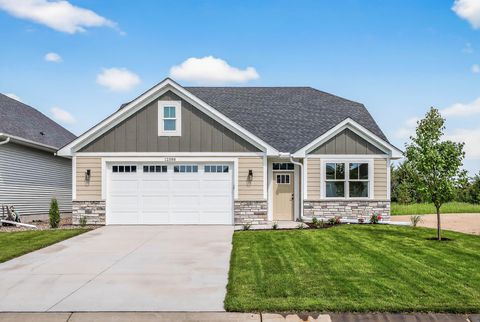
Active
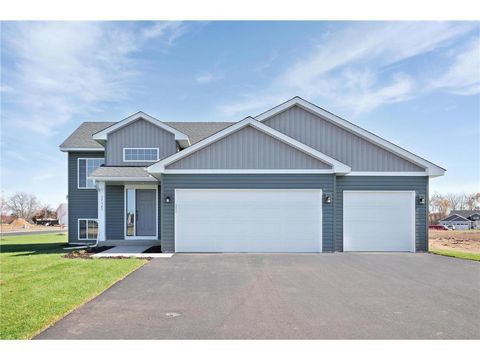
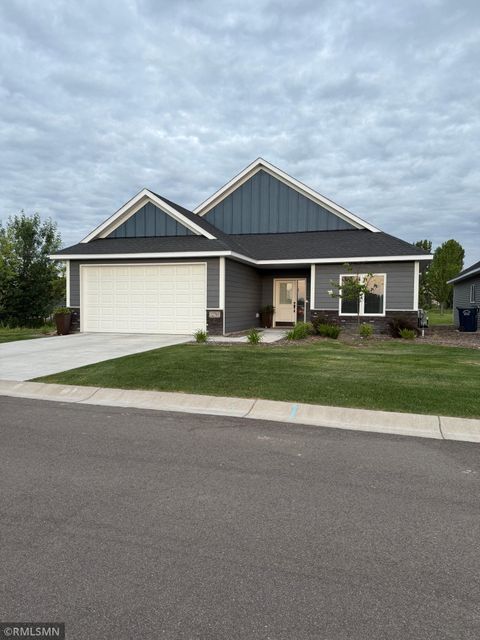
$370,000
4
bds
|
3
ba
|
1,794
sqft
|
built
2023
39604 Fallbrook Ave, North Branch, MN 55056
$-26
Cash flow
-0.4%
Cash-on-Cash Return
5.6%
Cap rate
0.7%
Rent to Value Ratio
49 out of 69 properties for sale in Chisago County
Limited Results Shown
Create a free account, or log in to reveal all property listings and enjoy the complete experience.
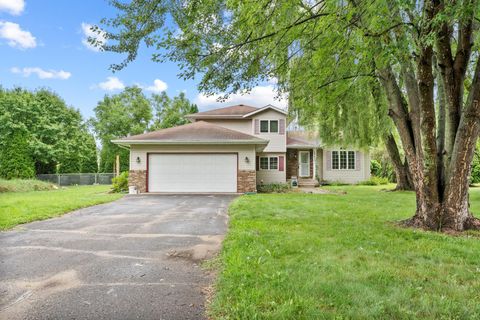
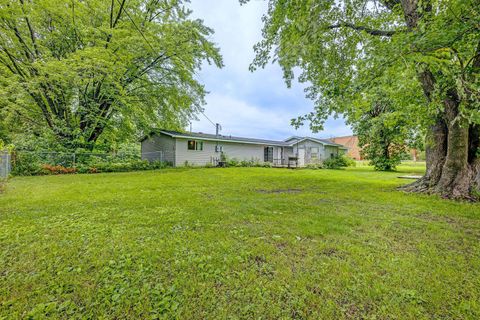
Active
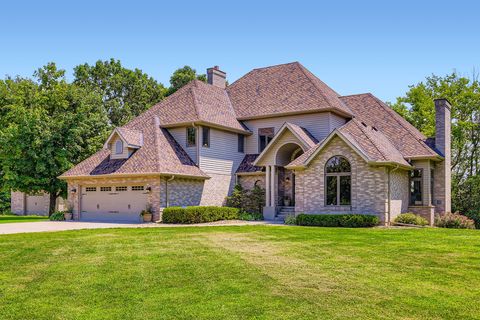
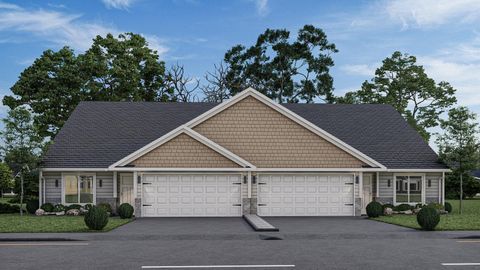
$365,900
4
bds
|
2
ba
|
1,550
sqft
|
built
1992
27475 Felton Ave, Wyoming, MN 55092
$-316
Cash flow
-4.5%
Cash-on-Cash Return
4.6%
Cap rate
0.7%
Rent to Value Ratio
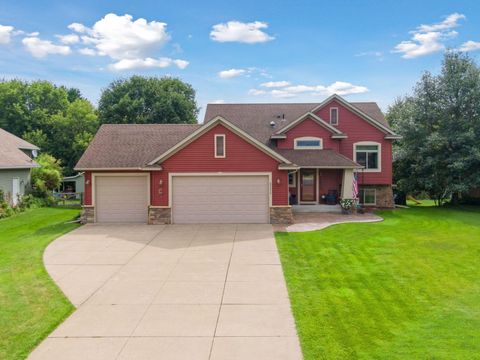
Active
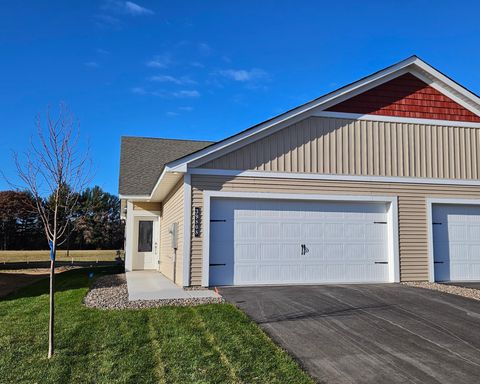
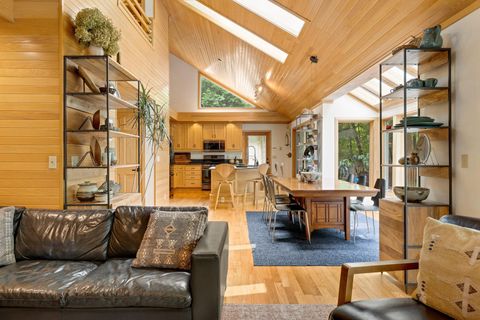
$467,700
4
bds
|
2
ba
|
2,121
sqft
|
built
2009
27575 Lacy Ave, Chisago City, MN 55013
$-617
Cash flow
-6.9%
Cash-on-Cash Return
4.1%
Cap rate
0.6%
Rent to Value Ratio

Active
$559,900
4
bds
|
4
ba
|
3,622
sqft
|
built
2013
24380 Holm Oak Ave N, Forest Lake, MN 55025
$-1,011
Cash flow
-9.4%
Cash-on-Cash Return
3.5%
Cap rate
0.6%
Rent to Value Ratio
Active
$235,000
3
bds
|
1
ba
|
1,039
sqft
|
built
1970
120 S Irving Ave, Rush City, MN 55069
$-61
Cash flow
-1.4%
Cash-on-Cash Return
5.4%
Cap rate
0.8%
Rent to Value Ratio
Active
$535,835
2
bds
|
2
ba
|
1,526
sqft
|
built
2025
12588 Masters Ln, Lindstrom, MN 55045
$-218
Cash flow
-2.1%
Cash-on-Cash Return
5.2%
Cap rate
0.7%
Rent to Value Ratio
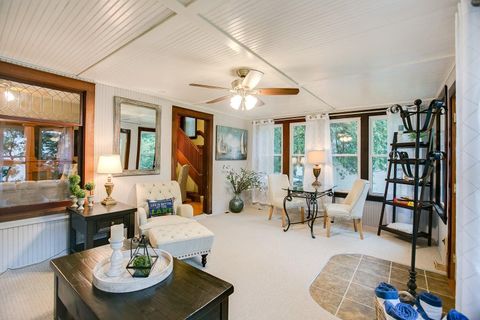
Active
$559,000
3
bds
|
2
ba
|
1,700
sqft
|
built
1918
29386 Leilani Ln, Chisago City, MN 55013
$-964
Cash flow
-9.0%
Cash-on-Cash Return
3.6%
Cap rate
0.6%
Rent to Value Ratio
Active
$749,900
4
bds
|
4
ba
|
2,937
sqft
|
built
2002
35887 Oasis Rd, Lindstrom, MN 55045
$-1,603
Cash flow
-11.2%
Cash-on-Cash Return
3.1%
Cap rate
0.4%
Rent to Value Ratio
Active
$989,000
4
bds
|
3
ba
|
3,722
sqft
|
built
1990
12998 Maxwell Rd, Chisago City, MN 55013
$-1,494
Cash flow
-7.9%
Cash-on-Cash Return
3.9%
Cap rate
0.5%
Rent to Value Ratio
Active
$410,000
3
bds
|
2
ba
|
1,916
sqft
|
built
1978
32405 Elk Ct, Stacy, MN 55079
$-494
Cash flow
-6.3%
Cash-on-Cash Return
4.2%
Cap rate
0.6%
Rent to Value Ratio

Active
$299,900
3
bds
|
2
ba
|
1,427
sqft
|
built
2021
475 Bryant St E, Rush City, MN 55069
$-205
Cash flow
-3.6%
Cash-on-Cash Return
4.9%
Cap rate
0.7%
Rent to Value Ratio
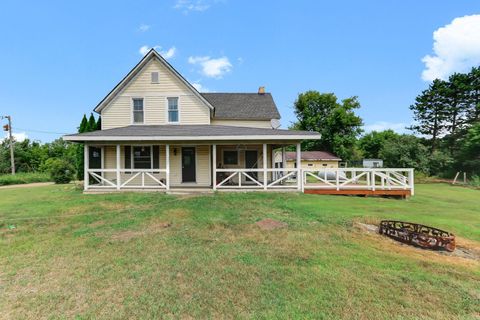
Active
$305,000
4
bds
|
2
ba
|
1,669
sqft
|
built
1905
5048 450th St, Harris, MN 55032
$-161
Cash flow
-2.8%
Cash-on-Cash Return
5.0%
Cap rate
0.7%
Rent to Value Ratio
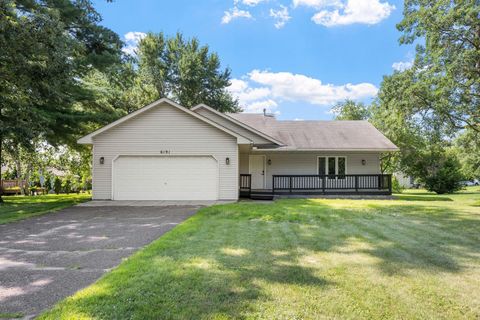
Active
$349,900
4
bds
|
2
ba
|
2,158
sqft
|
built
1996
6191 Albert Ln, North Branch, MN 55056
$-197
Cash flow
-2.9%
Cash-on-Cash Return
5.0%
Cap rate
0.7%
Rent to Value Ratio
Active
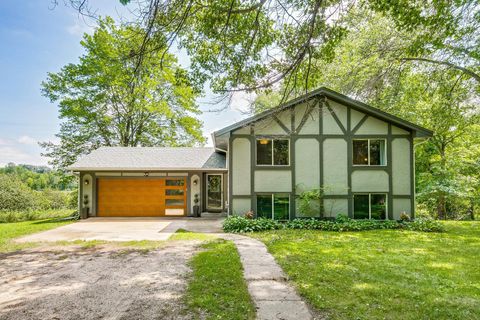
$389,900
3
bds
|
2
ba
|
1,912
sqft
|
built
1970
15385 310th St, Center City, MN 55012
$-533
Cash flow
-7.1%
Cash-on-Cash Return
4.0%
Cap rate
0.6%
Rent to Value Ratio
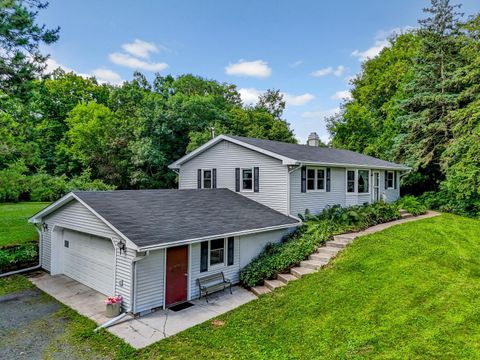
Active
$425,000
3
bds
|
1
ba
|
1,292
sqft
|
built
1970
37444 Falcon Ave, North Branch, MN 55056
$-703
Cash flow
-8.6%
Cash-on-Cash Return
3.7%
Cap rate
0.5%
Rent to Value Ratio
Active
$675,000
3
bds
|
3
ba
|
3,715
sqft
|
built
1997
40881 Greystone Ave, North Branch, MN 55056
$-1,662
Cash flow
-12.8%
Cash-on-Cash Return
2.7%
Cap rate
0.5%
Rent to Value Ratio
Active
$724,900
2
bds
|
3
ba
|
1,768
sqft
|
built
1955
14144 Old Holt Ct, Lindstrom, MN 55045
$-1,890
Cash flow
-13.6%
Cash-on-Cash Return
2.5%
Cap rate
0.4%
Rent to Value Ratio
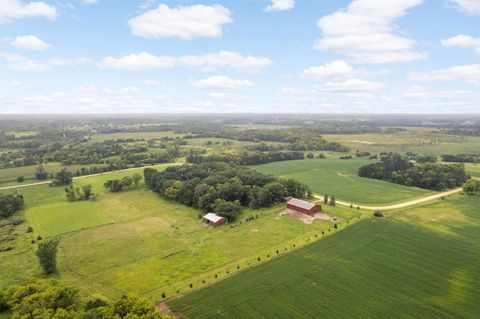
Active
$400,000
4
bds
|
2
ba
|
2,300
sqft
|
built
1904
2440 Rush Point Dr, Rush City, MN 55069
$-345
Cash flow
-4.5%
Cash-on-Cash Return
4.6%
Cap rate
0.6%
Rent to Value Ratio
Active
$649,900
5
bds
|
5
ba
|
4,538
sqft
|
built
2005
38104 Everton Ave, North Branch, MN 55056
$-1,485
Cash flow
-11.9%
Cash-on-Cash Return
2.9%
Cap rate
0.5%
Rent to Value Ratio

Active
$665,000
3
bds
|
3
ba
|
2,052
sqft
|
built
1995
1708 430th St W, Harris, MN 55032
$-1,736
Cash flow
-13.6%
Cash-on-Cash Return
2.5%
Cap rate
0.4%
Rent to Value Ratio
Active
$415,000
3
bds
|
3
ba
|
2,806
sqft
|
built
1900
631 Bench St, Taylors Falls, MN 55084
$-509
Cash flow
-6.4%
Cash-on-Cash Return
4.2%
Cap rate
0.6%
Rent to Value Ratio

Active
$490,000
3
bds
|
3
ba
|
2,583
sqft
|
built
2001
51823 Birch Ave, Rush City, MN 55069
$-583
Cash flow
-6.2%
Cash-on-Cash Return
4.3%
Cap rate
0.6%
Rent to Value Ratio
Active
$260,000
3
bds
|
2
ba
|
1,805
sqft
|
built
2004
5674 Sherman Oaks Rd, Stacy, MN 55079
$-321
Cash flow
-6.4%
Cash-on-Cash Return
4.2%
Cap rate
0.8%
Rent to Value Ratio
Active
$365,000
4
bds
|
2
ba
|
1,883
sqft
|
built
2011
7893 384th Trl, North Branch, MN 55056
$-328
Cash flow
-4.7%
Cash-on-Cash Return
4.6%
Cap rate
0.7%
Rent to Value Ratio

Active
$279,900
2
bds
|
2
ba
|
1,452
sqft
|
built
2007
1430 S Irving Ave, Rush City, MN 55069
$-335
Cash flow
-6.2%
Cash-on-Cash Return
4.2%
Cap rate
0.8%
Rent to Value Ratio
Active
$369,750
4
bds
|
2
ba
|
2,205
sqft
|
built
1983
4885 262nd St, Wyoming, MN 55092
$-333
Cash flow
-4.7%
Cash-on-Cash Return
4.6%
Cap rate
0.6%
Rent to Value Ratio
Active
$369,000
2
bds
|
2
ba
|
1,126
sqft
|
built
2025
37569 Greenwich Ct, North Branch, MN 55056
$-960
Cash flow
-13.6%
Cash-on-Cash Return
2.6%
Cap rate
0.3%
Rent to Value Ratio
Active
$1,599,900
4
bds
|
5
ba
|
4,892
sqft
|
built
1993
9739 Bjorkman Ln, Chisago City, MN 55013
$-5,132
Cash flow
-16.7%
Cash-on-Cash Return
1.8%
Cap rate
0.4%
Rent to Value Ratio
Active
$279,900
2
bds
|
1
ba
|
952
sqft
|
built
2025
5324 397th St, North Branch, MN 55056
$-633
Cash flow
-11.8%
Cash-on-Cash Return
3.0%
Cap rate
0.4%
Rent to Value Ratio
Active
$284,900
2
bds
|
1
ba
|
952
sqft
|
built
2025
5328 397th St, North Branch, MN 55056
$-656
Cash flow
-12.0%
Cash-on-Cash Return
2.9%
Cap rate
0.4%
Rent to Value Ratio
Active
$449,900
2
bds
|
2
ba
|
1,454
sqft
|
built
2024
12765 292nd Ln, Lindstrom, MN 55045
$-636
Cash flow
-7.4%
Cash-on-Cash Return
4.0%
Cap rate
0.6%
Rent to Value Ratio
Active
$339,900
2
bds
|
2
ba
|
1,450
sqft
|
built
2025
917 Gable St, Taylors Falls, MN 55084
$-402
Cash flow
-6.2%
Cash-on-Cash Return
4.3%
Cap rate
0.6%
Rent to Value Ratio
Active
$675,000
3
bds
|
3
ba
|
3,638
sqft
|
built
1994
25633 E Comfort Dr, Chisago City, MN 55013
$-1,406
Cash flow
-10.9%
Cash-on-Cash Return
3.2%
Cap rate
0.5%
Rent to Value Ratio
Active
$489,000
4
bds
|
2
ba
|
2,170
sqft
|
built
1977
7567 Lent Trl, Stacy, MN 55079
$-557
Cash flow
-5.9%
Cash-on-Cash Return
4.3%
Cap rate
0.6%
Rent to Value Ratio
Active
$475,900
4
bds
|
2
ba
|
2,336
sqft
|
built
1993
5960 425th St, Harris, MN 55032
$-881
Cash flow
-9.7%
Cash-on-Cash Return
3.5%
Cap rate
0.5%
Rent to Value Ratio
Active
$944,750
5
bds
|
6
ba
|
7,716
sqft
|
built
1996
7884 341st St, Stacy, MN 55079
$-2,466
Cash flow
-13.6%
Cash-on-Cash Return
2.5%
Cap rate
0.4%
Rent to Value Ratio
Active
$935,000
4
bds
|
2
ba
|
3,041
sqft
|
built
1988
17002 260th St, Lindstrom, MN 55045
$-1,974
Cash flow
-11.0%
Cash-on-Cash Return
3.1%
Cap rate
0.5%
Rent to Value Ratio
Active
$599,900
4
bds
|
2
ba
|
2,200
sqft
|
built
1904
216 Summit Ave, Center City, MN 55012
$-1,462
Cash flow
-12.7%
Cash-on-Cash Return
2.8%
Cap rate
0.4%
Rent to Value Ratio
Active
$419,900
2
bds
|
2
ba
|
1,502
sqft
|
built
2025
31079 Magnolia Ln, Lindstrom, MN 55045
$-1,385
Cash flow
-17.2%
Cash-on-Cash Return
1.7%
Cap rate
0.3%
Rent to Value Ratio