Nassau County Investment Properties for Sale
Browse homes for sale and investment properties in Nassau County. Refine your search by price, property type, or more.
Best cash flowing properties in Nassau County
Active
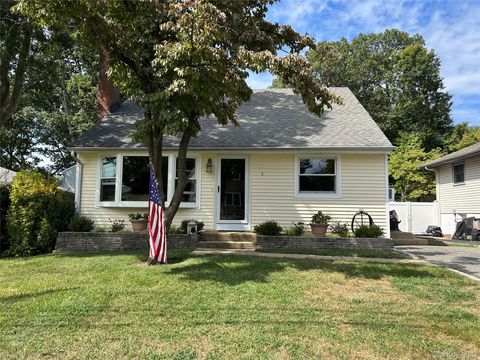
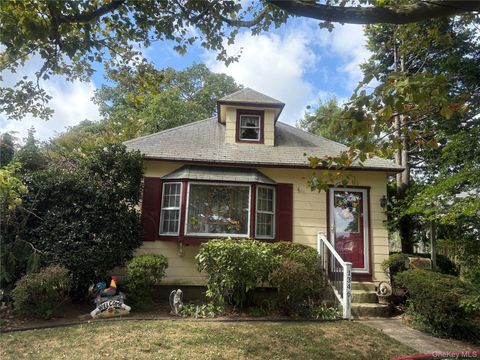
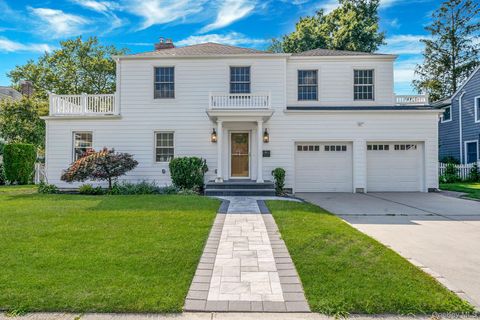
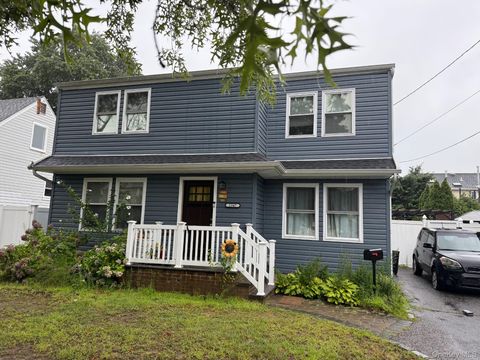
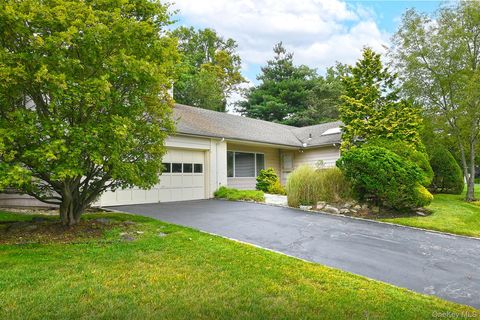
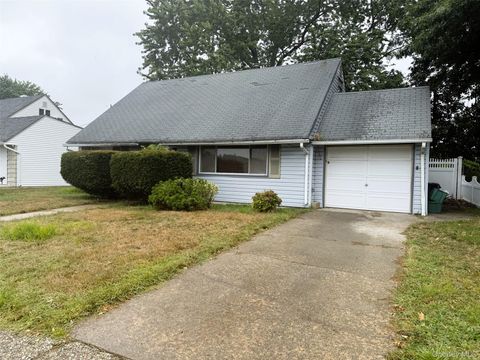
$735,000
4
bds
|
2
ba
|
1,420
sqft
|
built
1957
3 Knollwood Ave, Bayville, NY 11709
$-1,393
Cash flow
-9.9%
Cash-on-Cash Return
3.8%
Cap rate
0.6%
Rent to Value Ratio
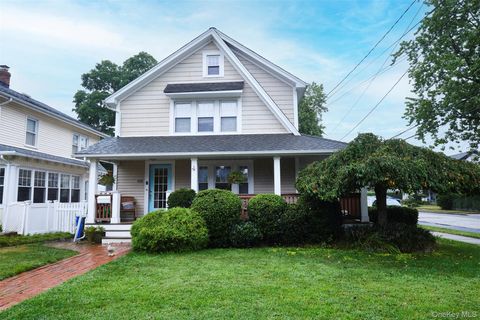
Active
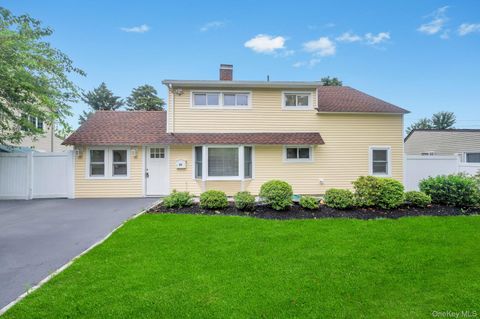
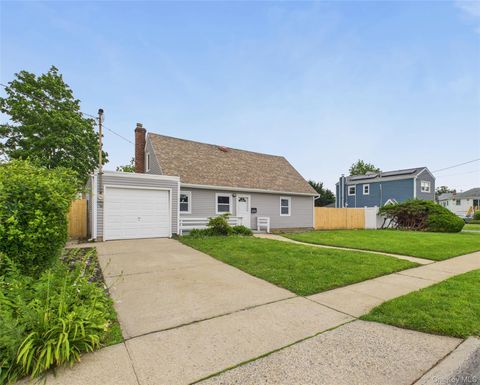
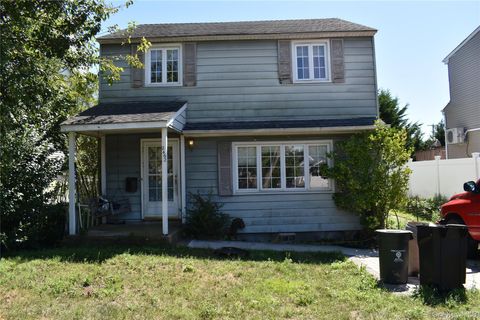
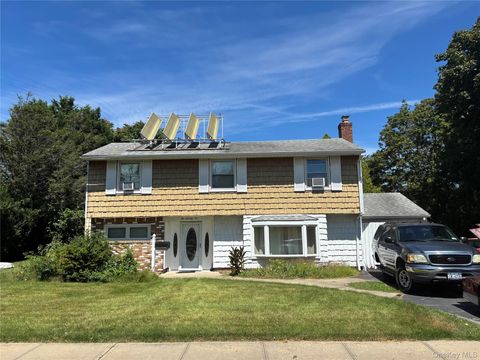
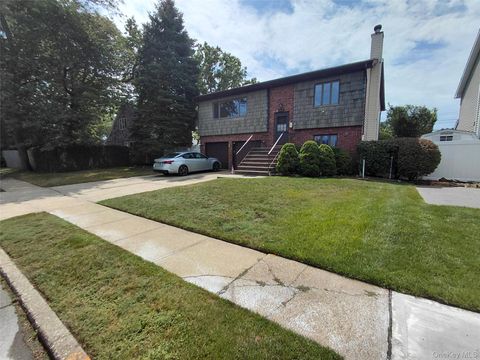
$775,000
5
bds
|
2
ba
|
1,720
sqft
|
built
1948
33 Beacon Ln, Hicksville, NY 11801
$-1,500
Cash flow
-10.1%
Cash-on-Cash Return
3.7%
Cap rate
0.6%
Rent to Value Ratio
1,342 out of 1,530 properties for sale in Nassau County
Limited Results Shown
Create a free account, or log in to reveal all property listings and enjoy the complete experience.
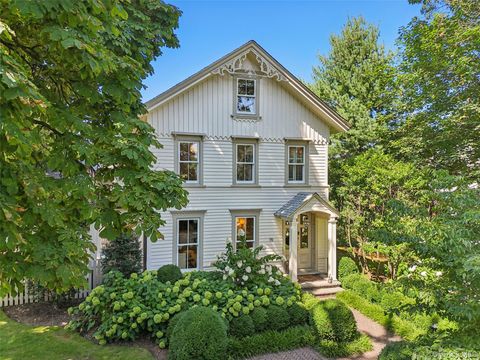
Active
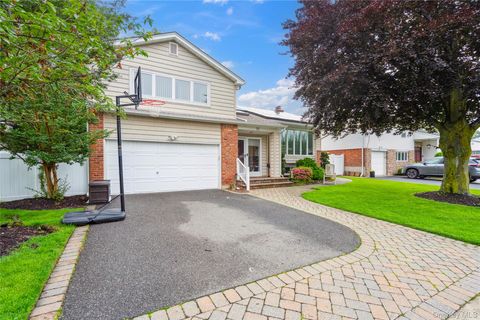
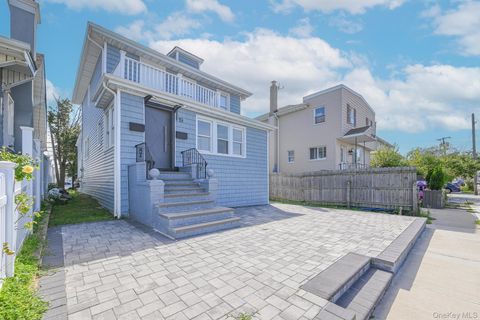
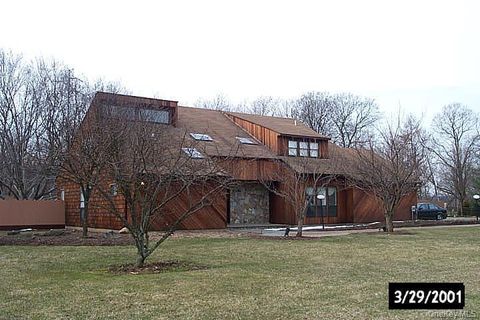
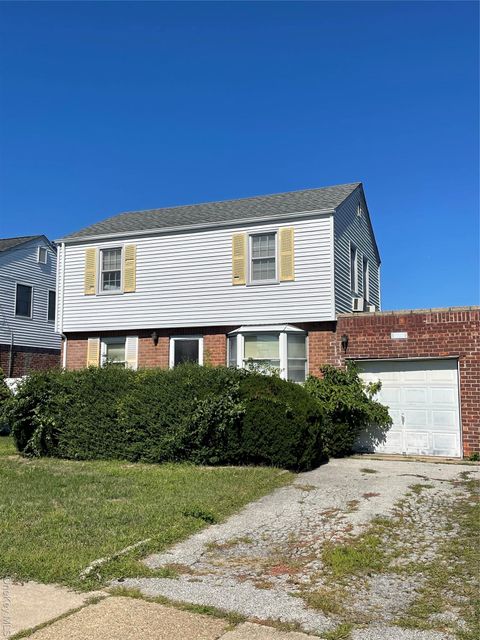
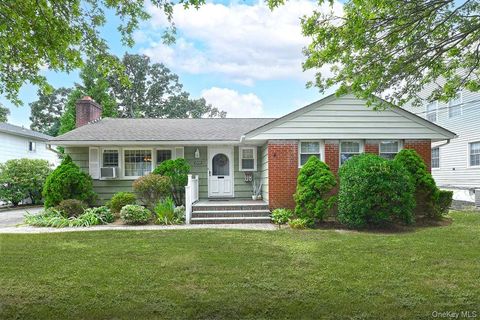
$1,088,000
5
bds
|
3
ba
|
2,138
sqft
|
built
1959
11 Robin Ln, Plainview, NY 11803
$-2,760
Cash flow
-13.2%
Cash-on-Cash Return
3.0%
Cap rate
0.6%
Rent to Value Ratio
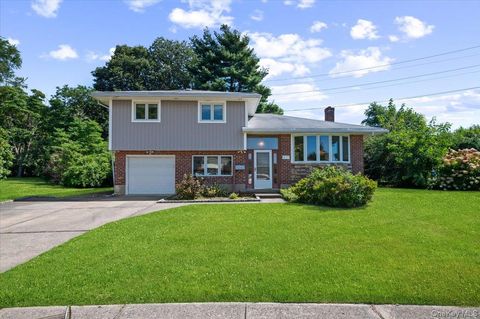
Active
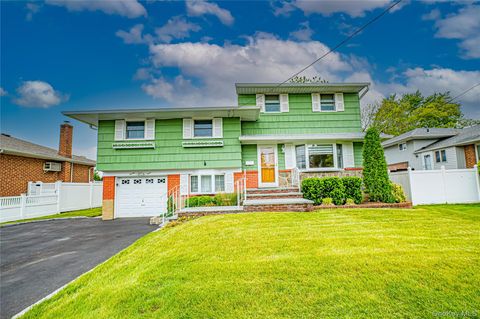
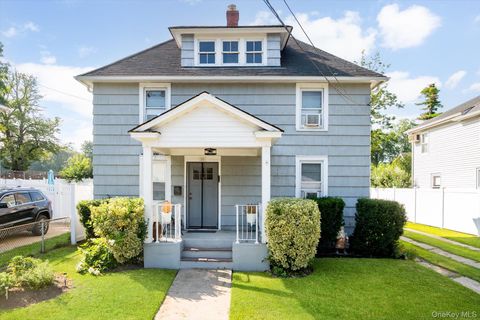
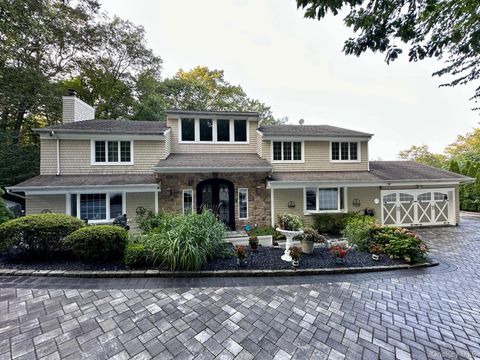
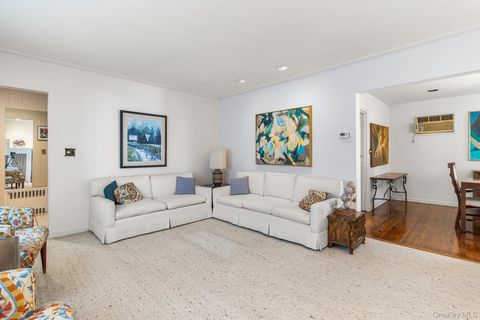
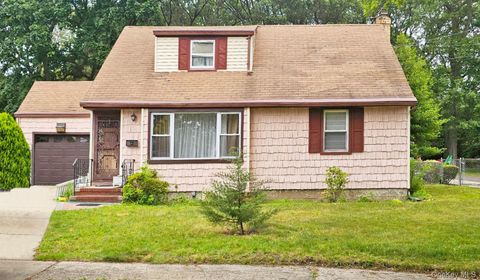
$895,000
5
bds
|
3
ba
|
2,318
sqft
|
built
1955
28 Chance St, Hicksville, NY 11801
$-2,887
Cash flow
-16.8%
Cash-on-Cash Return
2.2%
Cap rate
0.4%
Rent to Value Ratio
Active
$650,000
2
bds
|
1
ba
|
1,000
sqft
|
built
1920
1346 Bellmore Ave, North Bellmore, NY 11710
$-1,918
Cash flow
-15.4%
Cash-on-Cash Return
2.5%
Cap rate
0.4%
Rent to Value Ratio
Active
$679,999
5
bds
|
2
ba
|
1,428
sqft
|
built
1950
1057 Washington St, Baldwin, NY 11510
$-1,711
Cash flow
-13.1%
Cash-on-Cash Return
3.0%
Cap rate
0.6%
Rent to Value Ratio
Active
$777,000
4
bds
|
0
ba
|
0
sqft
|
built
1935
19 Parma Rd, Island Park, NY 11558
$-2,705
Cash flow
-18.2%
Cash-on-Cash Return
1.9%
Cap rate
0.4%
Rent to Value Ratio
Active
$988,000
3
bds
|
2
ba
|
1,296
sqft
|
built
1923
20 Waldo Ave, Greenvale, NY 11548
$-2,926
Cash flow
-15.5%
Cash-on-Cash Return
2.5%
Cap rate
0.4%
Rent to Value Ratio
Active
$2,150,000
4
bds
|
3
ba
|
2,750
sqft
|
built
1947
210 Roxbury Rd, Garden City, NY 11530
$-7,917
Cash flow
-19.2%
Cash-on-Cash Return
1.6%
Cap rate
0.3%
Rent to Value Ratio
Active
$599,000
3
bds
|
2
ba
|
1,248
sqft
|
built
1938
2462 Marine Pl, Bellmore, NY 11710
$-1,773
Cash flow
-15.4%
Cash-on-Cash Return
2.5%
Cap rate
0.5%
Rent to Value Ratio
Active
$1,998,000
5
bds
|
4
ba
|
3,400
sqft
|
built
1984
11 Harbor Ct E, Roslyn, NY 11576
$-6,217
Cash flow
-16.2%
Cash-on-Cash Return
2.3%
Cap rate
0.5%
Rent to Value Ratio
Active
$1,995,000
4
bds
|
4
ba
|
3,292
sqft
|
built
1987
6 Hilltop Dr, Syosset, NY 11791
$-7,333
Cash flow
-19.2%
Cash-on-Cash Return
1.7%
Cap rate
0.4%
Rent to Value Ratio
Active
$698,000
5
bds
|
2
ba
|
1,407
sqft
|
built
1949
2347 Pine St, Seaford, NY 11783
$-2,096
Cash flow
-15.7%
Cash-on-Cash Return
2.5%
Cap rate
0.5%
Rent to Value Ratio
Active
$825,000
3
bds
|
3
ba
|
1,821
sqft
|
built
1925
80 Oak St, Lynbrook, NY 11563
$-2,923
Cash flow
-18.5%
Cash-on-Cash Return
1.8%
Cap rate
0.5%
Rent to Value Ratio
Active
$2,399,000
4
bds
|
5
ba
|
3,641
sqft
|
built
1882
19 E Williston Ave, East Williston, NY 11596
$-8,728
Cash flow
-19.0%
Cash-on-Cash Return
1.7%
Cap rate
0.4%
Rent to Value Ratio
Active
$859,999
3
bds
|
2
ba
|
1,393
sqft
|
built
1958
331 Woodbridge Ln, Jericho, NY 11753
$-2,785
Cash flow
-16.9%
Cash-on-Cash Return
2.2%
Cap rate
0.5%
Rent to Value Ratio

Active
$699,888
3
bds
|
2
ba
|
0
sqft
|
built
1959
17 2nd Ave, Locust Valley, NY 11560
$-1,904
Cash flow
-14.2%
Cash-on-Cash Return
2.8%
Cap rate
0.5%
Rent to Value Ratio
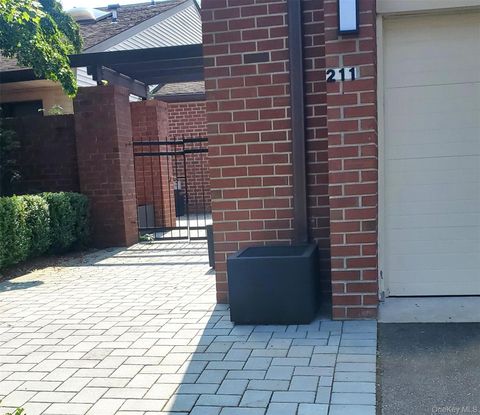
Active
$2,500,000
3
bds
|
3
ba
|
3,481
sqft
|
built
1982
211 Hornbill Dr, Manhasset, NY 11030
$-11,194
Cash flow
-23.4%
Cash-on-Cash Return
0.7%
Cap rate
0.2%
Rent to Value Ratio
Active
$1,788,888
5
bds
|
4
ba
|
2,874
sqft
|
built
2005
11 Manor Ave, Roslyn Heights, NY 11577
$-5,345
Cash flow
-15.6%
Cash-on-Cash Return
2.5%
Cap rate
0.4%
Rent to Value Ratio
Active
$569,000
2
bds
|
2
ba
|
1,142
sqft
|
built
1931
86 N Bayview Ave, Freeport, NY 11520
$-1,735
Cash flow
-15.9%
Cash-on-Cash Return
2.4%
Cap rate
0.5%
Rent to Value Ratio
Active
$1,598,000
4
bds
|
3
ba
|
0
sqft
|
built
2016
59 Delaware Ave, Long Beach, NY 11561
$-4,807
Cash flow
-15.7%
Cash-on-Cash Return
2.5%
Cap rate
0.4%
Rent to Value Ratio
Active
$739,000
3
bds
|
2
ba
|
1,624
sqft
|
built
1929
10 Dart St, East Rockaway, NY 11518
$-2,689
Cash flow
-19.0%
Cash-on-Cash Return
1.7%
Cap rate
0.4%
Rent to Value Ratio
Active
$1,450,000
4
bds
|
2
ba
|
1,900
sqft
|
built
1974
221 Washington Blvd, Long Beach, NY 11561
$-4,783
Cash flow
-17.2%
Cash-on-Cash Return
2.1%
Cap rate
0.4%
Rent to Value Ratio
Active
$699,000
3
bds
|
1
ba
|
1,098
sqft
|
built
1954
233 Lee Ave, Hicksville, NY 11801
$-1,905
Cash flow
-14.2%
Cash-on-Cash Return
2.8%
Cap rate
0.5%
Rent to Value Ratio
Active
$1,298,000
4
bds
|
2
ba
|
1,989
sqft
|
built
1926
888 Cambridge Rd, Woodmere, NY 11598
$-4,120
Cash flow
-16.6%
Cash-on-Cash Return
2.3%
Cap rate
0.4%
Rent to Value Ratio
Active
$1,226,000
3
bds
|
3
ba
|
1,950
sqft
|
built
1953
8 South Dr, Roslyn, NY 11576
$-4,547
Cash flow
-19.4%
Cash-on-Cash Return
1.6%
Cap rate
0.4%
Rent to Value Ratio
Active
$690,000
3
bds
|
2
ba
|
1,742
sqft
|
built
1957
275 N Utica Ave, Massapequa, NY 11758
$-1,907
Cash flow
-14.4%
Cash-on-Cash Return
2.8%
Cap rate
0.6%
Rent to Value Ratio
Active
$750,000
3
bds
|
2
ba
|
1,456
sqft
|
built
1948
424 Andrews Rd, Mineola, NY 11501
$-1,798
Cash flow
-12.5%
Cash-on-Cash Return
3.2%
Cap rate
0.5%
Rent to Value Ratio
Active
$849,999
4
bds
|
2
ba
|
1,464
sqft
|
built
1946
19 Dallas Ave, New Hyde Park, NY 11040
$-2,642
Cash flow
-16.2%
Cash-on-Cash Return
2.3%
Cap rate
0.5%
Rent to Value Ratio
Active
$589,000
4
bds
|
2
ba
|
1,190
sqft
|
built
1950
3157 Brixton Ln, Levittown, NY 11756
$-1,581
Cash flow
-14.0%
Cash-on-Cash Return
2.8%
Cap rate
0.6%
Rent to Value Ratio
Active
$848,999
5
bds
|
3
ba
|
2,464
sqft
|
built
1987
3592 Southview Ave, Wantagh, NY 11793
$-2,655
Cash flow
-16.3%
Cash-on-Cash Return
2.3%
Cap rate
0.5%
Rent to Value Ratio
Active
$749,000
3
bds
|
2
ba
|
1,158
sqft
|
built
1953
1914 Bergen St, Bellmore, NY 11710
$-2,619
Cash flow
-18.2%
Cash-on-Cash Return
1.9%
Cap rate
0.4%
Rent to Value Ratio
Active
$649,999
4
bds
|
1
ba
|
1,360
sqft
|
built
1951
539 Mitchell St, Uniondale, NY 11553
$-1,657
Cash flow
-13.3%
Cash-on-Cash Return
3.0%
Cap rate
0.6%
Rent to Value Ratio
Active
$899,000
4
bds
|
3
ba
|
2,046
sqft
|
built
1953
208 Oak St, Massapequa Park, NY 11762
$-3,469
Cash flow
-20.1%
Cash-on-Cash Return
1.4%
Cap rate
0.4%
Rent to Value Ratio
Active
$799,000
2
bds
|
2
ba
|
1,238
sqft
|
built
2004
43 Miro Pl, Port Washington, NY 11050
$-2,950
Cash flow
-19.3%
Cash-on-Cash Return
1.6%
Cap rate
0.5%
Rent to Value Ratio
Active
$987,000
3
bds
|
2
ba
|
1,648
sqft
|
built
1941
47 Orchid St, Floral Park, NY 11001
$-4,126
Cash flow
-21.8%
Cash-on-Cash Return
1.1%
Cap rate
0.3%
Rent to Value Ratio
Active
$1,150,000
5
bds
|
4
ba
|
2,264
sqft
|
built
1986
34 Vandewater Ave, Floral Park, NY 11001
$-4,795
Cash flow
-21.8%
Cash-on-Cash Return
1.1%
Cap rate
0.3%
Rent to Value Ratio
Active
$775,000
3
bds
|
2
ba
|
1,300
sqft
|
built
1953
344 N Hickory St, Massapequa, NY 11758
$-2,710
Cash flow
-18.2%
Cash-on-Cash Return
1.9%
Cap rate
0.5%
Rent to Value Ratio
Active
$1,099,999
5
bds
|
3
ba
|
2,158
sqft
|
built
1962
1918 Lenox Ave, East Meadow, NY 11554
$-3,994
Cash flow
-18.9%
Cash-on-Cash Return
1.7%
Cap rate
0.4%
Rent to Value Ratio
Active
$1,150,000
5
bds
|
4
ba
|
3,000
sqft
|
built
2005
27 Dale Dr, Farmingdale, NY 11735
$-3,596
Cash flow
-16.3%
Cash-on-Cash Return
2.3%
Cap rate
0.5%
Rent to Value Ratio