United States Investment Properties for Sale
Browse homes for sale and investment properties in United States. Refine your search by price, property type, or more.
Best cash flowing properties in United States
Active
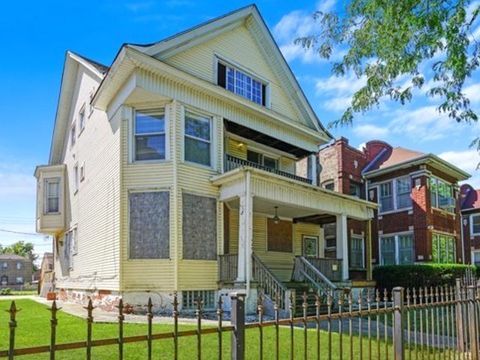
$135,000
6
bds
|
3
ba
|
0
sqft
|
built
1894
2115 E 72nd Pl, Chicago, IL 60649
$736
Cash flow
28.4%
Cash-on-Cash Return
12.2%
Cap rate
1.7%
Rent to Value Ratio
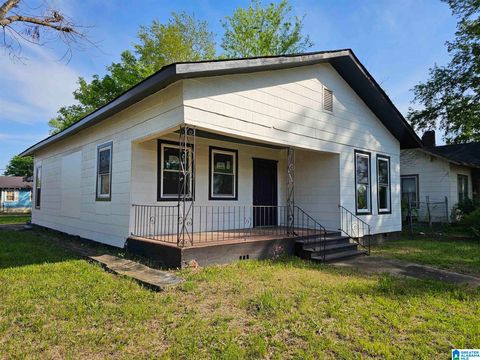
Active
$84,900
4
bds
|
2
ba
|
1,509
sqft
|
built
1930
1701 Avenue I, Birmingham, AL 35218
$357
Cash flow
21.9%
Cash-on-Cash Return
10.7%
Cap rate
1.3%
Rent to Value Ratio
10,000 out of 322,835 properties for sale in United States
Limited Results Shown
Create a free account, or log in to reveal all property listings and enjoy the complete experience.
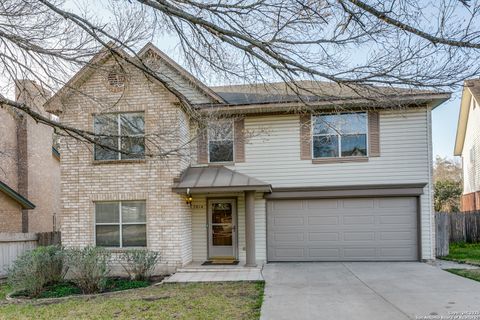
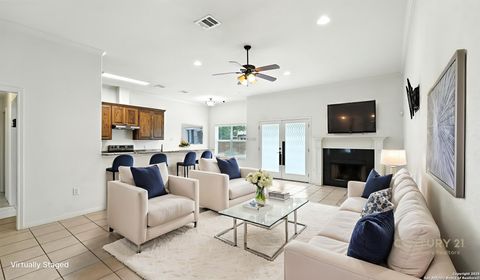
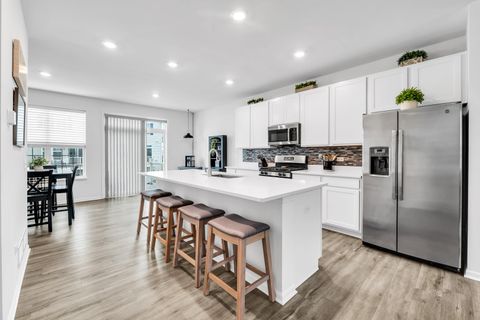
Active
$358,750
3
bds
|
3
ba
|
2,515
sqft
|
built
1995
2814 Redrock Trl, San Antonio, TX 78259
$-762
Cash flow
-11.1%
Cash-on-Cash Return
3.1%
Cap rate
0.6%
Rent to Value Ratio
Active
$345,000
4
bds
|
2
ba
|
1,943
sqft
|
built
2008
637 Topaz Ave, Seguin, TX 78155
$-804
Cash flow
-12.2%
Cash-on-Cash Return
2.9%
Cap rate
0.6%
Rent to Value Ratio
Active
$634,900
4
bds
|
3.5
ba
|
3,531
sqft
|
built
2012
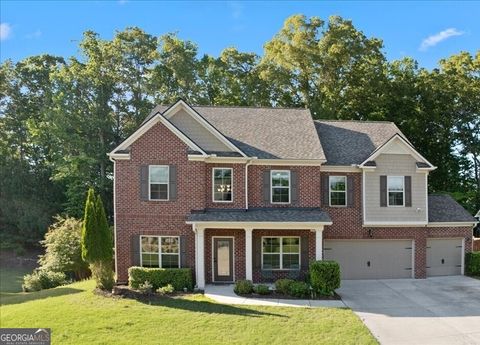
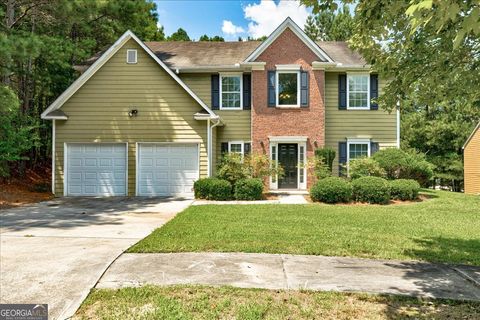
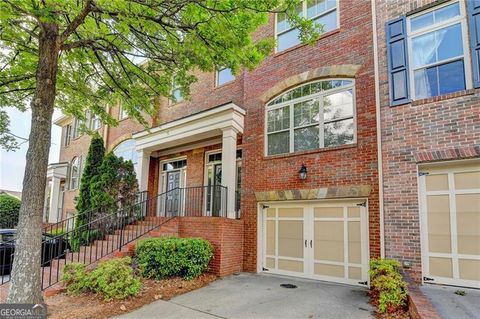
211 Parc Dr, Canton, GA 30114
$-2,121
Cash flow
-17.4%
Cash-on-Cash Return
2.1%
Cap rate
0.4%
Rent to Value Ratio
Active
$300,000
3
bds
|
3
ba
|
1,558
sqft
|
built
2007
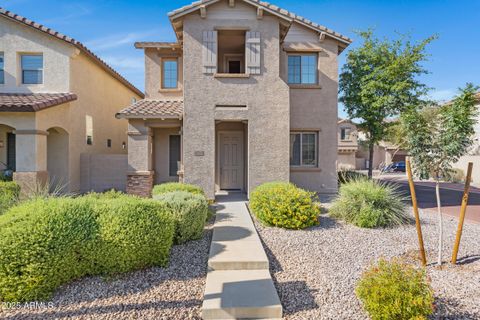
9148 W Meadow Dr, Peoria, AZ 85382
$-272
Cash flow
-4.7%
Cash-on-Cash Return
4.6%
Cap rate
0.7%
Rent to Value Ratio
Active
$749,000
2
bds
|
2.5
ba
|
0
sqft
|
built
2000
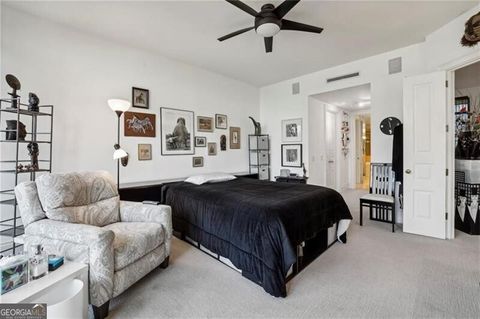
750 Park Ave NE, Atlanta, GA 30326
$-1,080
Cash flow
-7.5%
Cash-on-Cash Return
4.4%
Cap rate
0.7%
Rent to Value Ratio
Active
$330,000
4
bds
|
2
ba
|
2,426
sqft
|
built
1973
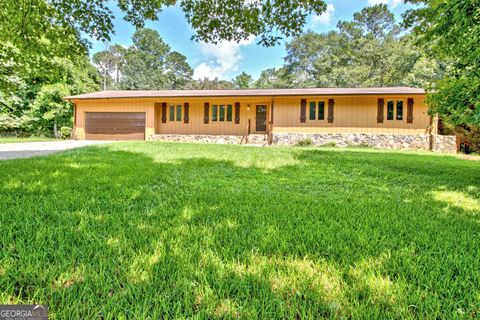
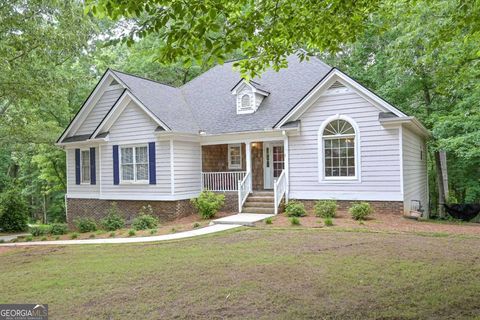
175 Thigpen Rd, Newnan, GA 30263
$-511
Cash flow
-8.1%
Cash-on-Cash Return
4.3%
Cap rate
0.6%
Rent to Value Ratio
Active
$299,900
4
bds
|
2.5
ba
|
2,255
sqft
|
built
2003
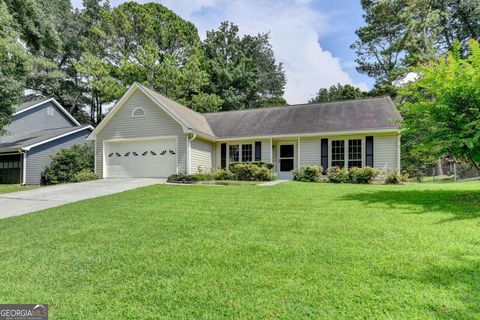
5725 Cedar Pass, Fairburn, GA 30213
$-258
Cash flow
-4.5%
Cash-on-Cash Return
5.1%
Cap rate
0.8%
Rent to Value Ratio
Active
$385,000
3
bds
|
2.5
ba
|
2,470
sqft
|
built
1995
7533 Mason Falls Dr, Winston, GA 30187
$-626
Cash flow
-8.5%
Cash-on-Cash Return
4.2%
Cap rate
0.6%
Rent to Value Ratio

Active
$500,000
5
bds
|
3.5
ba
|
3,280
sqft
|
built
2013
3024 Bridgehaven Ct, Snellville, GA 30039
$-989
Cash flow
-10.3%
Cash-on-Cash Return
3.8%
Cap rate
0.5%
Rent to Value Ratio
Active
$410,000
3
bds
|
2
ba
|
1,924
sqft
|
built
1986
1107 Sanfords Walk, Tucker, GA 30084
$-454
Cash flow
-5.8%
Cash-on-Cash Return
4.8%
Cap rate
0.6%
Rent to Value Ratio
Active
$735,000
3
bds
|
4
ba
|
0
sqft
|
built
2020
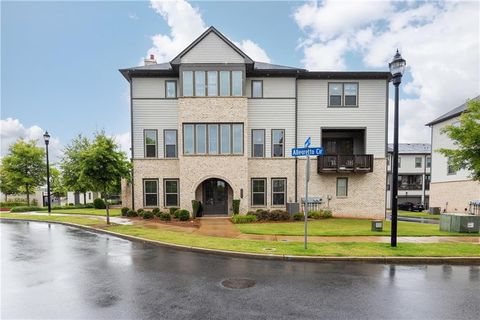
3900 Danube Ln, Atlanta, GA 30339
$-1,305
Cash flow
-9.3%
Cash-on-Cash Return
4.0%
Cap rate
0.7%
Rent to Value Ratio
Active
$470,000
3
bds
|
3.5
ba
|
2,000
sqft
|
built
2004
10898 Gallier St, Johns Creek, GA 30022
$-1,021
Cash flow
-11.3%
Cash-on-Cash Return
3.5%
Cap rate
0.6%
Rent to Value Ratio

Active
$975,000
6
bds
|
5
ba
|
0
sqft
|
built
1985
7750 Landowne Dr, Sandy Springs, GA 30350
$-2,847
Cash flow
-15.2%
Cash-on-Cash Return
2.6%
Cap rate
0.5%
Rent to Value Ratio
Active
$569,999
4
bds
|
3
ba
|
4,371
sqft
|
built
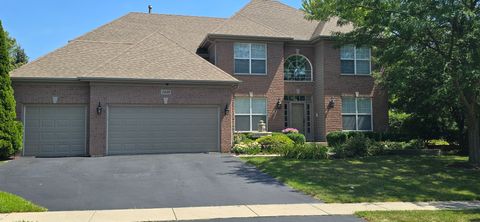
2002
1839 Kings Gate Ln, Crystal Lake, IL 60014
$-1,847
Cash flow
-16.9%
Cash-on-Cash Return
1.8%
Cap rate
0.5%
Rent to Value Ratio
Active
$246,400
3
bds
|
3
ba
|
1,371
sqft
|
built
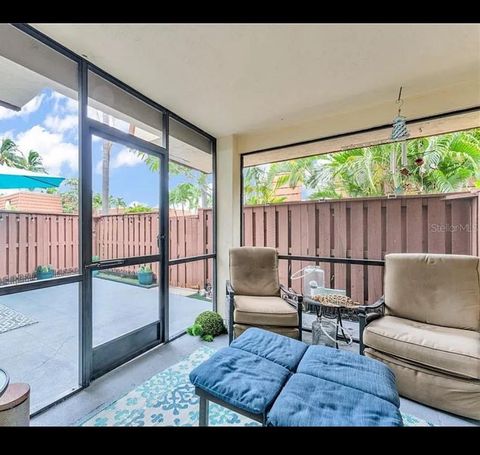
1984
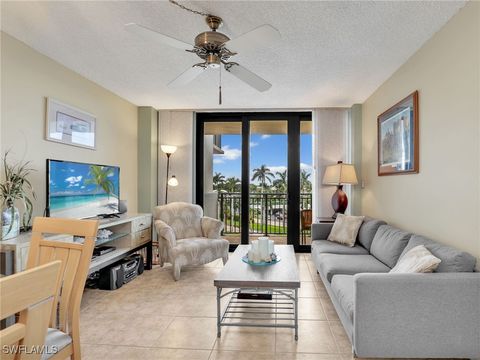
5248 Cedarbend Dr, Fort Myers, FL 33919
$-586
Cash flow
-12.4%
Cash-on-Cash Return
3.3%
Cap rate
0.8%
Rent to Value Ratio
Active
$545,000
2
bds
|
2
ba
|
1,654
sqft
|
built
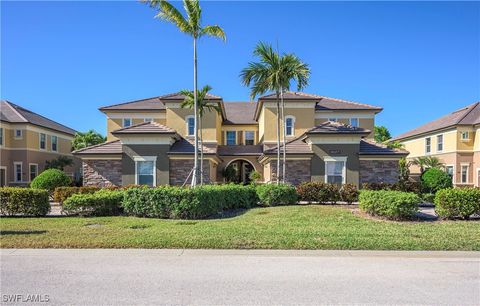
2010
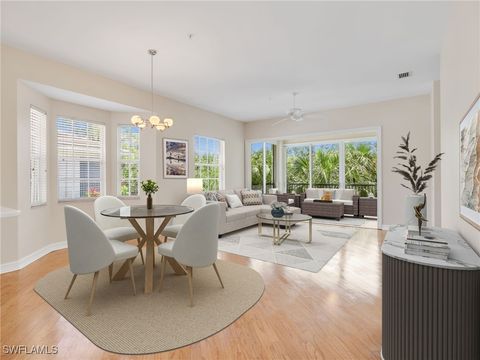
9537 Ironstone Ter, Naples, FL 34120
$-1,628
Cash flow
-15.6%
Cash-on-Cash Return
2.6%
Cap rate
0.6%
Rent to Value Ratio
Active
$450,000
4
bds
|
3
ba
|
2,434
sqft
|
built
2004
12215 Adventure Dr, Riverview, FL 33579
$-763
Cash flow
-8.8%
Cash-on-Cash Return
4.1%
Cap rate
0.6%
Rent to Value Ratio
Active
$375,000
4
bds
|
3
ba
|
1,932
sqft
|
built
2009
14013 Hollow Crest Pl, Riverview, FL 33579
$-544
Cash flow
-7.6%
Cash-on-Cash Return
4.4%
Cap rate
0.7%
Rent to Value Ratio
Active
$385,000
2
bds
|
2
ba
|
1,086
sqft
|
built
1981
6549 Creekview Ter N, Pinellas Park, FL 33781
$-763
Cash flow
-10.3%
Cash-on-Cash Return
3.8%
Cap rate
0.6%
Rent to Value Ratio
Active
$428,500
3
bds
|
2
ba
|
1,411
sqft
|
built
2004
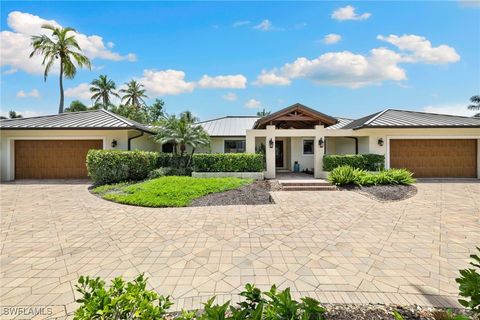
4720 22nd Ave SE, Naples, FL 34117
$-445
Cash flow
-5.4%
Cash-on-Cash Return
4.9%
Cap rate
0.7%
Rent to Value Ratio
Active
$799,000
6
bds
|
4
ba
|
3,389
sqft
|
built
1923
5706 N New Hampshire Ave, Chicago, IL 60631
$-1,968
Cash flow
-12.9%
Cash-on-Cash Return
2.7%
Cap rate
0.5%
Rent to Value Ratio
Active
$310,000
2
bds
|
3
ba
|
1,600
sqft
|
built
2020
205 Lakeshore Dr, Oswego, IL 60543
$-93
Cash flow
-1.6%
Cash-on-Cash Return
5.3%
Cap rate
1.0%
Rent to Value Ratio
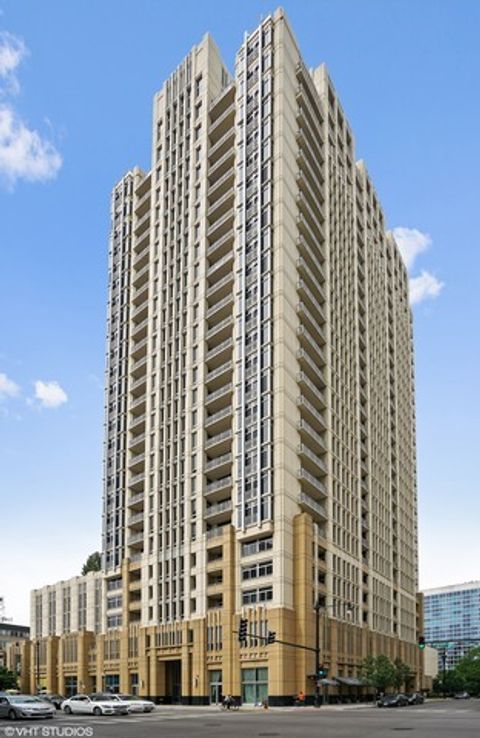
Active
$288,000
1
bds
|
1
ba
|
751
sqft
|
built
2008
1400 S Michigan Ave, Chicago, IL 60605
$-765
Cash flow
-13.9%
Cash-on-Cash Return
2.5%
Cap rate
0.8%
Rent to Value Ratio
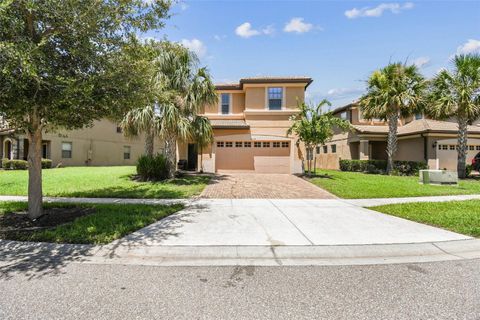
Active
$579,000
7
bds
|
6
ba
|
3,314
sqft
|
built
2018
1804 Gobi Dr, Kissimmee, FL 34747
$-1,742
Cash flow
-15.7%
Cash-on-Cash Return
2.5%
Cap rate
0.7%
Rent to Value Ratio

Active
$275,000
2
bds
|
2
ba
|
985
sqft
|
built
1981
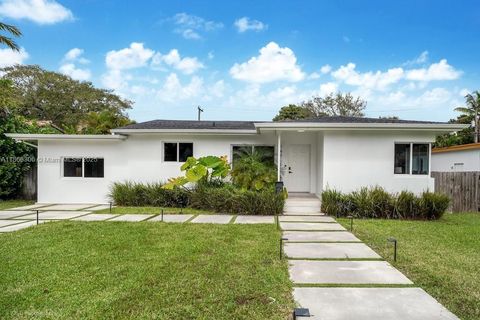
8415 SW 107th Ave, Miami, FL 33173
$-248
Cash flow
-4.7%
Cash-on-Cash Return
5.1%
Cap rate
0.9%
Rent to Value Ratio
Active
$7,495,000
4
bds
|
3
ba
|
2,755
sqft
|
built
1978
230 Champney Bay Ct, Naples, FL 34102
$-33,852
Cash flow
-23.6%
Cash-on-Cash Return
0.7%
Cap rate
0.1%
Rent to Value Ratio
Active
$429,900
1
bds
|
2
ba
|
597
sqft
|
built
1973
180 Seaview Ct, Marco Island, FL 34145
$-639
Cash flow
-7.8%
Cash-on-Cash Return
4.4%
Cap rate
0.6%
Rent to Value Ratio
Active
$995,000
3
bds
|
3
ba
|
1,831
sqft
|
built
1997
780 Bentwater Cir, Naples, FL 34108
$-1,647
Cash flow
-8.6%
Cash-on-Cash Return
4.2%
Cap rate
0.8%
Rent to Value Ratio
Active
$215,000
3
bds
|
2
ba
|
1,476
sqft
|
built
2001
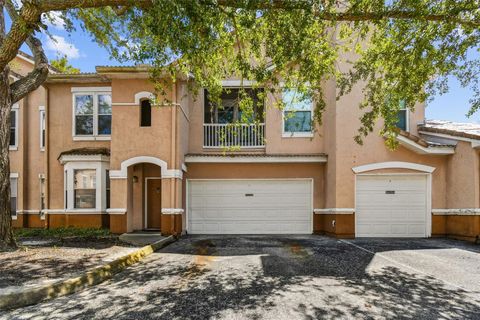
10416 Villa View Cir, Tampa, FL 33647
$-714
Cash flow
-17.3%
Cash-on-Cash Return
2.2%
Cap rate
0.9%
Rent to Value Ratio
Active
$495,000
4
bds
|
3
ba
|
2,016
sqft
|
built
2003
36825 N County Road 44 A, Eustis, FL 32736
$-603
Cash flow
-6.4%
Cash-on-Cash Return
4.7%
Cap rate
0.6%
Rent to Value Ratio
Active
$1,350,000
3
bds
|
2
ba
|
1,663
sqft
|
built
1948
149 NW 89th St, El Portal, FL 33150
$-2,710
Cash flow
-10.5%
Cash-on-Cash Return
3.7%
Cap rate
0.7%
Rent to Value Ratio
Active
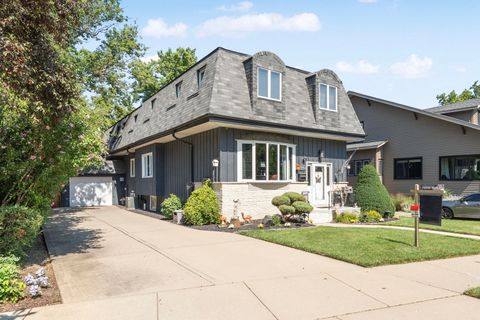
$634,900
3
bds
|
5
ba
|
2,143
sqft
|
built
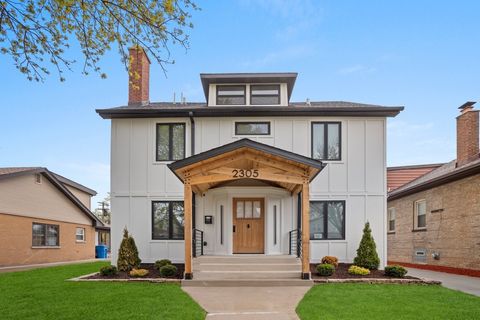
1904
2305 W 111th Pl, Chicago, IL 60643
$-1,322
Cash flow
-10.9%
Cash-on-Cash Return
3.2%
Cap rate
0.5%
Rent to Value Ratio
Active
$84,900
1
bds
|
1
ba
|
970
sqft
|
built
1973
15810 Il Route 173, Harvard, IL 60033
$-87
Cash flow
-5.3%
Cash-on-Cash Return
4.5%
Cap rate
1.2%
Rent to Value Ratio
Active
$525,000
3
bds
|
2
ba
|
1,350
sqft
|
built
1993
2421 22nd Ave NE, Naples, FL 34120
$-274
Cash flow
-2.7%
Cash-on-Cash Return
5.5%
Cap rate
0.7%
Rent to Value Ratio
Active
$7,995,000
5
bds
|
6
ba
|
4,356
sqft
|
built
2016
17824 Lee Ave, Redington Shores, FL 33708
$-39,402
Cash flow
-25.7%
Cash-on-Cash Return
0.2%
Cap rate
0.1%
Rent to Value Ratio
Active
$415,000
2
bds
|
2
ba
|
1,338
sqft
|
built
1953
3005 W Helen Ave, Tampa, FL 33611
$-925
Cash flow
-11.6%
Cash-on-Cash Return
3.5%
Cap rate
0.6%
Rent to Value Ratio
Active
$513,000
5
bds
|
5
ba
|
2,283
sqft
|
built
2021
207 Jetty Way, Davenport, FL 33897
$-1,446
Cash flow
-14.7%
Cash-on-Cash Return
2.8%
Cap rate
0.7%
Rent to Value Ratio
Active
$450,000
3
bds
|
2
ba
|
1,421
sqft
|
built
1962
4499 Neptune Dr, Hernando Beach, FL 34607
$-1,132
Cash flow
-13.1%
Cash-on-Cash Return
3.1%
Cap rate
0.5%
Rent to Value Ratio