United States Investment Properties for Sale
Browse homes for sale and investment properties in United States. Refine your search by price, property type, or more.
Best cash flowing properties in United States
Active
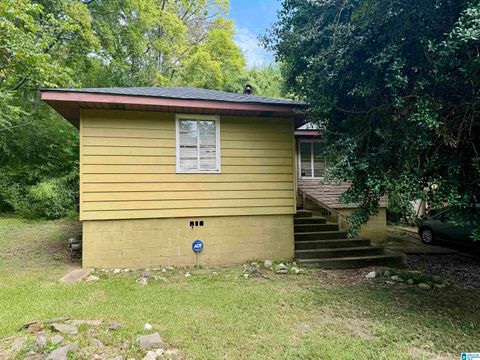
$70,000
2
bds
|
1
ba
|
906
sqft
|
built
1951
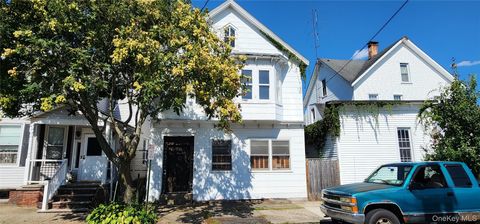
408 10th Ave, Midfield, AL 35228
$759
Cash flow
12.6%
Cash-on-Cash Return
13.0%
Cap rate
1.6%
Rent to Value Ratio
Active
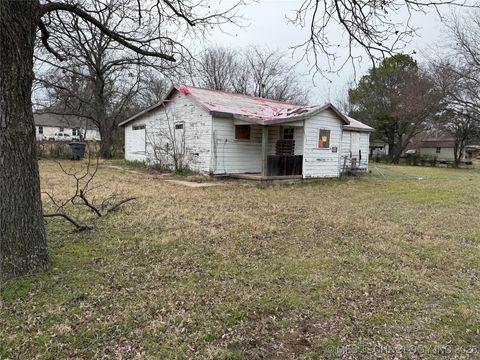
$39,008
2
bds
|
1
ba
|
1,132
sqft
|
built
1932
923 E Main St, Ardmore, OK 73401
$587
Cash flow
17.5%
Cash-on-Cash Return
18.1%
Cap rate
2.3%
Rent to Value Ratio
10,000 out of 305,267 properties for sale in United States
Limited Results Shown
Create a free account, or log in to reveal all property listings and enjoy the complete experience.

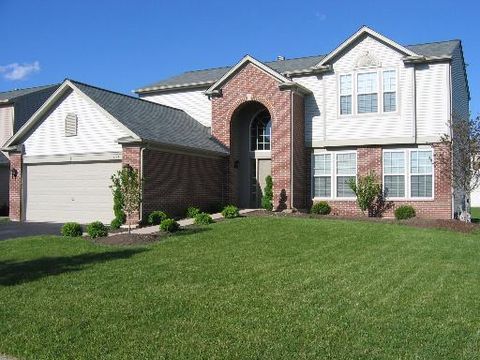
Active
$699,900
3
bds
|
2
ba
|
1,277
sqft
|
built
1976
82 Dexter Rd, Marion, MA 02738
$-1,239
Cash flow
-9.2%
Cash-on-Cash Return
3.6%
Cap rate
0.5%
Rent to Value Ratio

Active
$970,000
7
bds
|
4
ba
|
0
sqft
|
built
1993
2748 E 58th St, Huntington Park, CA 90255
$-1,455
Cash flow
-7.8%
Cash-on-Cash Return
4.3%
Cap rate
0.5%
Rent to Value Ratio
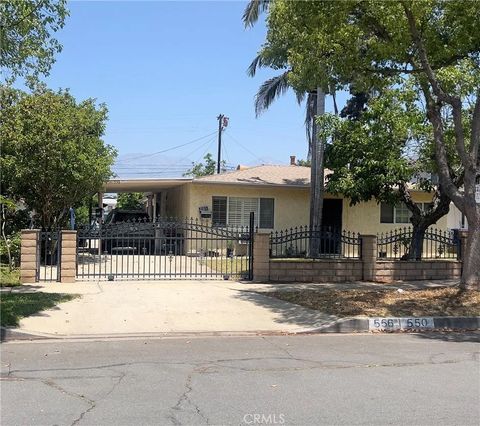
Active
$797,000
6
bds
|
2
ba
|
0
sqft
|
built
1959
550 W Belmont St, Ontario, CA 91762
$-2,167
Cash flow
-14.2%
Cash-on-Cash Return
2.8%
Cap rate
0.3%
Rent to Value Ratio
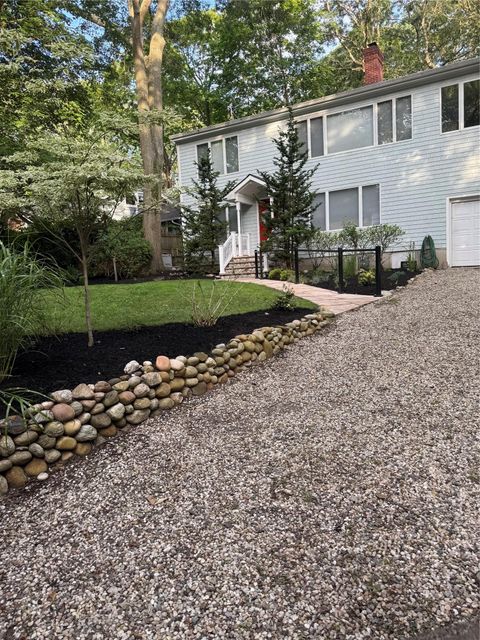
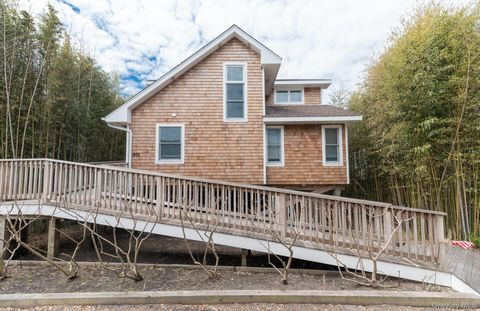
Active
$995,000
4
bds
|
3
ba
|
3,100
sqft
|
built
1971
52 Hillside Rd, Stony Brook, NY 11790
$-4,167
Cash flow
-21.9%
Cash-on-Cash Return
1.0%
Cap rate
0.3%
Rent to Value Ratio
Active
$1,598,999
4
bds
|
2
ba
|
1,757
sqft
|
built
2013
976 Surfview Walk, Ocean Beach, NY 11770
$-4,752
Cash flow
-15.5%
Cash-on-Cash Return
2.5%
Cap rate
0.4%
Rent to Value Ratio
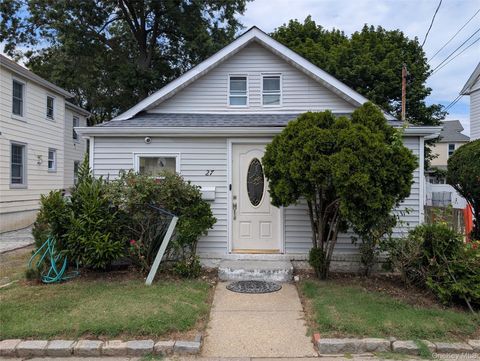
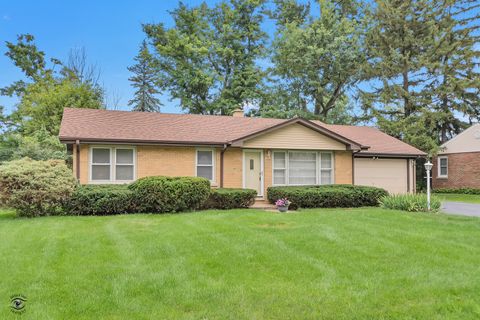
Active
$549,900
3
bds
|
2
ba
|
1,818
sqft
|
built
1900
159 Smith Ave, Kingston, NY 12401
$-1,194
Cash flow
-11.3%
Cash-on-Cash Return
3.5%
Cap rate
0.5%
Rent to Value Ratio
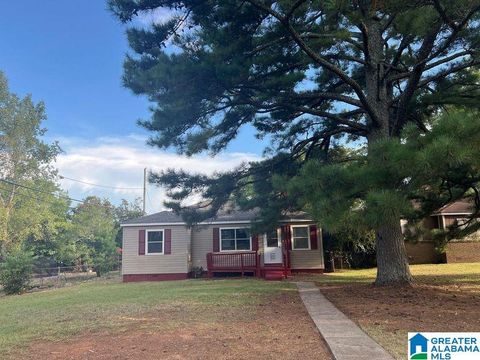
Active
$79,900
2
bds
|
1
ba
|
962
sqft
|
built
1951
721 51st St, Fairfield, AL 35064
$519
Cash flow
33.9%
Cash-on-Cash Return
13.5%
Cap rate
1.6%
Rent to Value Ratio
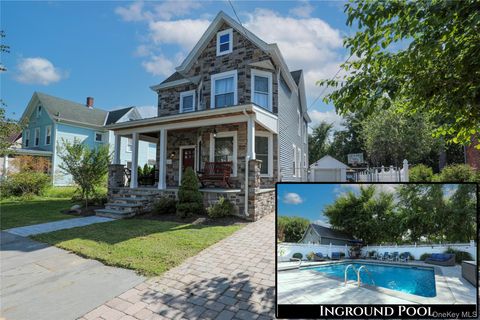
Active
$499,990
3
bds
|
2
ba
|
950
sqft
|
built
1925
27 Hoff Ct, Hempstead, NY 11550
$-1,444
Cash flow
-15.1%
Cash-on-Cash Return
2.6%
Cap rate
0.6%
Rent to Value Ratio
Active
$429,000
3
bds
|
2
ba
|
1,806
sqft
|
built
1926
11 Washington Ave, Chatham, NY 12037
$-858
Cash flow
-10.4%
Cash-on-Cash Return
3.7%
Cap rate
0.6%
Rent to Value Ratio
Active
$299,000
5
bds
|
2
ba
|
0
sqft
|
built
1857
40 King St, Port Jervis, NY 12771
$-362
Cash flow
-6.3%
Cash-on-Cash Return
4.6%
Cap rate
0.7%
Rent to Value Ratio
Active
$375,000
bds
|
0
ba
|
0
sqft
|
built
1982
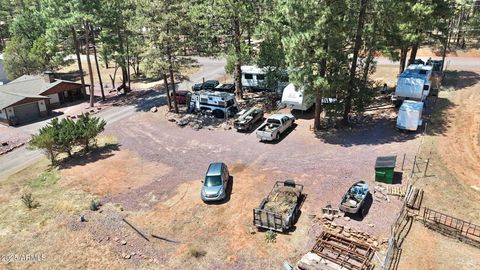
4991 N Old Spruce Dr, Pine, AZ 85544
$-604
Cash flow
-8.4%
Cash-on-Cash Return
3.7%
Cap rate
0.5%
Rent to Value Ratio

Active
$155,000
2
bds
|
1
ba
|
870
sqft
|
built
1970
19890 Highway 644, Vacherie, LA 70090
$94
Cash flow
3.2%
Cash-on-Cash Return
6.4%
Cap rate
0.8%
Rent to Value Ratio
Active
$365,000
2
bds
|
2
ba
|
900
sqft
|
built
1983
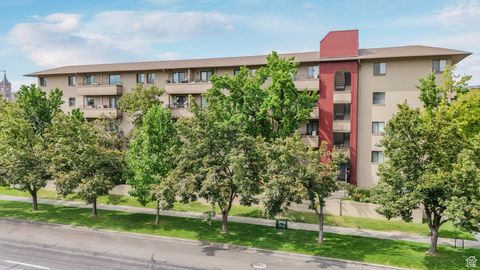
339 E 600 S, Salt Lake City, UT 84111
$-727
Cash flow
-10.4%
Cash-on-Cash Return
3.3%
Cap rate
0.6%
Rent to Value Ratio
Active
$249,900
3
bds
|
2
ba
|
1,840
sqft
|
built
1908
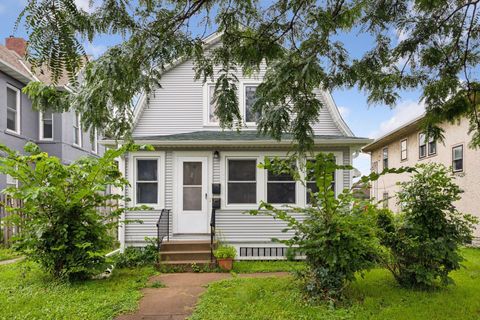
2924 Emerson Ave N, Minneapolis, MN 55411
$-237
Cash flow
-4.9%
Cash-on-Cash Return
4.5%
Cap rate
0.7%
Rent to Value Ratio

Active
$249,999
3
bds
|
2
ba
|
1,218
sqft
|
built
1979
4912 Bayside Ct, Stone Mountain, GA 30088
$-580
Cash flow
-12.1%
Cash-on-Cash Return
3.4%
Cap rate
0.6%
Rent to Value Ratio

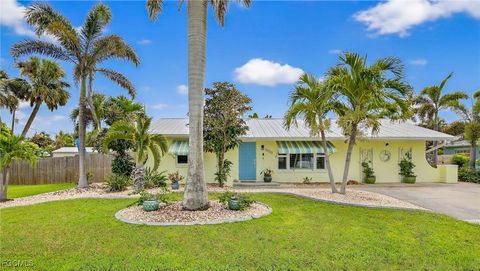
Active
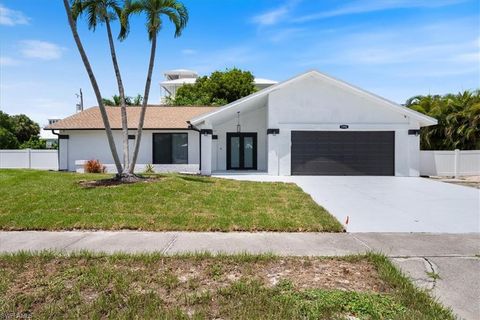
$319,900
3
bds
|
2
ba
|
1,309
sqft
|
built
1984
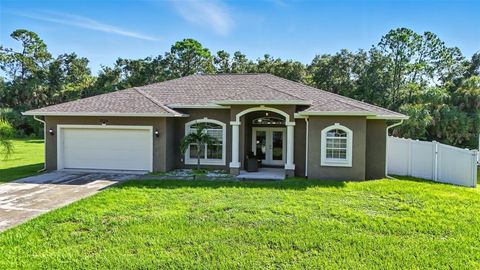
3516 SW Santa Barbara Pl, Cape Coral, FL 33914
$-362
Cash flow
-5.9%
Cash-on-Cash Return
4.8%
Cap rate
0.8%
Rent to Value Ratio
Active
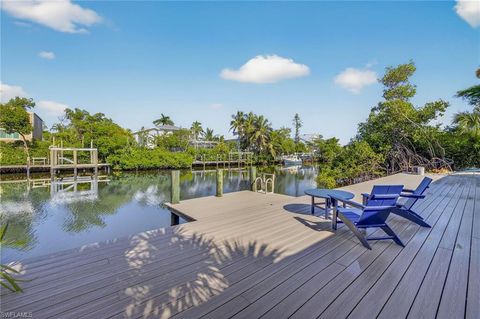
$720,000
3
bds
|
2
ba
|
1,448
sqft
|
built
1985
1996 Sheffield Ave, Marco Island, FL 34145
$-1,499
Cash flow
-10.9%
Cash-on-Cash Return
3.6%
Cap rate
0.5%
Rent to Value Ratio
Active
$1,100,000
3
bds
|
2
ba
|
1,415
sqft
|
built
1978
1739 Jewel Box Dr, Sanibel, FL 33957
$-3,578
Cash flow
-17.0%
Cash-on-Cash Return
2.2%
Cap rate
0.4%
Rent to Value Ratio
Active
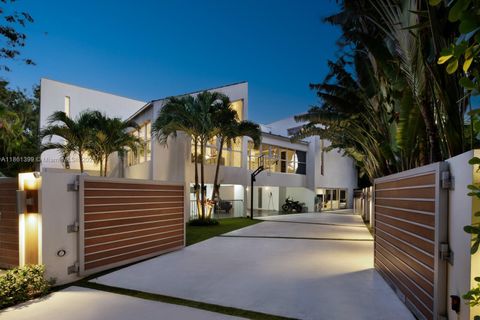
$5,390,000
5
bds
|
6
ba
|
5,212
sqft
|
built
1971
144 N Prospect Dr, Coral Gables, FL 33133
$-25,337
Cash flow
-24.5%
Cash-on-Cash Return
0.5%
Cap rate
0.2%
Rent to Value Ratio
Active
$380,000
4
bds
|
3
ba
|
3,000
sqft
|
built
2008
4380 SW 62nd Loop, Ocala, FL 34474
$-589
Cash flow
-8.1%
Cash-on-Cash Return
4.3%
Cap rate
0.7%
Rent to Value Ratio
Active
$785,000
3
bds
|
3
ba
|
1,870
sqft
|
built
1989
463 Coral Cove Dr, Juno Beach, FL 33408
$-2,710
Cash flow
-18.0%
Cash-on-Cash Return
2.0%
Cap rate
0.6%
Rent to Value Ratio
Active
$475,000
2
bds
|
2
ba
|
976
sqft
|
built
1996
3607 E Bay Dr, Holmes Beach, FL 34217
$-2,027
Cash flow
-22.3%
Cash-on-Cash Return
1.0%
Cap rate
0.6%
Rent to Value Ratio
Active
$229,000
3
bds
|
1
ba
|
0
sqft
|
built
1919
9326 S Manistee Ave, Chicago, IL 60617
$176
Cash flow
4.0%
Cash-on-Cash Return
6.6%
Cap rate
0.9%
Rent to Value Ratio
Active
$489,000
4
bds
|
3
ba
|
2,267
sqft
|
built
2005
254 S Cranberry St, Bolingbrook, IL 60490
$-1,350
Cash flow
-14.4%
Cash-on-Cash Return
2.4%
Cap rate
0.7%
Rent to Value Ratio

Active
$419,900
4
bds
|
3
ba
|
0
sqft
|
built
1919
4633 Wolf Rd, Western Springs, IL 60558
$-384
Cash flow
-4.8%
Cash-on-Cash Return
4.6%
Cap rate
0.8%
Rent to Value Ratio
Active
$317,900
3
bds
|
1
ba
|
1,115
sqft
|
built
1953
12127 S Nagle Ave, Palos Heights, IL 60463
$-284
Cash flow
-4.7%
Cash-on-Cash Return
4.6%
Cap rate
0.8%
Rent to Value Ratio
Active
$298,700
3
bds
|
2
ba
|
1,658
sqft
|
built
1974
3020 Palm Dr, Punta Gorda, FL 33950
$-274
Cash flow
-4.8%
Cash-on-Cash Return
5.0%
Cap rate
0.8%
Rent to Value Ratio
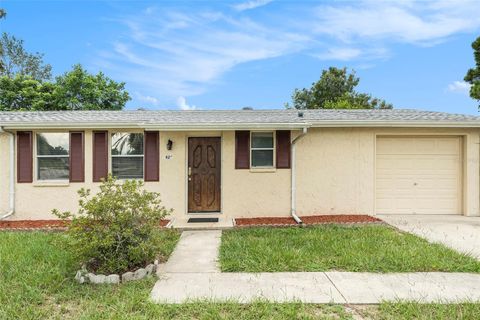
Active
$210,000
2
bds
|
2
ba
|
924
sqft
|
built
1975
9420 Midway St, Spring Hill, FL 34608
$-167
Cash flow
-4.1%
Cash-on-Cash Return
5.2%
Cap rate
0.8%
Rent to Value Ratio
Active
$309,000
1
bds
|
1
ba
|
1,200
sqft
|
built
1995
460 S Northwest Hwy, Park Ridge, IL 60068
$-469
Cash flow
-7.9%
Cash-on-Cash Return
3.9%
Cap rate
0.7%
Rent to Value Ratio
Active
$514,900
4
bds
|
3
ba
|
2,024
sqft
|
built
1928
1910 N 76th Ct, Elmwood Park, IL 60707
$-914
Cash flow
-9.3%
Cash-on-Cash Return
3.5%
Cap rate
0.7%
Rent to Value Ratio
Active
$249,000
3
bds
|
2
ba
|
1,736
sqft
|
built
1930
339 E Central Ave, Lake Wales, FL 33853
$-110
Cash flow
-2.3%
Cash-on-Cash Return
5.6%
Cap rate
0.8%
Rent to Value Ratio
Active
$479,900
2
bds
|
1
ba
|
1,396
sqft
|
built
1960
3311 N 66th Ave, Hollywood, FL 33024
$-506
Cash flow
-5.5%
Cash-on-Cash Return
4.9%
Cap rate
0.6%
Rent to Value Ratio
Active
$395,000
3
bds
|
2
ba
|
1,724
sqft
|
built
2002
2734 Ashland Ln, North Port, FL 34286
$-550
Cash flow
-7.3%
Cash-on-Cash Return
4.5%
Cap rate
0.7%
Rent to Value Ratio

Active
$369,000
1
bds
|
1
ba
|
790
sqft
|
built
2005
100 N Federal Hwy, Fort Lauderdale, FL 33301
$-1,355
Cash flow
-19.2%
Cash-on-Cash Return
1.7%
Cap rate
0.8%
Rent to Value Ratio

Active
$245,000
3
bds
|
2
ba
|
1,232
sqft
|
built
1949
1146 Old Covington Hwy SE, Conyers, GA 30012
$-318
Cash flow
-6.8%
Cash-on-Cash Return
4.6%
Cap rate
0.7%
Rent to Value Ratio
Active
$899,000
4
bds
|
5.5
ba
|
5,723
sqft
|
built
2000
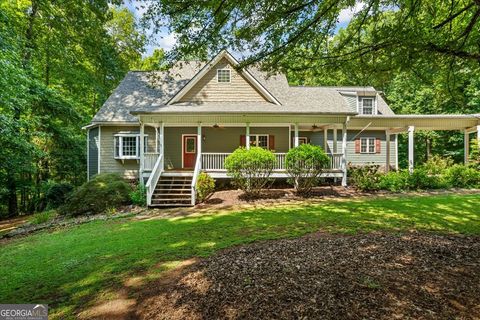
116 Woolsey Creek Trl, Fayetteville, GA 30215
$-1,801
Cash flow
-10.5%
Cash-on-Cash Return
3.7%
Cap rate
0.6%
Rent to Value Ratio
Active
$339,900
5
bds
|
3
ba
|
2,034
sqft
|
built
1987
2958 Cordite Loop, Snellville, GA 30039
$-450
Cash flow
-6.9%
Cash-on-Cash Return
4.6%
Cap rate
0.6%
Rent to Value Ratio
Active
$305,000
4
bds
|
2
ba
|
1,442
sqft
|
built
1985
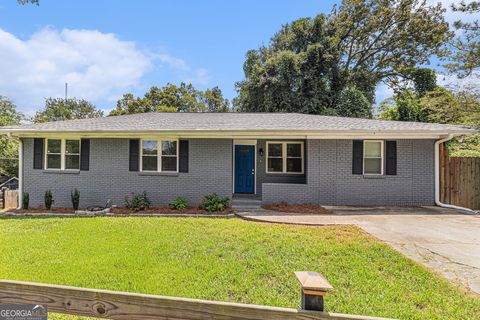
2222 Hill St NW, Atlanta, GA 30318
$71
Cash flow
1.2%
Cash-on-Cash Return
6.4%
Cap rate
0.8%
Rent to Value Ratio