United States Investment Properties for Sale
Browse homes for sale and investment properties in United States. Refine your search by price, property type, or more.
Best cash flowing properties in United States
Active
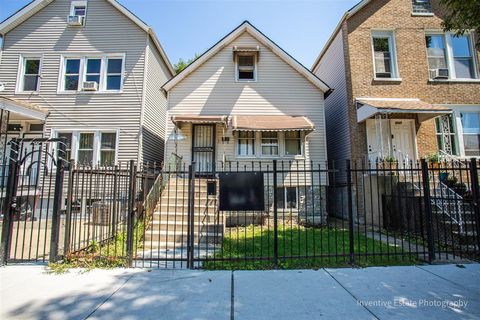
$100,000
2
bds
|
1
ba
|
630
sqft
|
built
1900
5045 S Winchester Ave, Chicago, IL 60609
$654
Cash flow
34.1%
Cash-on-Cash Return
13.5%
Cap rate
1.8%
Rent to Value Ratio
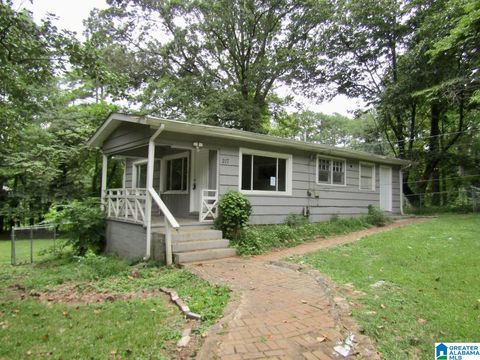
Active
$129,900
3
bds
|
2
ba
|
1,212
sqft
|
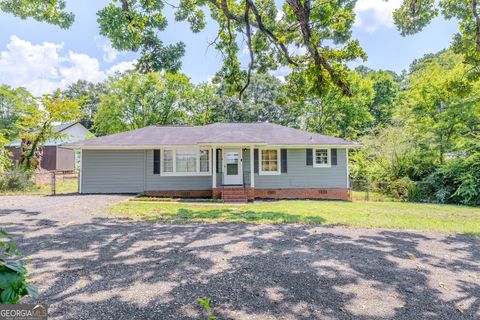
built
1955
217 Killough Dr, Birmingham, AL 35215
$282
Cash flow
11.3%
Cash-on-Cash Return
8.3%
Cap rate
1.0%
Rent to Value Ratio
10,000 out of 396,104 properties for sale in United States
Limited Results Shown
Create a free account, or log in to reveal all property listings and enjoy the complete experience.
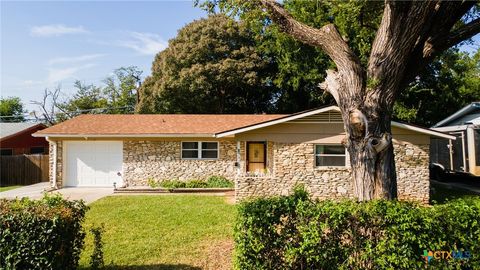
Active
$179,000
3
bds
|
2
ba
|
1,125
sqft
|
built
1965
1405 Camilla Rd, Killeen, TX 76549
$-113
Cash flow
-3.3%
Cash-on-Cash Return
4.9%
Cap rate
0.7%
Rent to Value Ratio
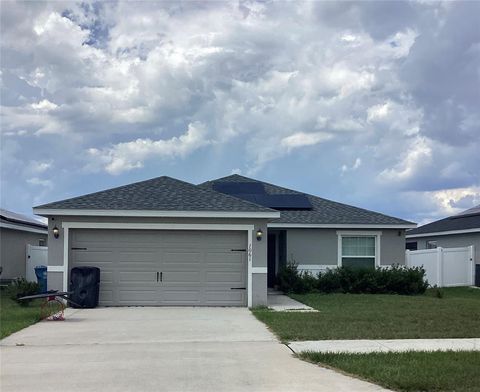
Active
$304,900
4
bds
|
2
ba
|
1,547
sqft
|
built
2020
1061 Zion Dr, Haines City, FL 33844
$-479
Cash flow
-8.2%
Cash-on-Cash Return
4.3%
Cap rate
0.7%
Rent to Value Ratio
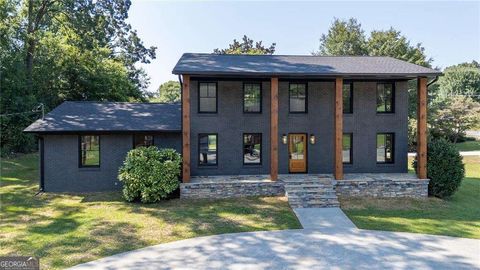
Active
$449,900
5
bds
|
3.5
ba
|
2,800
sqft
|
built
1966
309 Woodland Dr, Calhoun, GA 30701
$-1,142
Cash flow
-13.2%
Cash-on-Cash Return
3.1%
Cap rate
0.4%
Rent to Value Ratio
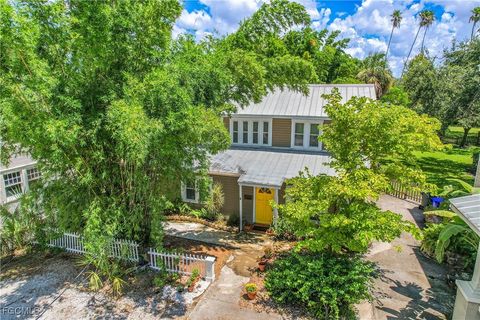
Active
$433,000
4
bds
|
3
ba
|
1,680
sqft
|
built
1924
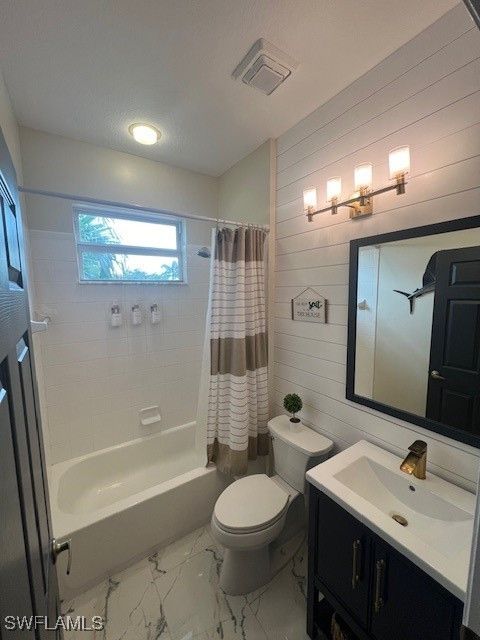
1637 Woodford Ave, Fort Myers, FL 33901
$-202
Cash flow
-2.4%
Cash-on-Cash Return
5.6%
Cap rate
0.8%
Rent to Value Ratio
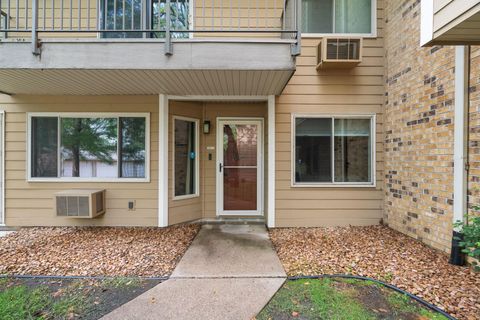
Active
$185,000
1
bds
|
1
ba
|
844
sqft
|
built
1981
2260 Ridge Dr, Saint Louis Park, MN 55416
$145
Cash flow
4.1%
Cash-on-Cash Return
6.6%
Cap rate
1.4%
Rent to Value Ratio
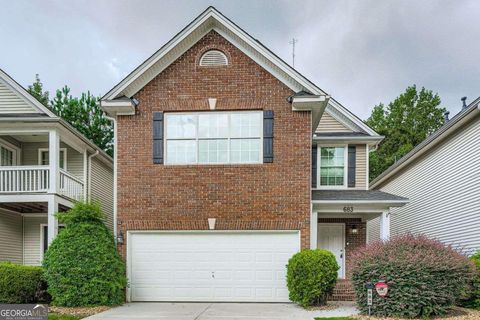
Active
$255,000
3
bds
|
2.5
ba
|
1,833
sqft
|
built
2004
683 Lakes Cir, Lithonia, GA 30058
$-293
Cash flow
-6.0%
Cash-on-Cash Return
4.8%
Cap rate
0.7%
Rent to Value Ratio
Active
$447,500
4
bds
|
3
ba
|
2,076
sqft
|
built
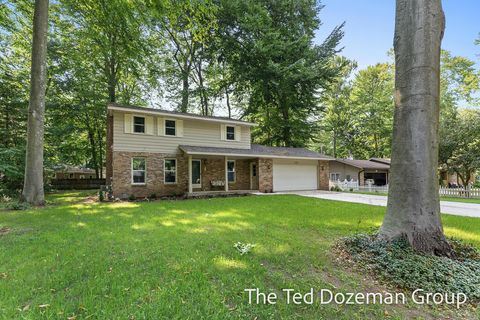
1972
338 Roosevelt Ave, Holland, MI 49424
$-1,498
Cash flow
-17.5%
Cash-on-Cash Return
2.1%
Cap rate
0.4%
Rent to Value Ratio
Active
$312,500
2
bds
|
3
ba
|
1,770
sqft
|
built
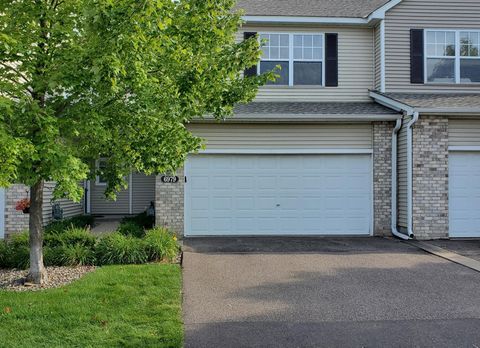
2001
6979 Weston Ln N, Maple Grove, MN 55311
$-483
Cash flow
-8.1%
Cash-on-Cash Return
3.8%
Cap rate
0.8%
Rent to Value Ratio
Active
$247,500
3
bds
|
2.5
ba
|
1,718
sqft
|
built
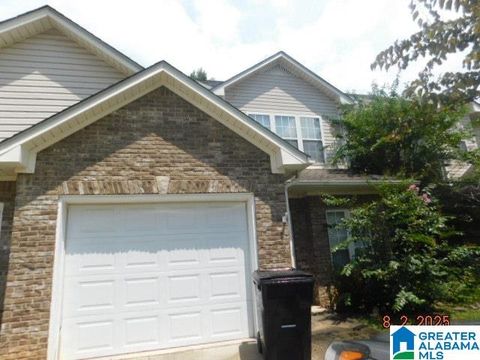
2000
4124 River Walk Ln, Vestavia Hills, AL 35216
$53
Cash flow
1.1%
Cash-on-Cash Return
5.9%
Cap rate
0.7%
Rent to Value Ratio
Active
$239,900
2
bds
|
2
ba
|
971
sqft
|
built
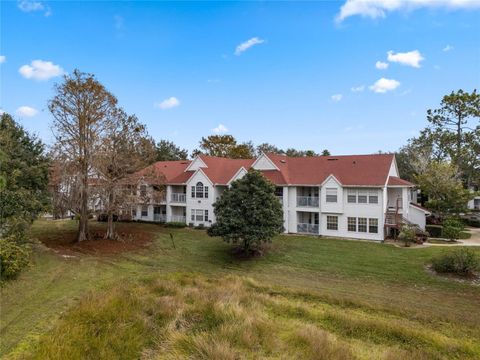
1989
11514 Westwood Blvd, Orlando, FL 32821
$-685
Cash flow
-14.9%
Cash-on-Cash Return
2.7%
Cap rate
0.8%
Rent to Value Ratio
Active
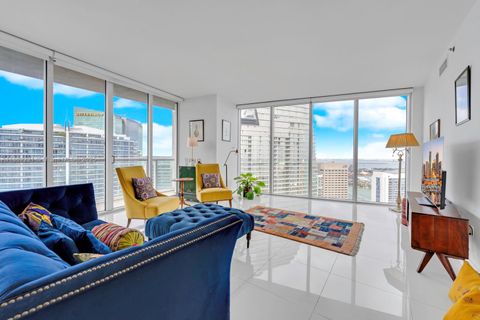
$1,175,000
2
bds
|
2
ba
|
1,269
sqft
|
built
2008
465 Brickell Ave, Miami, FL 33131
$-4,809
Cash flow
-21.4%
Cash-on-Cash Return
1.2%
Cap rate
0.6%
Rent to Value Ratio

Active
$409,000
2
bds
|
2
ba
|
875
sqft
|
built
2007
1690 SW 27th Ave, Miami, FL 33145
$-1,280
Cash flow
-16.3%
Cash-on-Cash Return
2.4%
Cap rate
0.6%
Rent to Value Ratio

Active
$629,000
3
bds
|
3
ba
|
1,540
sqft
|
built
2022
18700 SW 117th Ave, Miami, FL 33177
$-1,480
Cash flow
-12.3%
Cash-on-Cash Return
3.3%
Cap rate
0.6%
Rent to Value Ratio
Active
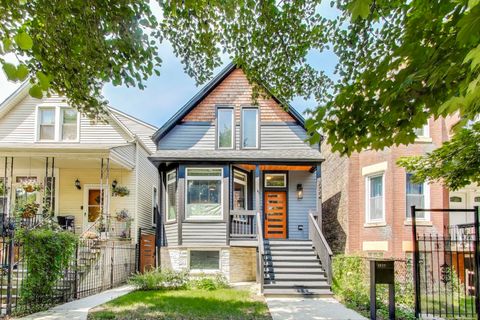
$899,000
3
bds
|
4
ba
|
3,000
sqft
|
built
1891
2922 N Sawyer Ave, Chicago, IL 60618
$-2,433
Cash flow
-14.1%
Cash-on-Cash Return
2.4%
Cap rate
0.4%
Rent to Value Ratio
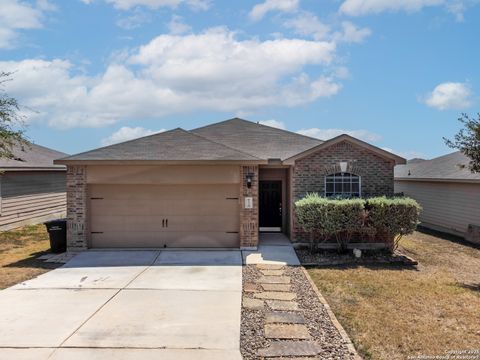
Active
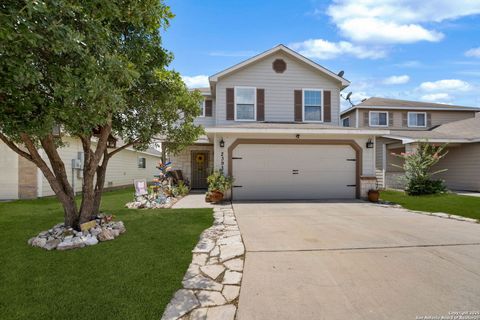
$200,000
3
bds
|
2
ba
|
1,556
sqft
|
built
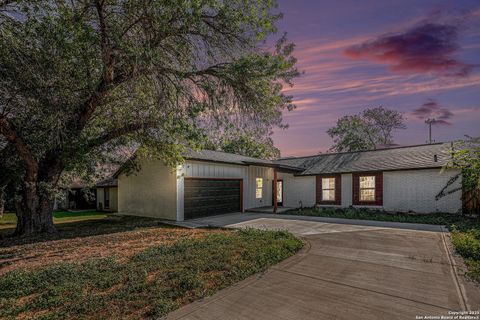
2014
6139 Still Mdw, San Antonio, TX 78222
$-286
Cash flow
-7.5%
Cash-on-Cash Return
4.0%
Cap rate
0.8%
Rent to Value Ratio

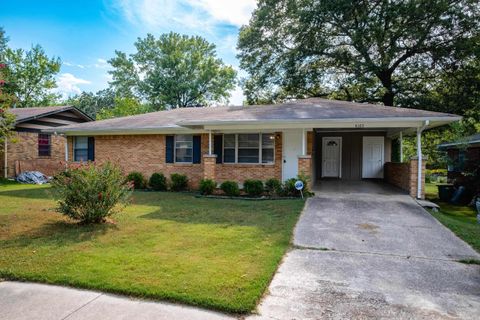
Active
$225,000
3
bds
|
1
ba
|
1,168
sqft
|
built
1948
218 Waugh St, San Antonio, TX 78223
$-239
Cash flow
-5.5%
Cash-on-Cash Return
4.4%
Cap rate
0.7%
Rent to Value Ratio
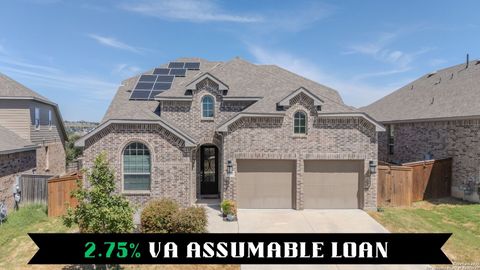
Active
$535,000
5
bds
|
4
ba
|
3,124
sqft
|
built
2020
1751 Doubleday Ln, San Antonio, TX 78253
$-1,035
Cash flow
-10.1%
Cash-on-Cash Return
3.4%
Cap rate
0.7%
Rent to Value Ratio
Active
$275,000
3
bds
|
2
ba
|
1,655
sqft
|
built
1973
12826 Esplanade St, San Antonio, TX 78233
$-524
Cash flow
-9.9%
Cash-on-Cash Return
3.4%
Cap rate
0.7%
Rent to Value Ratio
Active
$439,900
3
bds
|
3
ba
|
1,624
sqft
|
built
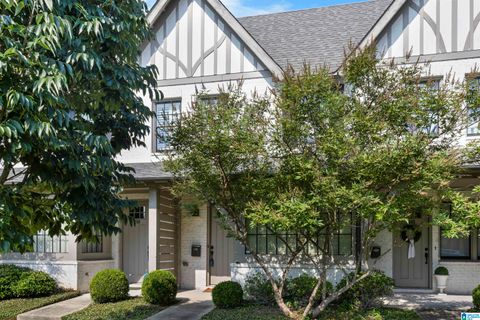
2017
1348 Calash Ave, Birmingham, AL 35213
$-400
Cash flow
-4.7%
Cash-on-Cash Return
4.6%
Cap rate
0.6%
Rent to Value Ratio
Active
$239,900
3
bds
|
1
ba
|
1,656
sqft
|
built
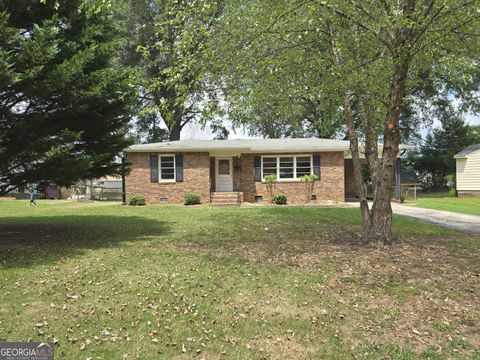
1953
1306 Calhoun Ave NE, Rome, GA 30161
$-331
Cash flow
-7.2%
Cash-on-Cash Return
4.5%
Cap rate
0.7%
Rent to Value Ratio
Active
$189,000
3
bds
|
1
ba
|
0
sqft
|
built
1955
4 Belmont Dr SW, Rome, GA 30165
$-136
Cash flow
-3.8%
Cash-on-Cash Return
5.3%
Cap rate
0.7%
Rent to Value Ratio
Active
$336,200
3
bds
|
3
ba
|
1,812
sqft
|
built
2008
23935 Wimberly Oaks, San Antonio, TX 78261
$-548
Cash flow
-8.5%
Cash-on-Cash Return
3.7%
Cap rate
0.7%
Rent to Value Ratio
Active
$150,000
3
bds
|
2
ba
|
1,353
sqft
|
built
1957
4107 Maple St, North Little Rock, AR 72118
$-53
Cash flow
-1.8%
Cash-on-Cash Return
5.3%
Cap rate
0.7%
Rent to Value Ratio
Active
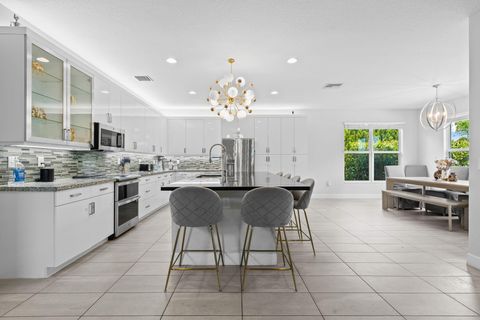
$289,900
2
bds
|
2
ba
|
948
sqft
|
built
1989
1165 Crystal Way, Delray Beach, FL 33444
$-902
Cash flow
-16.2%
Cash-on-Cash Return
2.4%
Cap rate
0.8%
Rent to Value Ratio
Active
$1,420,000
6
bds
|
5
ba
|
3,477
sqft
|
built
2022
7619 Francisca Club Ln, Delray Beach, FL 33446
$-4,645
Cash flow
-17.1%
Cash-on-Cash Return
2.2%
Cap rate
0.5%
Rent to Value Ratio
Active
$415,000
3
bds
|
3
ba
|
1,475
sqft
|
built
2009
1074 Allington Dr, North Salt Lake, UT 84054
$-950
Cash flow
-11.9%
Cash-on-Cash Return
2.9%
Cap rate
0.5%
Rent to Value Ratio
Active
$750,000
2
bds
|
2
ba
|
860
sqft
|
built
1905
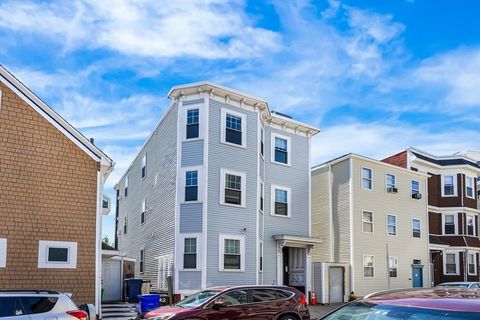
42 Vinton St, Boston, MA 02127
$-2,154
Cash flow
-15.0%
Cash-on-Cash Return
2.2%
Cap rate
0.5%
Rent to Value Ratio
Active
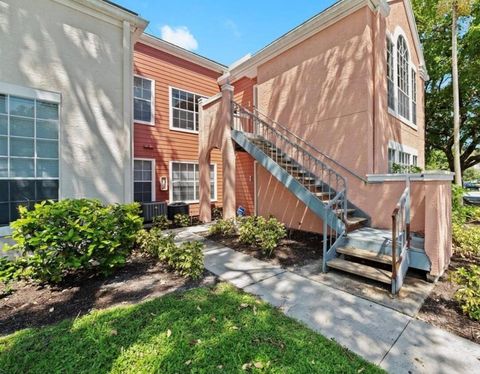
$238,000
2
bds
|
1
ba
|
900
sqft
|
built
1984
2761 S Oakland Forest Dr, Oakland Park, FL 33309
$-533
Cash flow
-11.7%
Cash-on-Cash Return
3.5%
Cap rate
0.8%
Rent to Value Ratio
Active
$2,350,000
5
bds
|
3
ba
|
3,793
sqft
|
built
1980
3311 La Costa Ave, Carlsbad, CA 92009
$-6,846
Cash flow
-15.2%
Cash-on-Cash Return
2.6%
Cap rate
0.3%
Rent to Value Ratio
Active
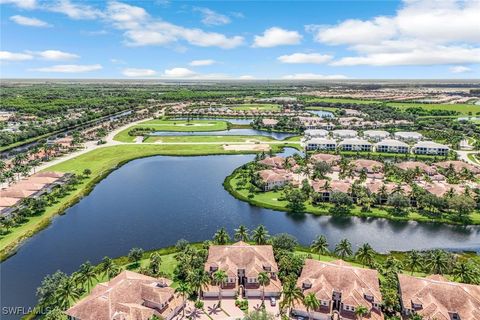
$335,000
2
bds
|
2
ba
|
1,402
sqft
|
built
2007
25110 Peacock Ln, Naples, FL 34114
$-440
Cash flow
-6.9%
Cash-on-Cash Return
4.6%
Cap rate
0.7%
Rent to Value Ratio
Active
$1,495,000
3
bds
|
3
ba
|
2,464
sqft
|
built
2021
570 96th Ave N, Naples, FL 34108
$-4,121
Cash flow
-14.4%
Cash-on-Cash Return
2.8%
Cap rate
0.4%
Rent to Value Ratio
Active
$649,900
3
bds
|
3
ba
|
2,408
sqft
|
built
2007
3164 Serena Ln, Naples, FL 34114
$-1,086
Cash flow
-8.7%
Cash-on-Cash Return
4.1%
Cap rate
0.7%
Rent to Value Ratio
Active
$409,000
3
bds
|
2
ba
|
1,452
sqft
|
built
1988
1897 SW Penrose Ave, Port Saint Lucie, FL 34953
$-1,475
Cash flow
-18.8%
Cash-on-Cash Return
1.8%
Cap rate
0.4%
Rent to Value Ratio
Active
$145,000
2
bds
|
2
ba
|
1,032
sqft
|
built
1968
1900 S Kanner Hwy, Stuart, FL 34994
$-172
Cash flow
-6.2%
Cash-on-Cash Return
4.7%
Cap rate
1.3%
Rent to Value Ratio
Active
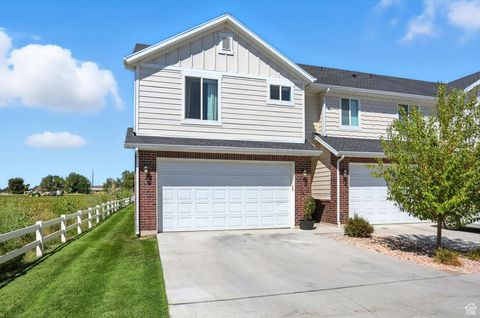
$379,900
3
bds
|
3
ba
|
1,544
sqft
|
built
2019
2695 S 2300 W, West Haven, UT 84401
$-758
Cash flow
-10.4%
Cash-on-Cash Return
3.3%
Cap rate
0.5%
Rent to Value Ratio
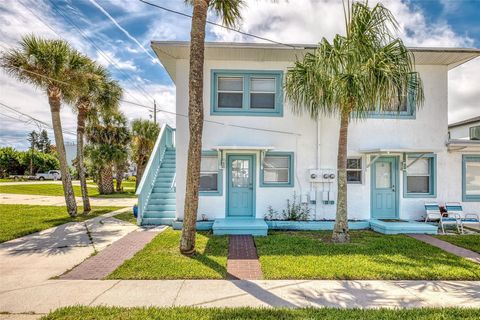
Active
$850,000
12
bds
|
9
ba
|
1,122
sqft
|
built
1945
6834 Turtlemound Rd, New Smyrna Beach, FL 32169
$-3,699
Cash flow
-22.7%
Cash-on-Cash Return
0.9%
Cap rate
0.2%
Rent to Value Ratio
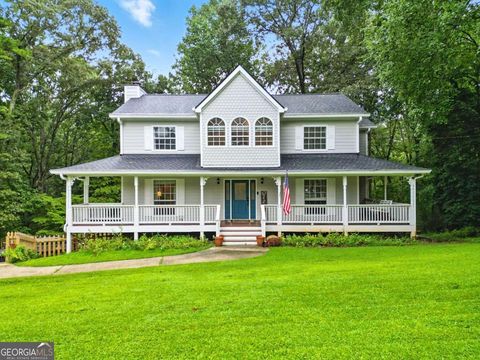
Active
$383,000
3
bds
|
2.5
ba
|
0
sqft
|
built
1988
7875 Sweetwater Dr, Douglasville, GA 30135
$-790
Cash flow
-10.8%
Cash-on-Cash Return
3.7%
Cap rate
0.6%
Rent to Value Ratio
Active
$329,900
3
bds
|
3
ba
|
2,040
sqft
|
built
1994
9353 E De Ave, Richland, MI 49083
$-512
Cash flow
-8.1%
Cash-on-Cash Return
4.3%
Cap rate
0.7%
Rent to Value Ratio