United States Investment Properties for Sale
Browse homes for sale and investment properties in United States. Refine your search by price, property type, or more.
Best cash flowing properties in United States

Active
$99,900
3
bds
|
1
ba
|
1,017
sqft
|
built
1957
14737 Kenwood Ave, Dolton, IL 60419
$503
Cash flow
26.3%
Cash-on-Cash Return
11.7%
Cap rate
2.3%
Rent to Value Ratio
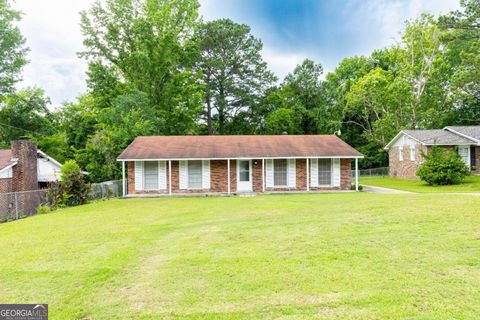
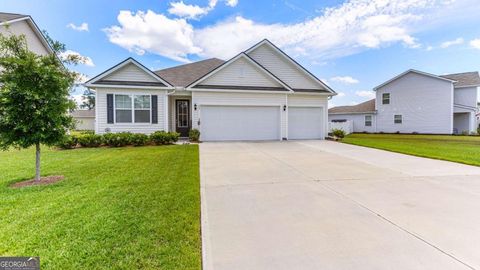
Active
$115,000
3
bds
|
0
ba
|
1,269
sqft
|
built
1966
433 Olsen Ave, Columbus, GA 31907
$124
Cash flow
5.6%
Cash-on-Cash Return
7.4%
Cap rate
1.0%
Rent to Value Ratio
10,000 out of 417,047 properties for sale in United States
Limited Results Shown
Create a free account, or log in to reveal all property listings and enjoy the complete experience.
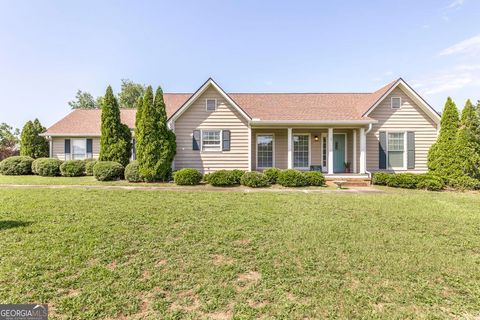
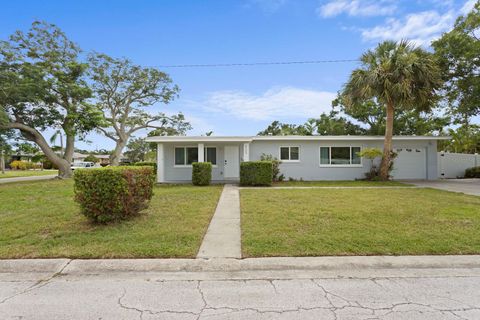
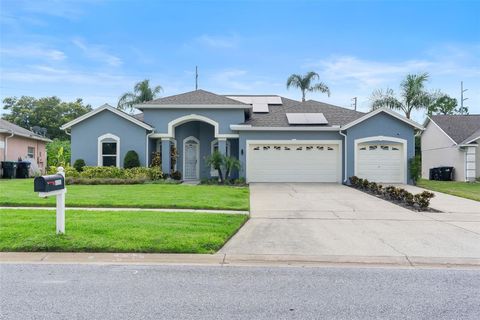
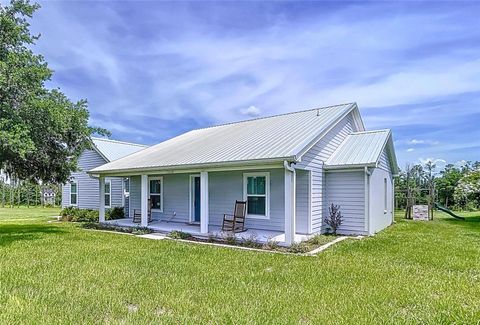
Active
$288,000
3
bds
|
0
ba
|
2,093
sqft
|
built
1991
218 Wexford Cir, Bonaire, GA 31005
$-414
Cash flow
-7.5%
Cash-on-Cash Return
4.5%
Cap rate
0.6%
Rent to Value Ratio
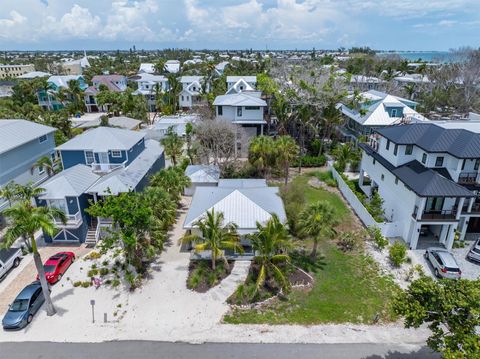
Active
$1,950,000
2
bds
|
1
ba
|
1,053
sqft
|
built
1949
109 Maple Ave, Anna Maria, FL 34216
$-9,786
Cash flow
-26.2%
Cash-on-Cash Return
0.2%
Cap rate
0.1%
Rent to Value Ratio
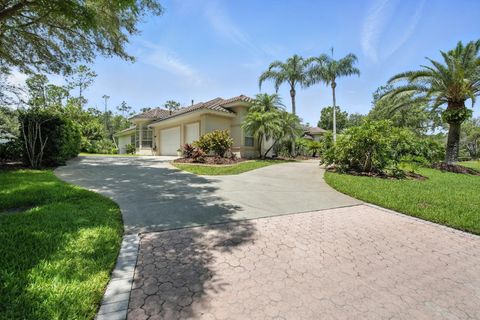
Active
$975,000
4
bds
|
3
ba
|
3,798
sqft
|
built
1996
19 Tomoka Cove Way, Ormond Beach, FL 32174
$-2,312
Cash flow
-12.4%
Cash-on-Cash Return
3.4%
Cap rate
0.5%
Rent to Value Ratio
Active
$245,000
3
bds
|
0
ba
|
1,828
sqft
|
built
2006
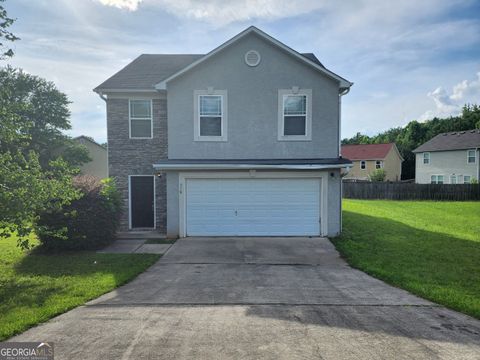
378 Durmire Dr, Jonesboro, GA 30236
$-279
Cash flow
-5.9%
Cash-on-Cash Return
4.8%
Cap rate
0.7%
Rent to Value Ratio
Active
$1,699,000
4
bds
|
4
ba
|
3,178
sqft
|
built
1979
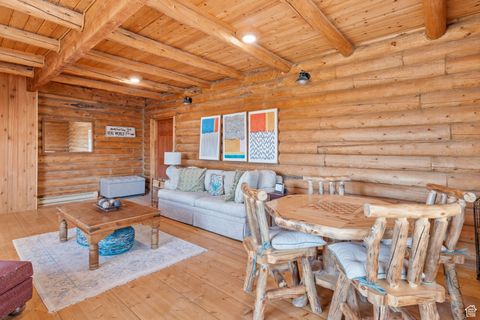
6385 Mountain View Dr, Park City, UT 84098
$-6,072
Cash flow
-18.6%
Cash-on-Cash Return
2.0%
Cap rate
0.3%
Rent to Value Ratio
Active
$345,000
3
bds
|
3
ba
|
0
sqft
|
built
1985
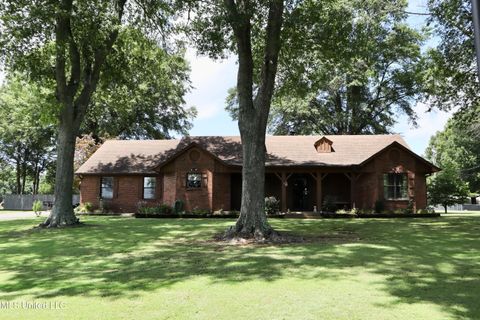
2440 Church Rd E, Southaven, MS 38671
$-242
Cash flow
-3.7%
Cash-on-Cash Return
4.8%
Cap rate
0.7%
Rent to Value Ratio
Active
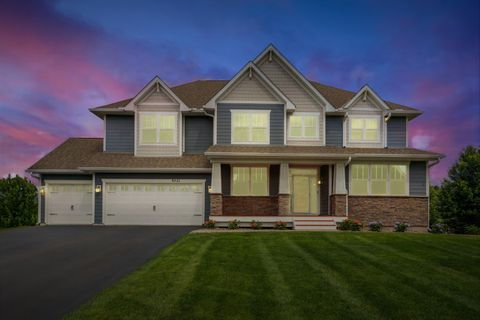
$1,770,000
5
bds
|
6
ba
|
5,054
sqft
|
built
2014
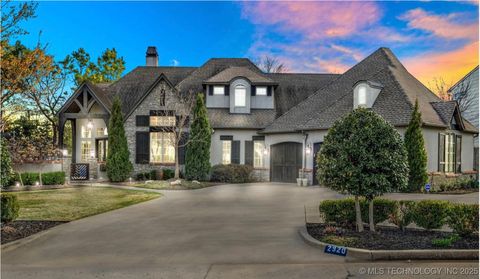
2920 E 27th Pl, Tulsa, OK 74114
$-6,068
Cash flow
-17.9%
Cash-on-Cash Return
1.6%
Cap rate
0.3%
Rent to Value Ratio
Active
$435,000
3
bds
|
3
ba
|
2,414
sqft
|
built
2019
361 Nicklaus Dr, Slidell, LA 70458
$-383
Cash flow
-4.6%
Cash-on-Cash Return
5.2%
Cap rate
0.6%
Rent to Value Ratio
Active
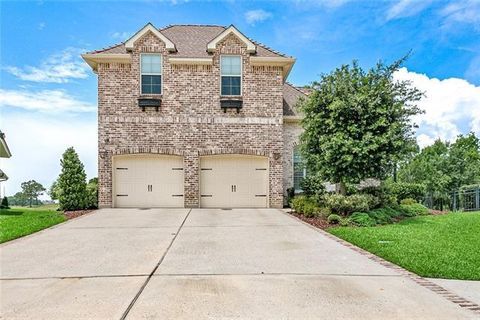
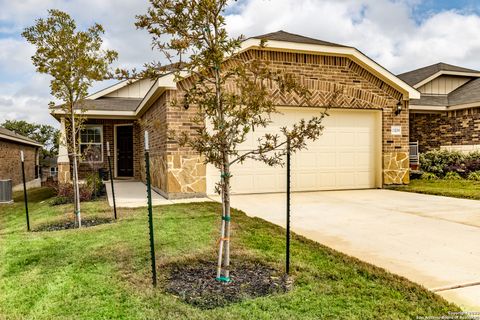
$409,900
3
bds
|
2
ba
|
1,946
sqft
|
built
2023
9215 Aggie Run, San Antonio, TX 78254
$-859
Cash flow
-10.9%
Cash-on-Cash Return
3.7%
Cap rate
0.7%
Rent to Value Ratio
Active
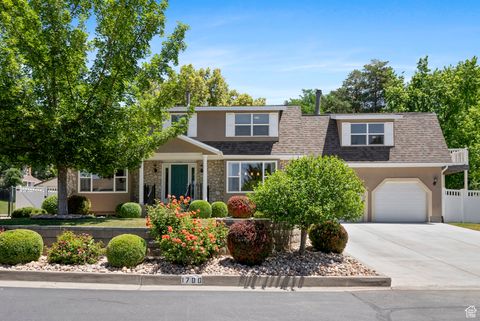
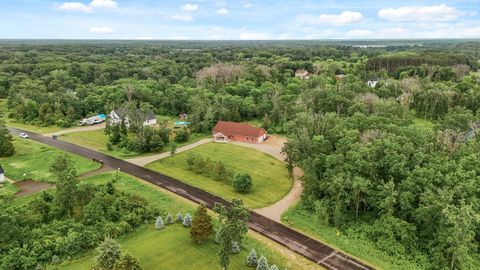
$850,000
7
bds
|
4
ba
|
4,127
sqft
|
built
1977
1700 Bluebird Rd, Orem, UT 84097
$-3,172
Cash flow
-19.5%
Cash-on-Cash Return
1.8%
Cap rate
0.3%
Rent to Value Ratio
Active
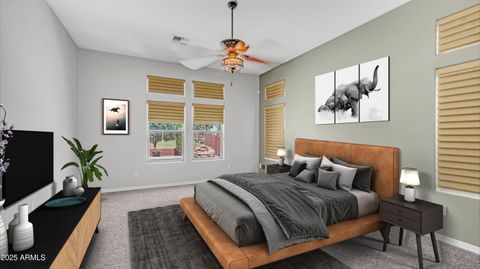
$525,000
3
bds
|
2
ba
|
2,483
sqft
|
built
2005
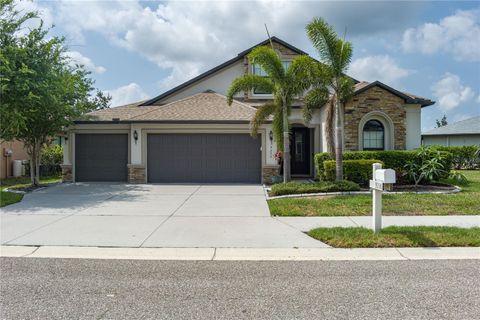
26135 N Desert Mesa Dr, Surprise, AZ 85387
$-940
Cash flow
-9.3%
Cash-on-Cash Return
3.5%
Cap rate
0.5%
Rent to Value Ratio
Active
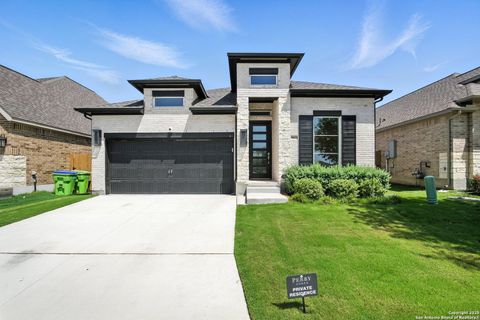
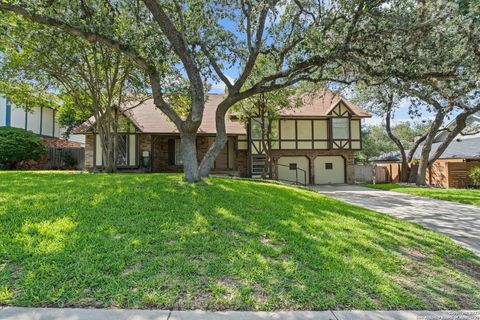
$399,900
4
bds
|
3
ba
|
2,221
sqft
|
built
1973
11627 Whisper Dew St, San Antonio, TX 78230
$-835
Cash flow
-10.9%
Cash-on-Cash Return
3.2%
Cap rate
0.7%
Rent to Value Ratio
Active
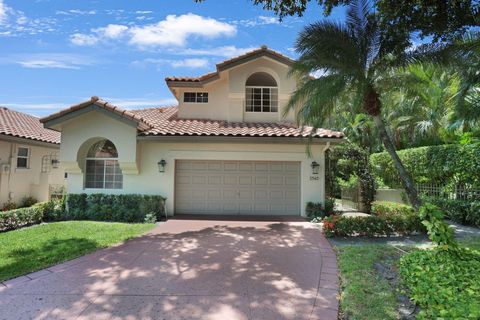
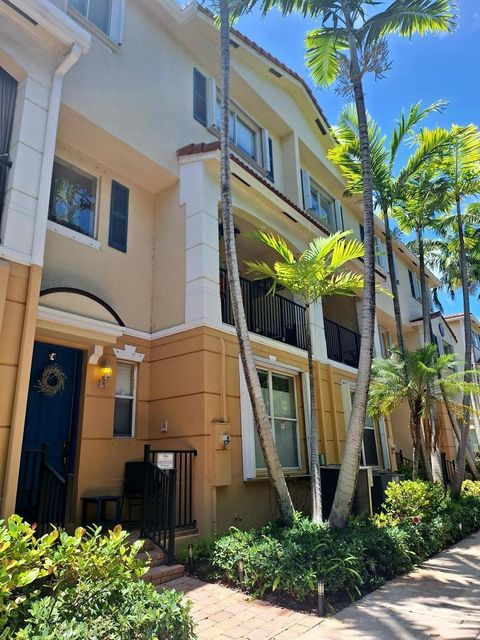
$800,000
3
bds
|
4
ba
|
2,367
sqft
|
built
1991
2543 NW 53rd St, Boca Raton, FL 33496
$-2,127
Cash flow
-13.9%
Cash-on-Cash Return
3.0%
Cap rate
0.6%
Rent to Value Ratio
Active
$324,000
2
bds
|
2
ba
|
1,500
sqft
|
built
2021
13119 Sulphur Trl, San Antonio, TX 78253
$-722
Cash flow
-11.6%
Cash-on-Cash Return
3.0%
Cap rate
0.7%
Rent to Value Ratio
Active
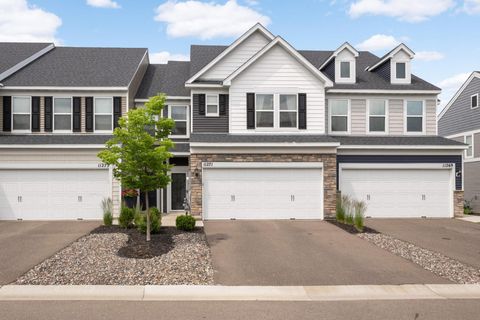
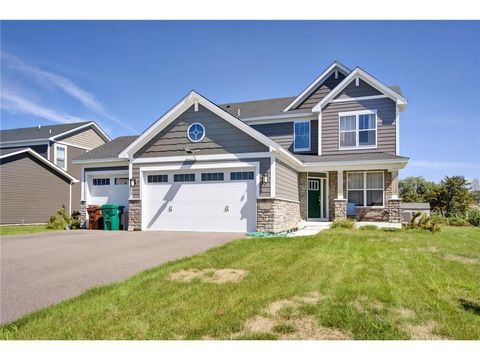
$385,000
3
bds
|
3
ba
|
1,941
sqft
|
built
2021
11271 Brookview Rd, Woodbury, MN 55129
$-196
Cash flow
-2.7%
Cash-on-Cash Return
5.1%
Cap rate
0.8%
Rent to Value Ratio
Active
$450,000
4
bds
|
2
ba
|
1,492
sqft
|
built
1964
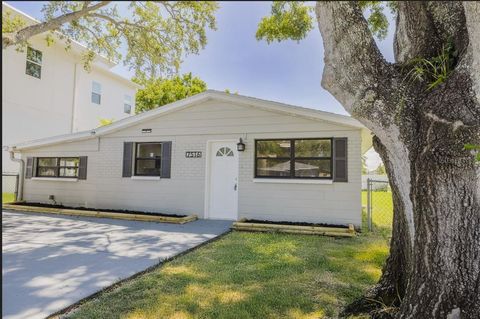
7516 S Obrien St, Tampa, FL 33616
$-719
Cash flow
-8.3%
Cash-on-Cash Return
4.2%
Cap rate
0.6%
Rent to Value Ratio
Active
$449,000
4
bds
|
2
ba
|
2,513
sqft
|
built
2015
9236 Raes Creek Pl, Palmetto, FL 34221
$-517
Cash flow
-6.0%
Cash-on-Cash Return
4.8%
Cap rate
0.7%
Rent to Value Ratio
Active
$599,900
2
bds
|
2
ba
|
960
sqft
|
built
1935
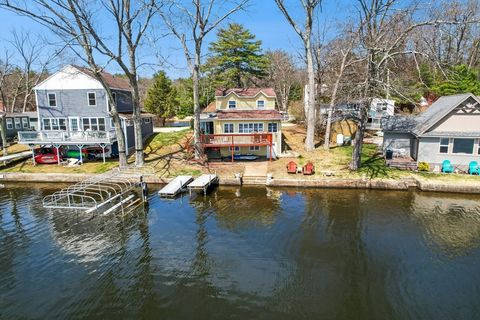
6 Cedar Pond Dr, Sturbridge, MA 01566
$-1,684
Cash flow
-14.6%
Cash-on-Cash Return
2.3%
Cap rate
0.4%
Rent to Value Ratio
Active
$520,000
1
bds
|
2
ba
|
1,030
sqft
|
built
1977
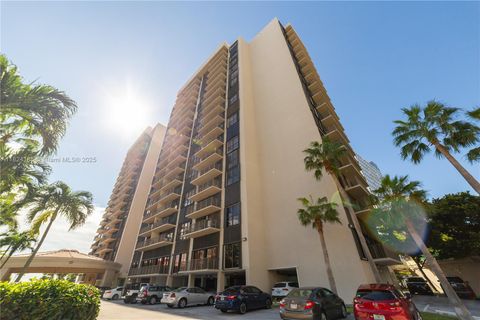
1450 Brickell Bay Dr, Miami, FL 33131
$-1,988
Cash flow
-19.9%
Cash-on-Cash Return
1.6%
Cap rate
0.7%
Rent to Value Ratio
Active
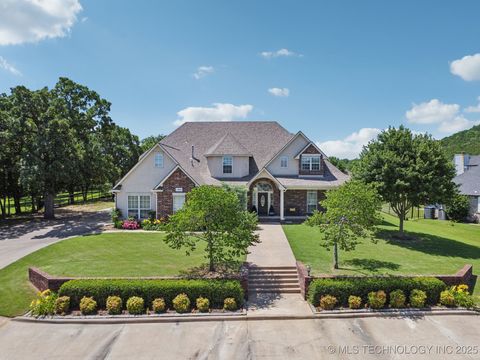
$370,000
4
bds
|
3
ba
|
2,349
sqft
|
built
1977
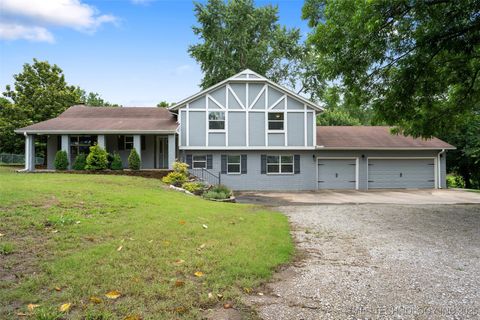
9802 E Clover Creek Dr, Claremore, OK 74017
$-612
Cash flow
-8.6%
Cash-on-Cash Return
3.7%
Cap rate
0.5%
Rent to Value Ratio
Active
$825,000
3
bds
|
3
ba
|
3,000
sqft
|
built
1985
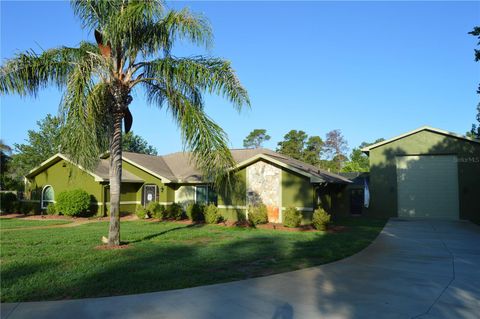
7550 Jomel Dr, Weeki Wachee, FL 34607
$-2,556
Cash flow
-16.2%
Cash-on-Cash Return
2.4%
Cap rate
0.4%
Rent to Value Ratio
Active
$310,000
2
bds
|
2
ba
|
1,048
sqft
|
built
1958
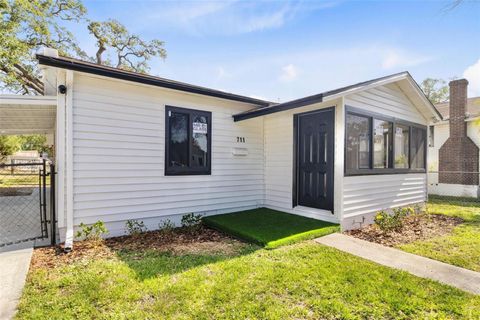
711 19th Ave S, Saint Petersburg, FL 33705
$-210
Cash flow
-3.5%
Cash-on-Cash Return
5.3%
Cap rate
0.6%
Rent to Value Ratio
Active
$380,000
3
bds
|
2
ba
|
1,327
sqft
|
built
2020
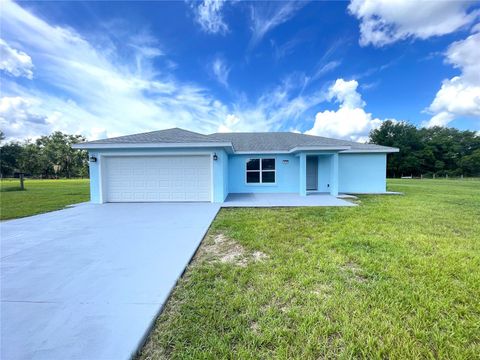
10758 SE Highway 464 C, Ocklawaha, FL 32179
$-1,053
Cash flow
-14.5%
Cash-on-Cash Return
2.8%
Cap rate
0.4%
Rent to Value Ratio

Active
$565,000
2
bds
|
2
ba
|
1,048
sqft
|
built
2007
1750 N Bayshore Dr, Miami, FL 33132
$-2,290
Cash flow
-21.1%
Cash-on-Cash Return
1.3%
Cap rate
0.6%
Rent to Value Ratio
Active
$469,999
3
bds
|
2
ba
|
1,400
sqft
|
built
1959
4300 Maple St NE, Saint Petersburg, FL 33703
$-1,272
Cash flow
-14.1%
Cash-on-Cash Return
2.9%
Cap rate
0.6%
Rent to Value Ratio
Active
$420,000
4
bds
|
3
ba
|
2,263
sqft
|
built
1993
4110 Maplegrove Dr, Orlando, FL 32818
$-809
Cash flow
-10.0%
Cash-on-Cash Return
3.8%
Cap rate
0.6%
Rent to Value Ratio
Active
$450,000
3
bds
|
3
ba
|
1,739
sqft
|
built
2004
3172 N Greenleaf Cir, Boynton Beach, FL 33426
$-861
Cash flow
-10.0%
Cash-on-Cash Return
3.9%
Cap rate
0.6%
Rent to Value Ratio
Active
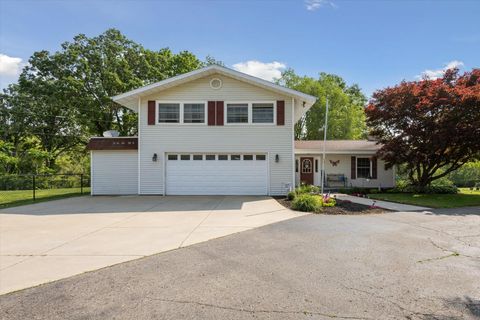
$354,900
4
bds
|
3
ba
|
2,250
sqft
|
built
1956
14747 A Dr N, Marshall, MI 49068
$-581
Cash flow
-8.5%
Cash-on-Cash Return
4.3%
Cap rate
0.6%
Rent to Value Ratio
Active
$1,045,000
5
bds
|
5
ba
|
4,313
sqft
|
built
2015
9721 Emerson Ct, Eden Prairie, MN 55347
$-2,887
Cash flow
-14.4%
Cash-on-Cash Return
2.4%
Cap rate
0.4%
Rent to Value Ratio

Active
$425,000
2
bds
|
2
ba
|
1,025
sqft
|
built
1995
4204 George Ln, West Palm Beach, FL 33406
$-772
Cash flow
-9.5%
Cash-on-Cash Return
4.1%
Cap rate
0.6%
Rent to Value Ratio
Active
$399,900
2
bds
|
2
ba
|
2,040
sqft
|
built
2018
18981 247th Ave NW, Big Lake, MN 55309
$-291
Cash flow
-3.8%
Cash-on-Cash Return
4.8%
Cap rate
0.7%
Rent to Value Ratio
Active
$659,000
5
bds
|
3
ba
|
3,712
sqft
|
built
2002
13614 W 42nd Pl S, Sand Springs, OK 74063
$-1,585
Cash flow
-12.5%
Cash-on-Cash Return
2.8%
Cap rate
0.4%
Rent to Value Ratio

Active
$625,000
4
bds
|
0
ba
|
3,844
sqft
|
built
1987
710 Larkspur Blvd NW, Acworth, GA 30102
$-1,761
Cash flow
-14.7%
Cash-on-Cash Return
2.9%
Cap rate
0.4%
Rent to Value Ratio
Active
$530,000
5
bds
|
4
ba
|
3,653
sqft
|
built
2021
14385 Annapolis Ln N, Dayton, MN 55327
$-534
Cash flow
-5.3%
Cash-on-Cash Return
4.5%
Cap rate
0.7%
Rent to Value Ratio
Active
$550,000
4
bds
|
2
ba
|
1,947
sqft
|
built
2023
1040 Timbers Dr, Fort Meade, FL 33841
$-1,714
Cash flow
-16.3%
Cash-on-Cash Return
2.4%
Cap rate
0.4%
Rent to Value Ratio
Active
$429,999
4
bds
|
0
ba
|
0
sqft
|
built
2022
33 Woodford Reserve Dr, Pooler, GA 31322
$-473
Cash flow
-5.7%
Cash-on-Cash Return
4.9%
Cap rate
0.7%
Rent to Value Ratio
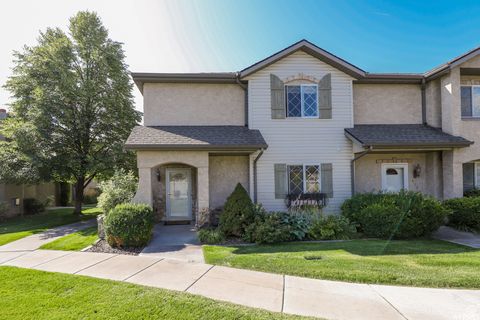
Active
$389,900
3
bds
|
3
ba
|
1,696
sqft
|
built
2001
435 Cobblestone, Providence, UT 84332
$-1,025
Cash flow
-13.7%
Cash-on-Cash Return
2.5%
Cap rate
0.5%
Rent to Value Ratio

Active
$224,999
3
bds
|
0
ba
|
1,584
sqft
|
built
2010
152 Back Cedar Ln, Warner Robins, GA 31093
$-101
Cash flow
-2.3%
Cash-on-Cash Return
5.7%
Cap rate
0.8%
Rent to Value Ratio