United States Investment Properties for Sale
Browse homes for sale and investment properties in United States. Refine your search by price, property type, or more.
Best cash flowing properties in United States
Active
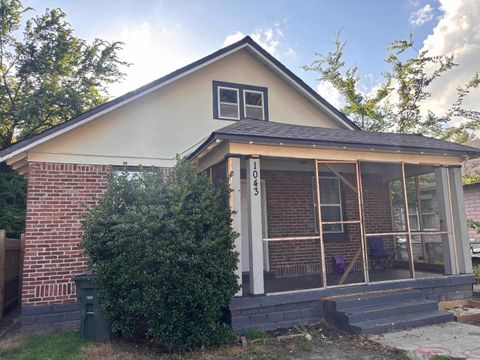
$65,000
2
bds
|
1
ba
|
0
sqft
|
built
1938
1043 Pearce St, Memphis, TN 38107
$590
Cash flow
10.6%
Cash-on-Cash Return
10.9%
Cap rate
1.4%
Rent to Value Ratio
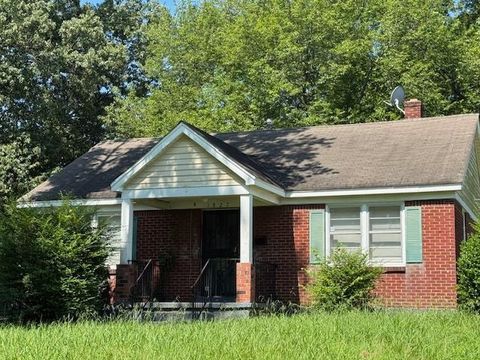
Active
$58,750
2
bds
|
1
ba
|
0
sqft
|
built
1948
1827 S Orleans St, Memphis, TN 38106
$572
Cash flow
11.3%
Cash-on-Cash Return
11.7%
Cap rate
1.5%
Rent to Value Ratio
10,000 out of 417,780 properties for sale in United States
Limited Results Shown
Create a free account, or log in to reveal all property listings and enjoy the complete experience.
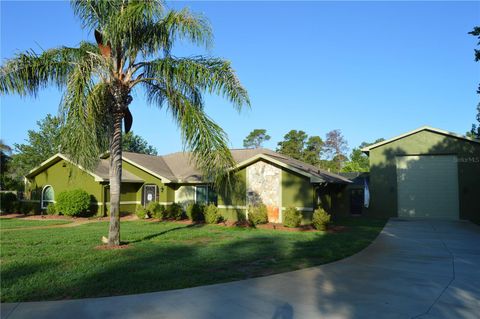
Active
$825,000
3
bds
|
3
ba
|
3,000
sqft
|
built
1985
7550 Jomel Dr, Weeki Wachee, FL 34607
$-2,556
Cash flow
-16.2%
Cash-on-Cash Return
2.4%
Cap rate
0.4%
Rent to Value Ratio
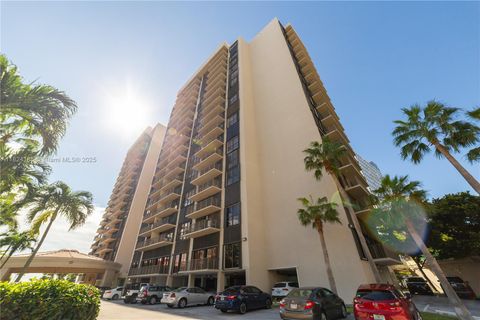
Active
$520,000
1
bds
|
2
ba
|
1,030
sqft
|
built
1977
1450 Brickell Bay Dr, Miami, FL 33131
$-1,988
Cash flow
-19.9%
Cash-on-Cash Return
1.6%
Cap rate
0.7%
Rent to Value Ratio
Active
$370,000
4
bds
|
3
ba
|
2,349
sqft
|
built
1977
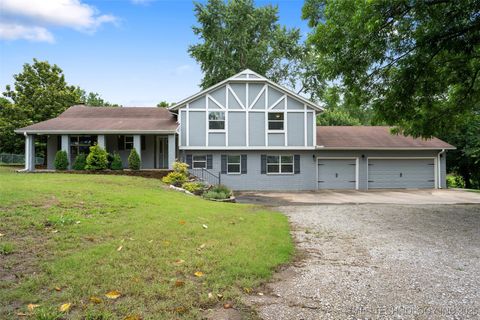
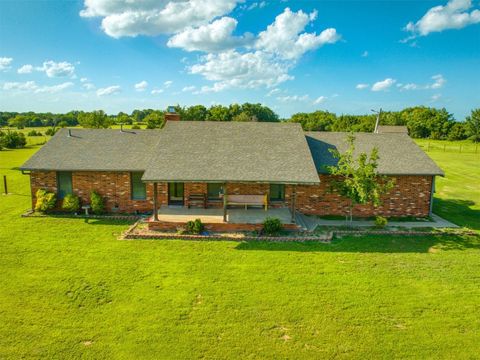
9802 E Clover Creek Dr, Claremore, OK 74017
$-612
Cash flow
-8.6%
Cash-on-Cash Return
3.7%
Cap rate
0.5%
Rent to Value Ratio

Active
$565,000
2
bds
|
2
ba
|
1,048
sqft
|
built
2007
1750 N Bayshore Dr, Miami, FL 33132
$-2,290
Cash flow
-21.1%
Cash-on-Cash Return
1.3%
Cap rate
0.6%
Rent to Value Ratio
Active
$660,000
6
bds
|
0
ba
|
5,605
sqft
|
built
2016
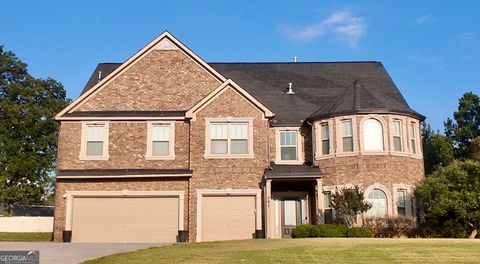
293 Ironwood Dr, Stockbridge, GA 30281
$-1,691
Cash flow
-13.4%
Cash-on-Cash Return
3.1%
Cap rate
0.5%
Rent to Value Ratio
Active
$524,000
4
bds
|
2
ba
|
1,443
sqft
|
built
1955
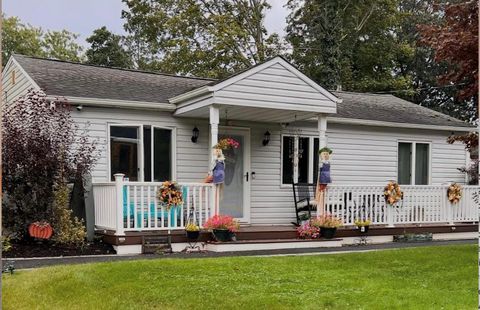
115 Dahlia Dr, Mastic Beach, NY 11951
$-954
Cash flow
-9.5%
Cash-on-Cash Return
3.9%
Cap rate
0.6%
Rent to Value Ratio
Active
$499,900
3
bds
|
2
ba
|
912
sqft
|
built
1983
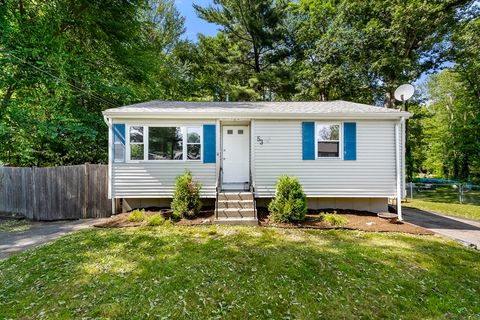
53 S Shore Rd, Holbrook, MA 02343
$-818
Cash flow
-8.5%
Cash-on-Cash Return
3.7%
Cap rate
0.6%
Rent to Value Ratio
Active
$314,900
3
bds
|
3
ba
|
0
sqft
|
built
1985
49408 River Rd, Earlsboro, OK 74840
$-516
Cash flow
-8.5%
Cash-on-Cash Return
3.7%
Cap rate
0.6%
Rent to Value Ratio
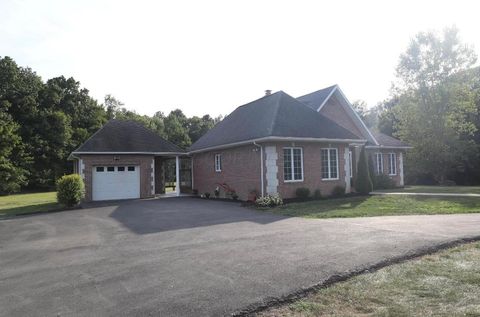
Active
$499,999
3
bds
|
2
ba
|
1,531
sqft
|
built
2004
3000 County Road 225, Marengo, OH 43334
$-703
Cash flow
-7.3%
Cash-on-Cash Return
4.0%
Cap rate
0.6%
Rent to Value Ratio
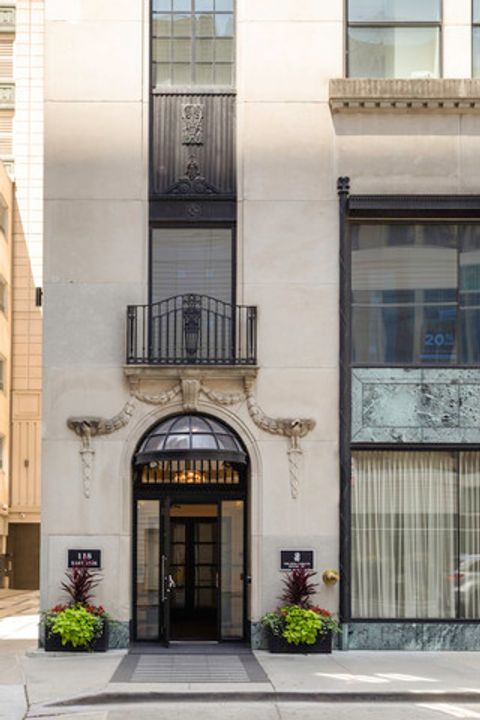
Active
$1,160,000
2
bds
|
3
ba
|
1,912
sqft
|
built
2012
118 E Erie St, Chicago, IL 60611
$-6,206
Cash flow
-27.9%
Cash-on-Cash Return
-0.7%
Cap rate
0.5%
Rent to Value Ratio
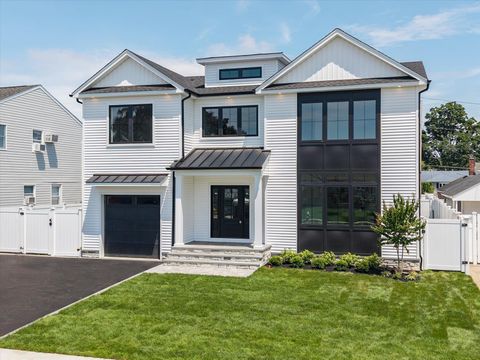
Active
$1,749,999
5
bds
|
4
ba
|
3,400
sqft
|
built
2025
724 Pleasant Ave, Westbury, NY 11590
$-7,595
Cash flow
-22.6%
Cash-on-Cash Return
0.9%
Cap rate
0.2%
Rent to Value Ratio
Active
$245,000
4
bds
|
2
ba
|
2,033
sqft
|
built
2006
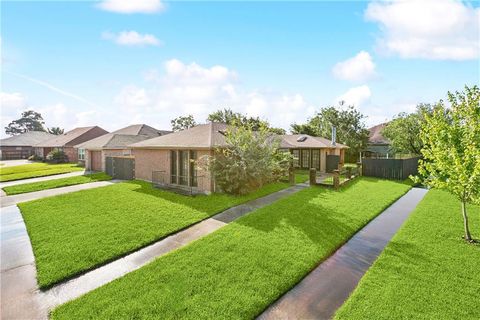
11100 N Idlewood Ct, New Orleans, LA 70128
$359
Cash flow
7.6%
Cash-on-Cash Return
7.4%
Cap rate
0.9%
Rent to Value Ratio
Active
$585,000
3
bds
|
2
ba
|
1,720
sqft
|
built
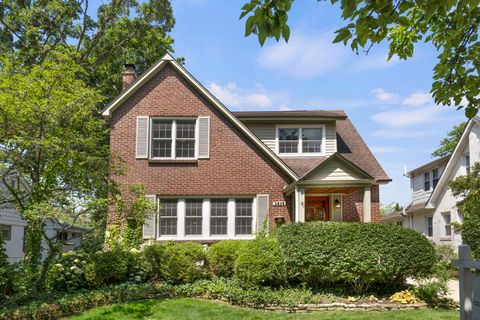
1933
3838 Johnson Ave, Western Springs, IL 60558
$-944
Cash flow
-8.4%
Cash-on-Cash Return
3.7%
Cap rate
0.7%
Rent to Value Ratio
Active
$1,350,000
4
bds
|
5
ba
|
4,980
sqft
|
built
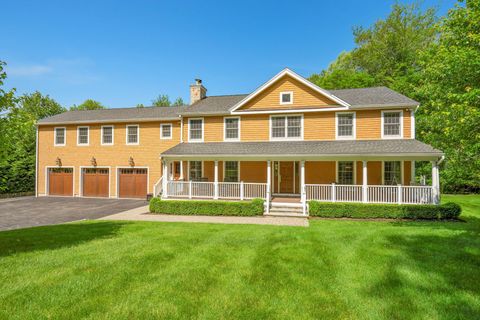
1993
420 Pleasantville Rd, Briarcliff Manor, NY 10510
$-4,293
Cash flow
-16.6%
Cash-on-Cash Return
2.3%
Cap rate
0.7%
Rent to Value Ratio
Active
$259,900
2
bds
|
1
ba
|
848
sqft
|
built
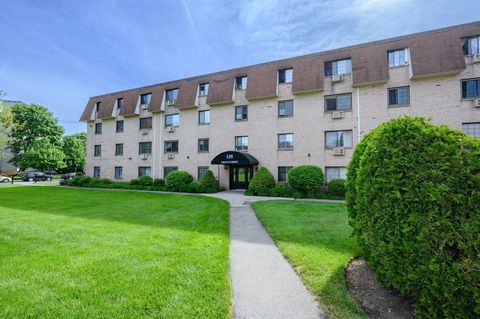
1972
135 Grove St, Rockland, MA 02370
$-678
Cash flow
-13.6%
Cash-on-Cash Return
2.5%
Cap rate
0.8%
Rent to Value Ratio
Active
$415,000
3
bds
|
3
ba
|
1,826
sqft
|
built
2015
10805 Alvara Way, Bonita Springs, FL 34135
$-714
Cash flow
-9.0%
Cash-on-Cash Return
4.1%
Cap rate
0.7%
Rent to Value Ratio
Active
$699,000
3
bds
|
2
ba
|
1,572
sqft
|
built
1991
241 Olde Homestead Dr, Marstons Mills, MA 02648
$-1,264
Cash flow
-9.4%
Cash-on-Cash Return
3.5%
Cap rate
0.5%
Rent to Value Ratio
Active
$648,800
4
bds
|
4
ba
|
2,630
sqft
|
built
1993
43 Tower Hill Rd, Brimfield, MA 01010
$-1,245
Cash flow
-10.0%
Cash-on-Cash Return
3.4%
Cap rate
0.6%
Rent to Value Ratio
Active
$550,000
4
bds
|
4
ba
|
3,088
sqft
|
built
1988
7435 W 157th St, Orland Park, IL 60462
$-890
Cash flow
-8.4%
Cash-on-Cash Return
3.7%
Cap rate
0.7%
Rent to Value Ratio

Active
$209,900
3
bds
|
2
ba
|
1,650
sqft
|
built
1901
565 Washburn Ave, Belgrade, MN 56312
$233
Cash flow
5.8%
Cash-on-Cash Return
7.0%
Cap rate
1.0%
Rent to Value Ratio
Active
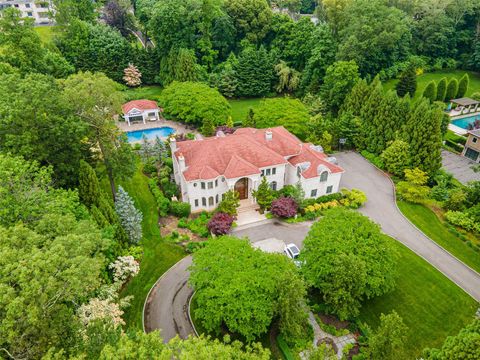
$5,280,000
8
bds
|
9
ba
|
7,900
sqft
|
built
2006
11 Black Rock Rd, Glen Head, NY 11545
$-27,189
Cash flow
-26.9%
Cash-on-Cash Return
-0.1%
Cap rate
0.1%
Rent to Value Ratio
Active
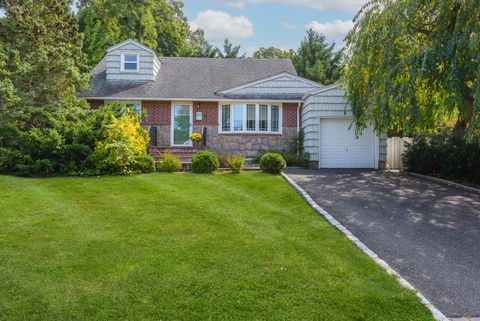
$650,000
5
bds
|
3
ba
|
2,345
sqft
|
built
1953
18 Longfellow Dr, Huntington Station, NY 11746
$-688
Cash flow
-5.5%
Cash-on-Cash Return
4.8%
Cap rate
0.8%
Rent to Value Ratio
Active
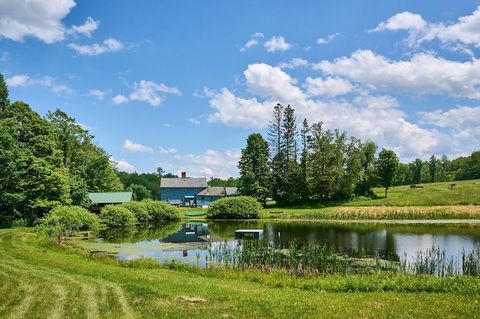
$945,000
4
bds
|
2
ba
|
2,838
sqft
|
built
1800
40 Whately Glen Rd, Conway, MA 01341
$-2,657
Cash flow
-14.7%
Cash-on-Cash Return
2.3%
Cap rate
0.4%
Rent to Value Ratio
Active
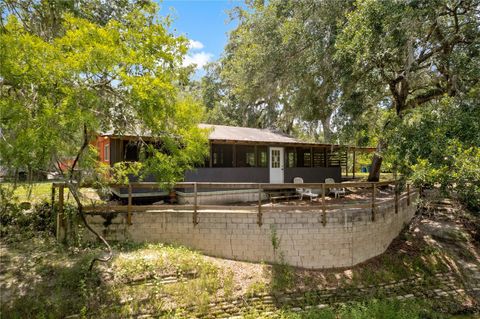
$250,000
2
bds
|
2
ba
|
960
sqft
|
built
1972
6410 Amelia Ln, Dade City, FL 33523
$-248
Cash flow
-5.2%
Cash-on-Cash Return
5.0%
Cap rate
0.6%
Rent to Value Ratio
Active
$949,000
4
bds
|
3
ba
|
0
sqft
|
built
1972
3 New Jersey Ct, Dix Hills, NY 11746
$-2,924
Cash flow
-16.1%
Cash-on-Cash Return
2.4%
Cap rate
0.5%
Rent to Value Ratio
Active
$225,000
3
bds
|
2
ba
|
1,280
sqft
|
built
1977
402 S Main St, New Bedford, IL 61346
$-503
Cash flow
-11.7%
Cash-on-Cash Return
3.0%
Cap rate
0.5%
Rent to Value Ratio
Active
$222,500
3
bds
|
0
ba
|
1,440
sqft
|
built
2000
162 Watercress Ct, Stockbridge, GA 30281
$-259
Cash flow
-6.1%
Cash-on-Cash Return
4.8%
Cap rate
0.8%
Rent to Value Ratio
Active
$274,000
3
bds
|
2
ba
|
0
sqft
|
built
2008
6836 Lagrange Grove Dr, Cordova, TN 38018
$-230
Cash flow
-4.4%
Cash-on-Cash Return
4.7%
Cap rate
0.7%
Rent to Value Ratio
Active
$79,900
3
bds
|
1
ba
|
0
sqft
|
built
1960
2158 Pueblo Ave, Memphis, TN 38127
$375
Cash flow
24.5%
Cash-on-Cash Return
11.3%
Cap rate
1.5%
Rent to Value Ratio
Active
$725,000
5
bds
|
4.5
ba
|
0
sqft
|
built
1992
4030 Windolyn Way, Bartlett, TN 38133
$-1,291
Cash flow
-9.3%
Cash-on-Cash Return
3.5%
Cap rate
0.6%
Rent to Value Ratio
Active
$309,000
3
bds
|
2
ba
|
0
sqft
|
built
1950
118 N Highland St, Memphis, TN 38111
$-358
Cash flow
-6.0%
Cash-on-Cash Return
4.3%
Cap rate
0.7%
Rent to Value Ratio
Active
$1,075,000
2
bds
|
3
ba
|
1,498
sqft
|
built
2019
851 NE 1st Ave, Miami, FL 33132
$-4,801
Cash flow
-23.3%
Cash-on-Cash Return
0.8%
Cap rate
0.7%
Rent to Value Ratio
Active
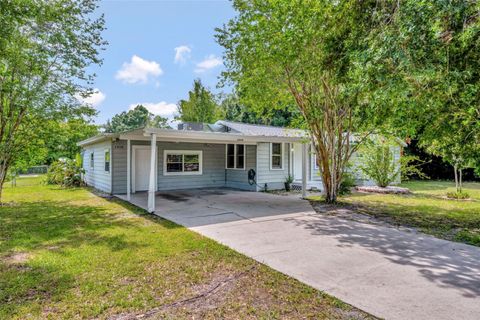
$380,000
3
bds
|
2
ba
|
1,513
sqft
|
built
1952
1310 Coletta Dr, Orlando, FL 32807
$-153
Cash flow
-2.1%
Cash-on-Cash Return
5.7%
Cap rate
0.7%
Rent to Value Ratio

Active
$700,000
2
bds
|
2
ba
|
1,060
sqft
|
built
1985
3200 N Ocean Dr, Hollywood, FL 33019
$-2,447
Cash flow
-18.2%
Cash-on-Cash Return
2.0%
Cap rate
0.5%
Rent to Value Ratio
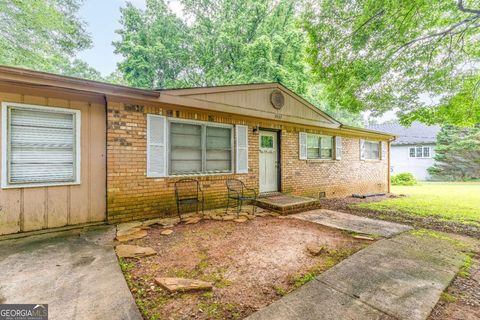
Active
$235,000
3
bds
|
1.5
ba
|
0
sqft
|
built
1970
3927 Buck Rd, Powder Springs, GA 30127
$-251
Cash flow
-5.6%
Cash-on-Cash Return
4.9%
Cap rate
0.8%
Rent to Value Ratio
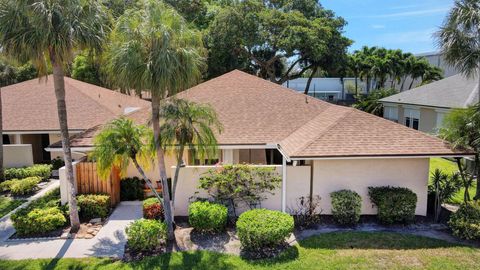
Active
$399,900
2
bds
|
2
ba
|
1,581
sqft
|
built
1981
23 S Lakeshore Dr, Hypoluxo, FL 33462
$-641
Cash flow
-8.4%
Cash-on-Cash Return
4.2%
Cap rate
0.7%
Rent to Value Ratio
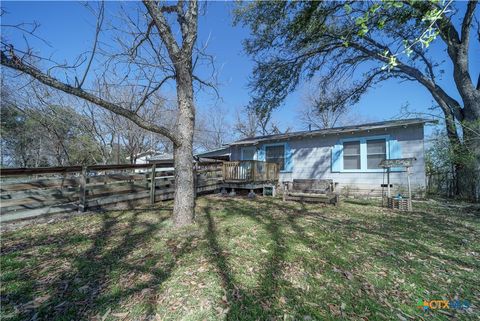
Active
$400,000
2
bds
|
1
ba
|
704
sqft
|
built
1952
2021 Chinaberry Ln, New Braunfels, TX 78130
$-1,668
Cash flow
-21.8%
Cash-on-Cash Return
0.7%
Cap rate
0.3%
Rent to Value Ratio
Active
$799,900
8
bds
|
3
ba
|
0
sqft
|
built
1922
4100 W George St, Chicago, IL 60641
$-2,817
Cash flow
-18.4%
Cash-on-Cash Return
1.5%
Cap rate
0.3%
Rent to Value Ratio