United States Investment Properties for Sale
Browse homes for sale and investment properties in United States. Refine your search by price, property type, or more.
Best cash flowing properties in United States
Active
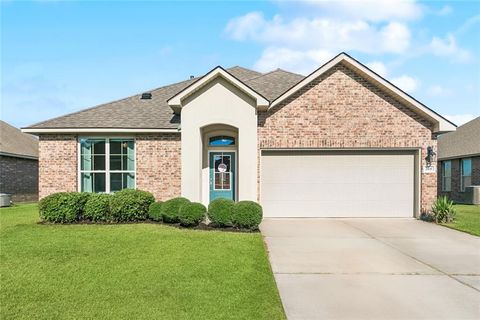
$240,000
4
bds
|
2
ba
|
1,561
sqft
|
built
2017
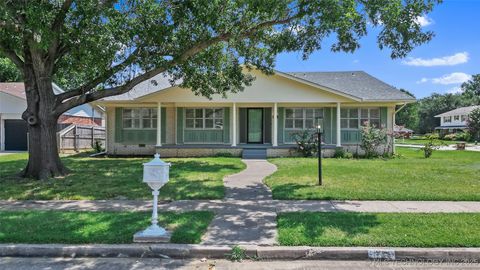
268 E Lake Dr, Slidell, LA 70461
$186
Cash flow
4.0%
Cash-on-Cash Return
6.6%
Cap rate
0.8%
Rent to Value Ratio
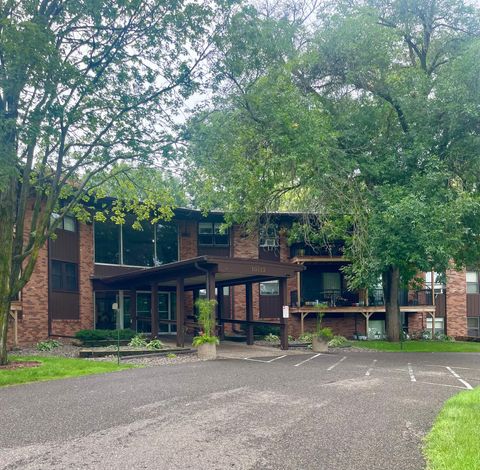
Active
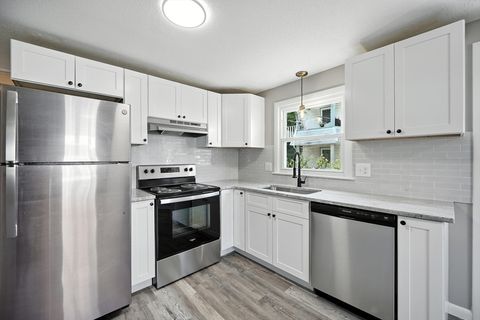
$289,413
3
bds
|
2
ba
|
960
sqft
|
built
1973
55 Governor St, Springfield, MA 01104
$-106
Cash flow
-1.9%
Cash-on-Cash Return
5.2%
Cap rate
0.8%
Rent to Value Ratio
10,000 out of 322,835 properties for sale in United States
Limited Results Shown
Create a free account, or log in to reveal all property listings and enjoy the complete experience.
Active
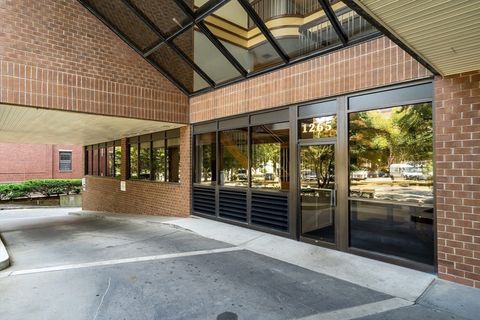
$1,349,000
2
bds
|
2
ba
|
1,382
sqft
|
built
1984
1265 Beacon St, Brookline, MA 02446
$-5,047
Cash flow
-19.5%
Cash-on-Cash Return
1.2%
Cap rate
0.4%
Rent to Value Ratio
Active
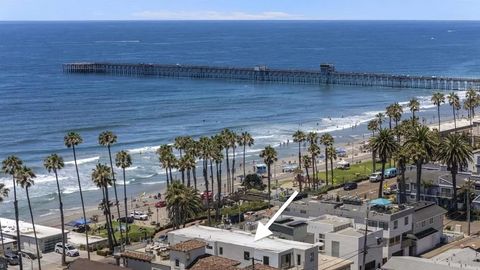
$6,490,000
9
bds
|
6
ba
|
0
sqft
|
built
1942
212 S Pacific St, Oceanside, CA 92054
$-30,609
Cash flow
-24.6%
Cash-on-Cash Return
0.4%
Cap rate
0.0%
Rent to Value Ratio
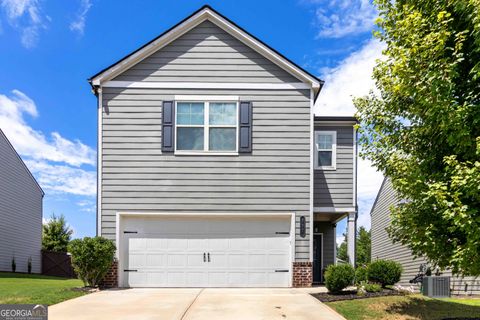
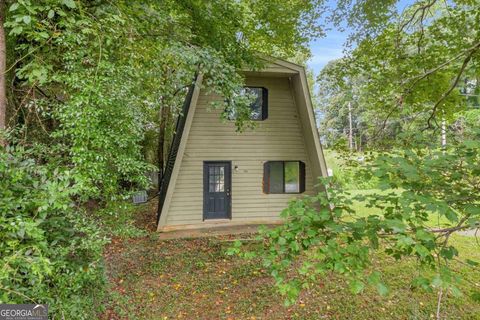
Active
$375,000
3
bds
|
2.5
ba
|
1,956
sqft
|
built
2020
307 Auburn Station Dr, Auburn, GA 30011
$-728
Cash flow
-10.1%
Cash-on-Cash Return
3.8%
Cap rate
0.6%
Rent to Value Ratio
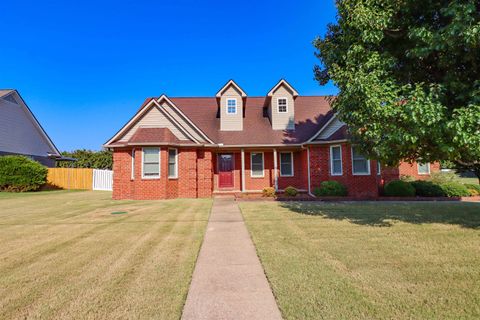
Active
$385,500
3
bds
|
2
ba
|
0
sqft
|
built
2004
371 Beverly Dr, Atoka, TN 38004
$-394
Cash flow
-5.3%
Cash-on-Cash Return
4.5%
Cap rate
0.6%
Rent to Value Ratio
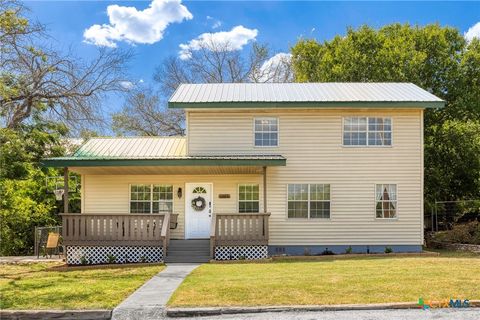
Active
$304,900
3
bds
|
2
ba
|
1,420
sqft
|
built
1996
11004 Elm St, Jonestown, TX 78645
$-665
Cash flow
-11.4%
Cash-on-Cash Return
3.1%
Cap rate
0.6%
Rent to Value Ratio

Active
$394,900
3
bds
|
1
ba
|
1,300
sqft
|
built
1988
18975 Flora St NW, Oak Grove, MN 55011
$-282
Cash flow
-3.7%
Cash-on-Cash Return
4.8%
Cap rate
0.6%
Rent to Value Ratio
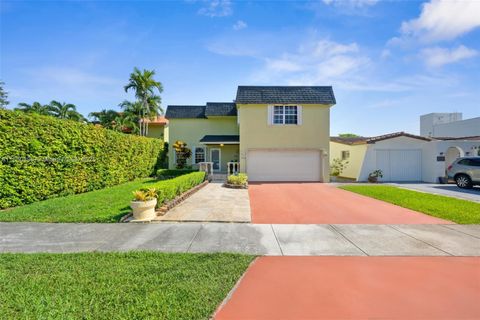
Active
$949,900
4
bds
|
4
ba
|
2,755
sqft
|
built
1976
9940 SW 23rd St, Miami, FL 33165
$-2,449
Cash flow
-13.5%
Cash-on-Cash Return
3.1%
Cap rate
0.4%
Rent to Value Ratio
Active
$9,500,000
bds
|
0
ba
|
4,437
sqft
|
built
1952
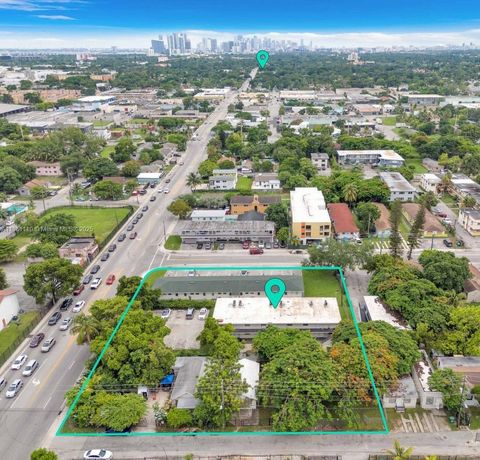
7700 N Miami Ave, Miami, FL 33150
$-49,061
Cash flow
-26.9%
Cash-on-Cash Return
-0.1%
Cap rate
0.0%
Rent to Value Ratio
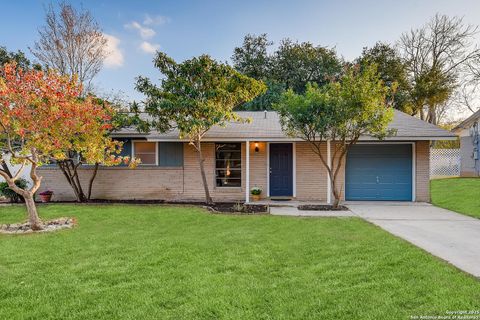
Active
$239,999
3
bds
|
2
ba
|
1,065
sqft
|
built
1961
918 Cerro Alto Dr, San Antonio, TX 78213
$-344
Cash flow
-7.5%
Cash-on-Cash Return
4.0%
Cap rate
0.7%
Rent to Value Ratio
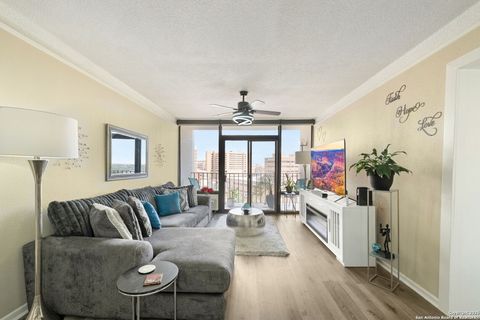
Active
$186,000
2
bds
|
2
ba
|
1,206
sqft
|
built
1982
7701 Wurzbach Rd, San Antonio, TX 78229
$-946
Cash flow
-26.5%
Cash-on-Cash Return
-0.4%
Cap rate
1.0%
Rent to Value Ratio
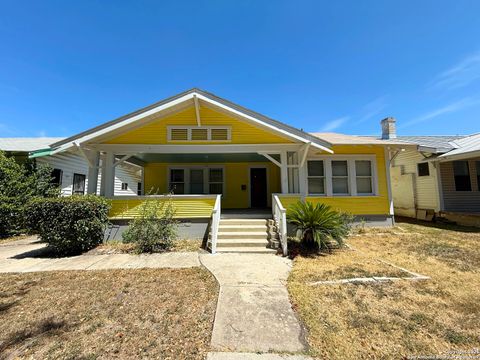
Active
$235,000
3
bds
|
1
ba
|
1,708
sqft
|
built
1940
555 Cincinnati Ave, San Antonio, TX 78201
$-442
Cash flow
-9.8%
Cash-on-Cash Return
3.4%
Cap rate
0.7%
Rent to Value Ratio
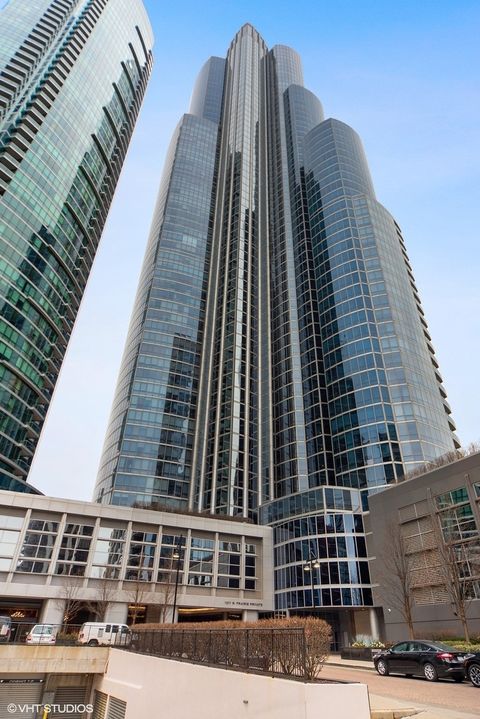
Active
$1,325,000
3
bds
|
3
ba
|
2,420
sqft
|
built
2007
1211 S Prairie Ave, Chicago, IL 60605
$-5,821
Cash flow
-22.9%
Cash-on-Cash Return
0.4%
Cap rate
0.5%
Rent to Value Ratio
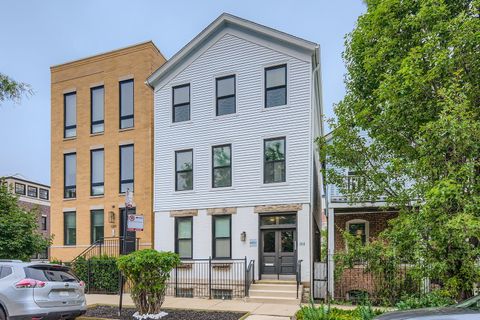
Active
$1,325,000
6
bds
|
6
ba
|
0
sqft
|
built
1884
1242 W Huron St, Chicago, IL 60642
$-4,595
Cash flow
-18.1%
Cash-on-Cash Return
1.5%
Cap rate
0.3%
Rent to Value Ratio
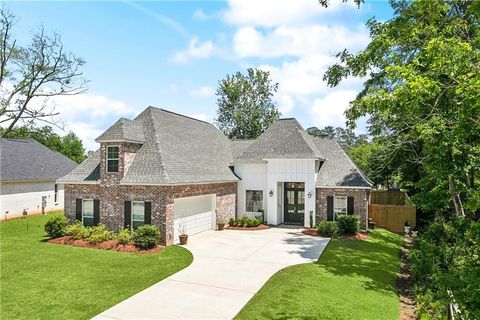
Active
$710,000
5
bds
|
4
ba
|
2,781
sqft
|
built
2022
1763 Hazel Dr, Mandeville, LA 70448
$-339
Cash flow
-2.5%
Cash-on-Cash Return
5.1%
Cap rate
0.6%
Rent to Value Ratio
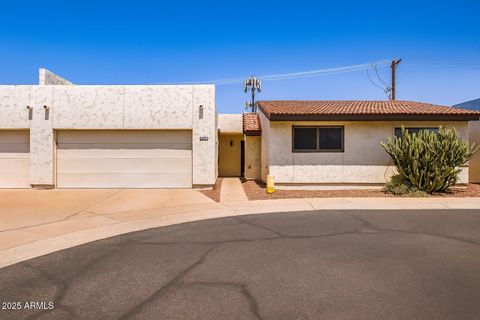
Active
$270,000
2
bds
|
2
ba
|
1,030
sqft
|
built
1981
7780 N 19th Dr, Phoenix, AZ 85021
$-213
Cash flow
-4.1%
Cash-on-Cash Return
4.7%
Cap rate
0.7%
Rent to Value Ratio
Active
$340,000
4
bds
|
3
ba
|
2,484
sqft
|
built
1962
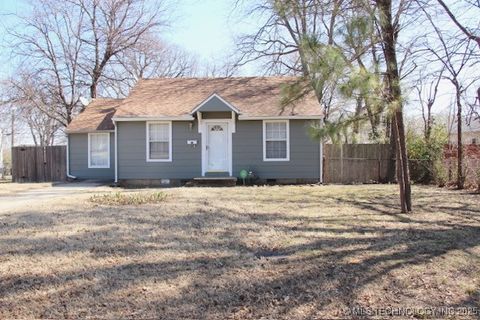
6119 S Hudson Pl, Tulsa, OK 74136
$-470
Cash flow
-7.2%
Cash-on-Cash Return
4.0%
Cap rate
0.6%
Rent to Value Ratio
Active
$189,000
3
bds
|
1
ba
|
916
sqft
|
built
1943
1239 S Erie Ave, Tulsa, OK 74112
$-114
Cash flow
-3.1%
Cash-on-Cash Return
5.0%
Cap rate
0.7%
Rent to Value Ratio
Active
$550,000
3
bds
|
2
ba
|
2,308
sqft
|
built
2005
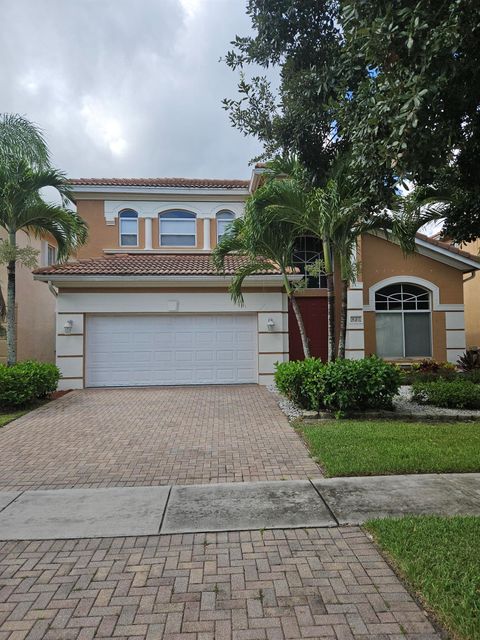
421 Gazetta Way, West Palm Beach, FL 33413
$-1,291
Cash flow
-12.2%
Cash-on-Cash Return
3.3%
Cap rate
0.6%
Rent to Value Ratio
Active
$399,900
4
bds
|
2
ba
|
1,761
sqft
|
built
1955
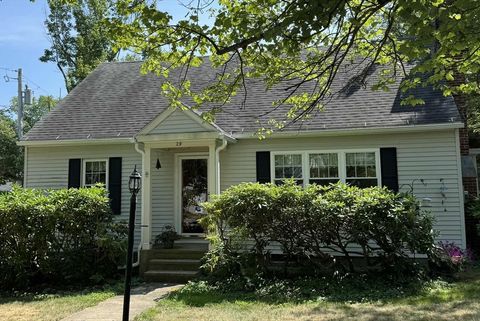
29 Nelson St, Gardner, MA 01440
$-321
Cash flow
-4.2%
Cash-on-Cash Return
4.7%
Cap rate
0.7%
Rent to Value Ratio
Active
$369,900
2
bds
|
1
ba
|
720
sqft
|
built
1957
2923 Vassallo Ave, Lake Worth, FL 33461
$-793
Cash flow
-11.2%
Cash-on-Cash Return
3.6%
Cap rate
0.5%
Rent to Value Ratio
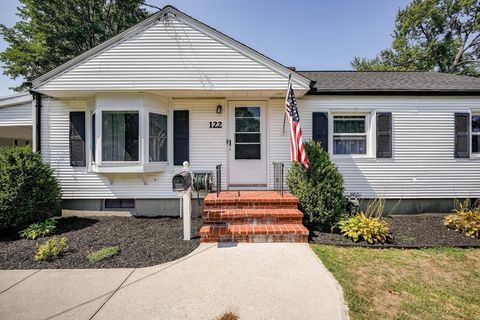
Active
$285,000
3
bds
|
1
ba
|
1,786
sqft
|
built
1954
122 Drexel St, Springfield, MA 01104
$-143
Cash flow
-2.6%
Cash-on-Cash Return
5.1%
Cap rate
0.8%
Rent to Value Ratio
Active
$860,000
4
bds
|
5
ba
|
3,874
sqft
|
built
2022
3724 Creekside Park Dr, Parrish, FL 34219
$-2,465
Cash flow
-15.0%
Cash-on-Cash Return
2.7%
Cap rate
0.5%
Rent to Value Ratio
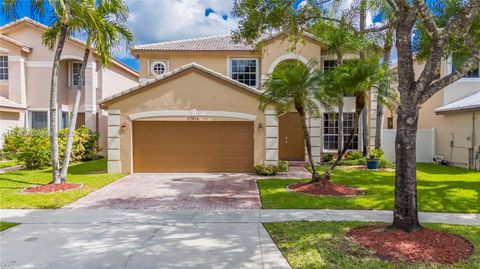
Active
$790,000
4
bds
|
3
ba
|
2,870
sqft
|
built
1998
17915 SW 33rd St, Miramar, FL 33029
$-1,843
Cash flow
-12.2%
Cash-on-Cash Return
3.3%
Cap rate
0.6%
Rent to Value Ratio
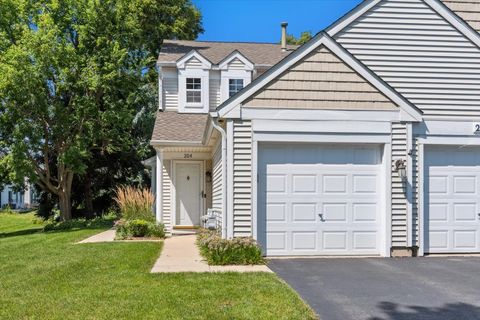
Active
$360,000
3
bds
|
3
ba
|
1,749
sqft
|
built
1991
1111 Clover Hill Ln, Elgin, IL 60120
$-647
Cash flow
-9.4%
Cash-on-Cash Return
3.5%
Cap rate
0.7%
Rent to Value Ratio
Active
$325,000
2
bds
|
2
ba
|
907
sqft
|
built
1984
5866 W 18th Ave, Hialeah, FL 33012
$-714
Cash flow
-11.5%
Cash-on-Cash Return
3.5%
Cap rate
0.7%
Rent to Value Ratio
Active
$649,900
2
bds
|
2
ba
|
1,278
sqft
|
built
1977
1952 Arkansas Ave, Englewood, FL 34224
$-1,830
Cash flow
-14.7%
Cash-on-Cash Return
2.8%
Cap rate
0.4%
Rent to Value Ratio
Active
$699,000
3
bds
|
3
ba
|
2,290
sqft
|
built
1997
4575 S Atlantic Ave, Port Orange, FL 32127
$-2,560
Cash flow
-19.1%
Cash-on-Cash Return
1.8%
Cap rate
0.6%
Rent to Value Ratio
Active
$360,000
2
bds
|
2
ba
|
1,475
sqft
|
built
1980
9316 Sabal Ridge Cir, Boca Raton, FL 33428
$-884
Cash flow
-12.8%
Cash-on-Cash Return
3.2%
Cap rate
0.8%
Rent to Value Ratio
Active
$349,000
3
bds
|
3
ba
|
1,432
sqft
|
built
2015
3211 SE 5th Ct, Homestead, FL 33033
$-744
Cash flow
-11.1%
Cash-on-Cash Return
3.6%
Cap rate
0.7%
Rent to Value Ratio
Active
$500,000
4
bds
|
3
ba
|
2,618
sqft
|
built
2019
17863 Stella Moon Pl, Lutz, FL 33558
$-1,286
Cash flow
-13.4%
Cash-on-Cash Return
3.1%
Cap rate
0.6%
Rent to Value Ratio
Active
$340,000
3
bds
|
2
ba
|
1,513
sqft
|
built
1972
1906 Hawk Trl, Buffalo, MN 55313
$-470
Cash flow
-7.2%
Cash-on-Cash Return
4.0%
Cap rate
0.6%
Rent to Value Ratio
Active
$249,000
2
bds
|
1
ba
|
1,200
sqft
|
built
1984
145 Rustwood Dr, Athens, GA 30606
$-349
Cash flow
-7.3%
Cash-on-Cash Return
4.5%
Cap rate
0.6%
Rent to Value Ratio
Active
$95,000
1
bds
|
1
ba
|
750
sqft
|
built
1970
10113 W 34th St, Hopkins, MN 55305
$-217
Cash flow
-11.9%
Cash-on-Cash Return
2.9%
Cap rate
1.5%
Rent to Value Ratio
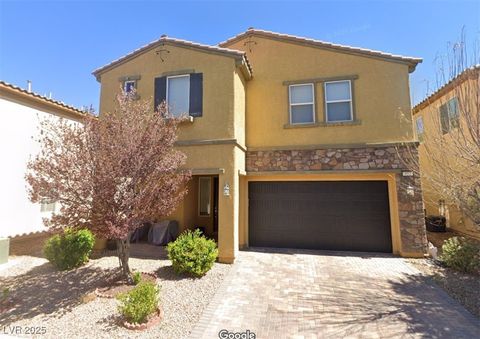
Active
$574,900
4
bds
|
3
ba
|
2,936
sqft
|
built
2013
952 Pretty Fire St, Las Vegas, NV 89178
$-1,207
Cash flow
-11.0%
Cash-on-Cash Return
3.2%
Cap rate
0.5%
Rent to Value Ratio
Active
$309,000
2
bds
|
2
ba
|
1,240
sqft
|
built
1999
2611 Cedar Glade Dr, Naperville, IL 60564
$-656
Cash flow
-11.1%
Cash-on-Cash Return
3.1%
Cap rate
0.7%
Rent to Value Ratio
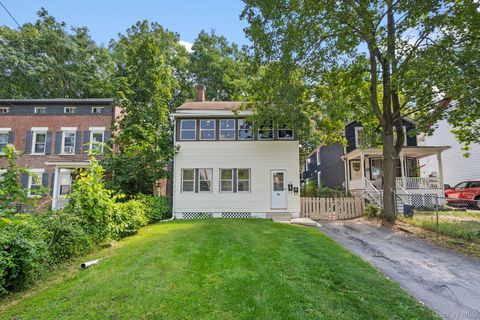
Active
$385,000
4
bds
|
2
ba
|
0
sqft
|
built
1890
93 Delafield St, Poughkeepsie, NY 12601
$-734
Cash flow
-9.9%
Cash-on-Cash Return
3.8%
Cap rate
0.7%
Rent to Value Ratio
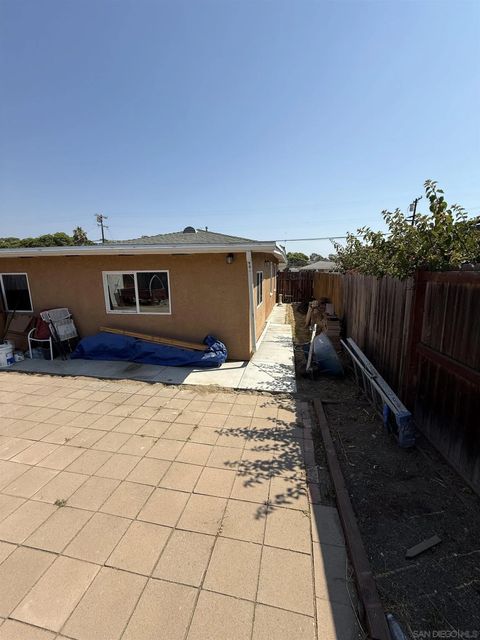
Active
$725,000
3
bds
|
1
ba
|
1,044
sqft
|
built
1951
6310 Thorn St, San Diego, CA 92115
$-1,251
Cash flow
-9.0%
Cash-on-Cash Return
4.0%
Cap rate
0.5%
Rent to Value Ratio
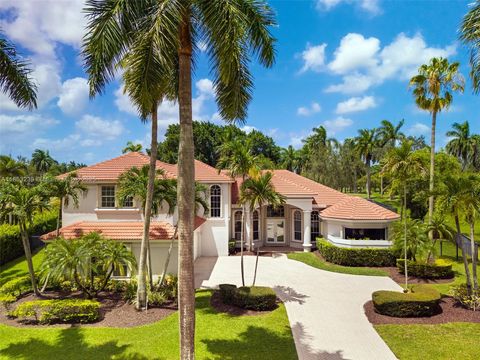
Active
$3,295,000
5
bds
|
6
ba
|
5,507
sqft
|
built
1997
2438 Poinciana Ct, Weston, FL 33327
$-13,567
Cash flow
-21.5%
Cash-on-Cash Return
1.2%
Cap rate
0.3%
Rent to Value Ratio