United States Investment Properties for Sale
Browse homes for sale and investment properties in United States. Refine your search by price, property type, or more.
Best cash flowing properties in United States
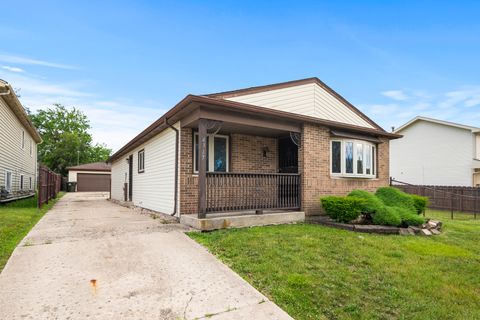
Active
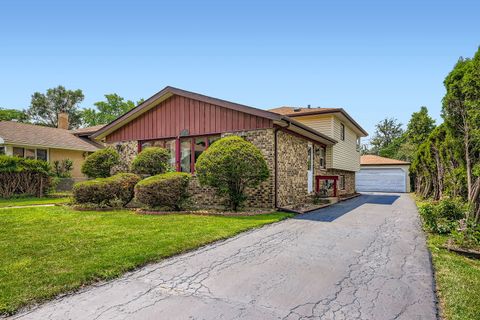
$121,000
3
bds
|
1
ba
|
1,261
sqft
|
built
1985
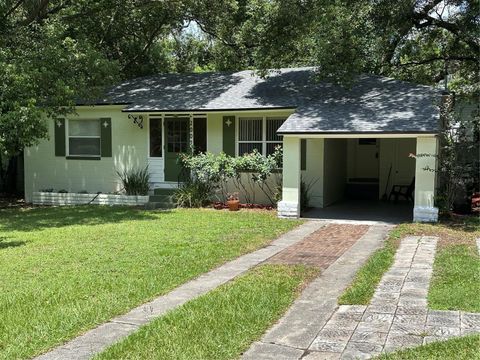
4317 182nd Pl, Country Club Hills, IL 60478
$446
Cash flow
19.2%
Cash-on-Cash Return
10.1%
Cap rate
2.1%
Rent to Value Ratio
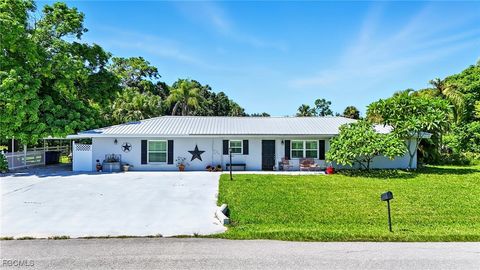
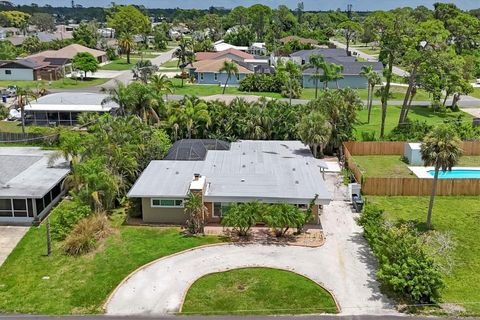
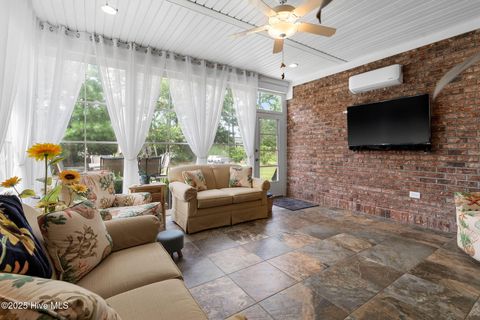
Active
$299,000
3
bds
|
2
ba
|
2,140
sqft
|
built
1978
16090 Old Olga Rd, Alva, FL 33920
$74
Cash flow
1.3%
Cash-on-Cash Return
6.4%
Cap rate
0.8%
Rent to Value Ratio
10,000 out of 325,063 properties for sale in United States
Limited Results Shown
Create a free account, or log in to reveal all property listings and enjoy the complete experience.
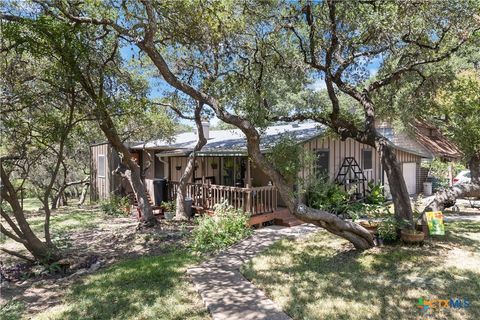
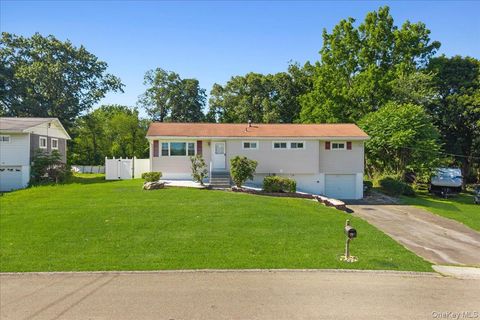
Active
$335,000
3
bds
|
2
ba
|
1,340
sqft
|
built
1981
1588 Westview Court Dr, Canyon Lake, TX 78133
$-719
Cash flow
-11.2%
Cash-on-Cash Return
3.1%
Cap rate
0.5%
Rent to Value Ratio
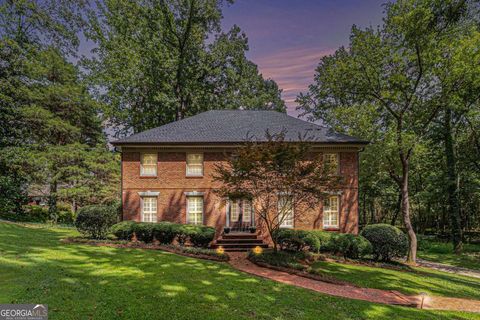
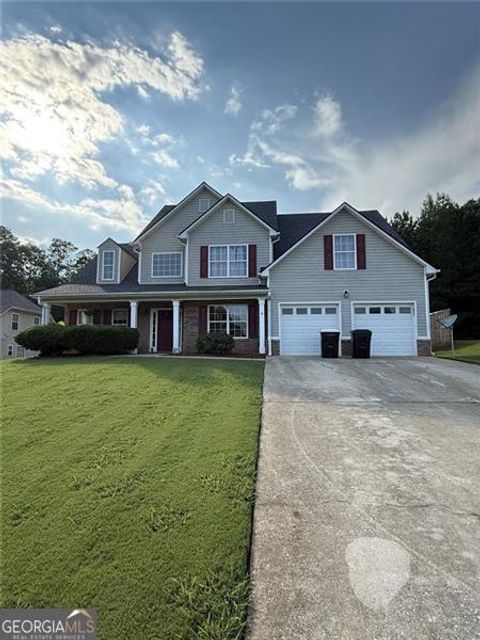
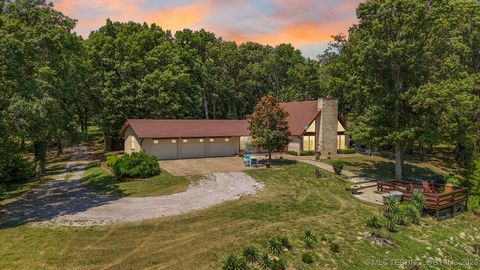
Active
$850,000
4
bds
|
3.5
ba
|
4,182
sqft
|
built
1973
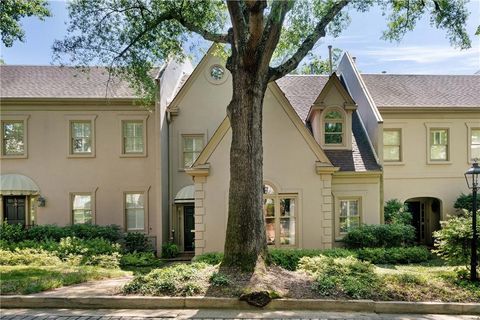
2270 Emerald Dr, Jonesboro, GA 30236
$-1,791
Cash flow
-11.0%
Cash-on-Cash Return
3.6%
Cap rate
0.5%
Rent to Value Ratio
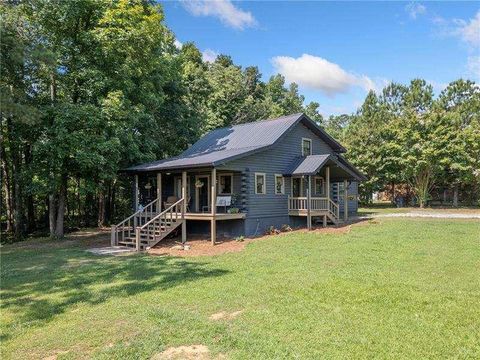
Active
$275,000
3
bds
|
2
ba
|
1,642
sqft
|
built
1988
1594 Goswick Rd, Chatsworth, GA 30705
$-366
Cash flow
-6.9%
Cash-on-Cash Return
4.6%
Cap rate
0.6%
Rent to Value Ratio
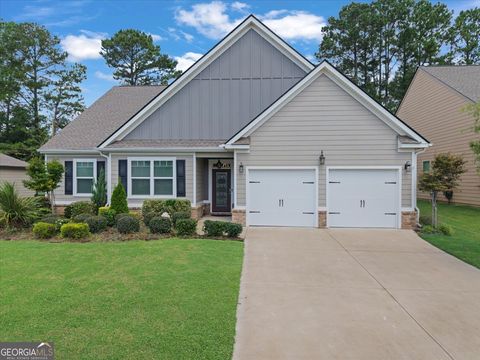
Active
$414,000
4
bds
|
2
ba
|
1,918
sqft
|
built
2021
1041 Creekwood Cir, Madison, GA 30650
$-750
Cash flow
-9.5%
Cash-on-Cash Return
4.0%
Cap rate
0.6%
Rent to Value Ratio
Active
$215,000
1
bds
|
1
ba
|
0
sqft
|
built
1962
300 Peachtree St NE, Atlanta, GA 30308
$-562
Cash flow
-13.6%
Cash-on-Cash Return
3.0%
Cap rate
0.9%
Rent to Value Ratio
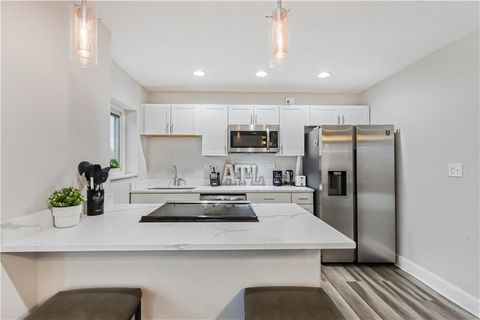
Active
$349,900
4
bds
|
3.5
ba
|
2,565
sqft
|
built
2005
524 Birchwood Dr, Temple, GA 30179
$-567
Cash flow
-8.5%
Cash-on-Cash Return
4.2%
Cap rate
0.6%
Rent to Value Ratio
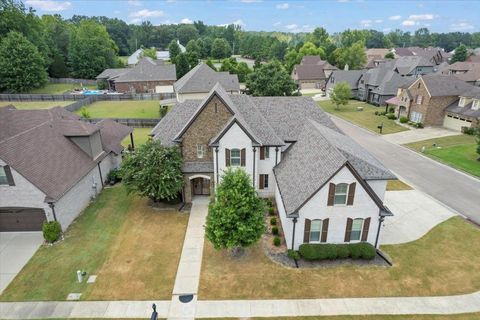
Active
$509,000
5
bds
|
3
ba
|
4,360
sqft
|
built
1994
425 Fairway Ct, Newnan, GA 30265
$-798
Cash flow
-8.2%
Cash-on-Cash Return
4.3%
Cap rate
0.6%
Rent to Value Ratio
Active
$1,850,000
3
bds
|
4
ba
|
4,037
sqft
|
built
1982
2525 Peachtree Rd NE, Atlanta, GA 30305
$-7,821
Cash flow
-22.1%
Cash-on-Cash Return
1.1%
Cap rate
0.4%
Rent to Value Ratio
Active
$220,000
2
bds
|
2
ba
|
937
sqft
|
built
1990
3016 Parkway Blvd, Kissimmee, FL 34747
$-541
Cash flow
-12.8%
Cash-on-Cash Return
3.2%
Cap rate
0.8%
Rent to Value Ratio
Active
$649,000
3
bds
|
3
ba
|
1,262
sqft
|
built
2020
2000 Metropica Way, Sunrise, FL 33323
$-3,611
Cash flow
-29.0%
Cash-on-Cash Return
-0.5%
Cap rate
0.6%
Rent to Value Ratio

Active
$780,000
1
bds
|
2
ba
|
997
sqft
|
built
2016
88 SW 7th St, Miami, FL 33130
$-2,798
Cash flow
-18.7%
Cash-on-Cash Return
1.8%
Cap rate
0.7%
Rent to Value Ratio
Active
$10,450,000
5
bds
|
6
ba
|
4,550
sqft
|
built
2022
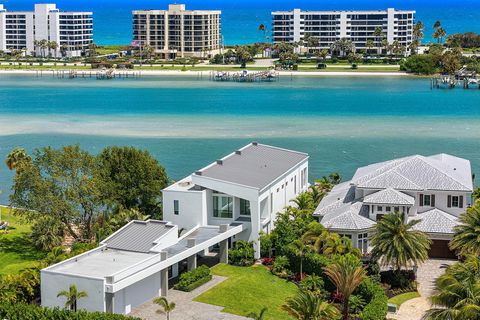
3445 Harbor Rd N, Jupiter, FL 33469
$-54,817
Cash flow
-27.4%
Cash-on-Cash Return
-0.1%
Cap rate
0.1%
Rent to Value Ratio
Active
$475,000
2
bds
|
3
ba
|
1,670
sqft
|
built
1985
5803 Myrtle Ln, Tampa, FL 33625
$-857
Cash flow
-9.4%
Cash-on-Cash Return
4.0%
Cap rate
0.6%
Rent to Value Ratio
Active
$300,000
3
bds
|
2
ba
|
0
sqft
|
built
2017
747 Center Lake St, Lehigh Acres, FL 33974
$-295
Cash flow
-5.1%
Cash-on-Cash Return
5.0%
Cap rate
0.7%
Rent to Value Ratio

Active
$499,000
4
bds
|
3
ba
|
2,188
sqft
|
built
2004
2807 Banner Stone Ct, Holiday, FL 34691
$-898
Cash flow
-9.4%
Cash-on-Cash Return
4.0%
Cap rate
0.6%
Rent to Value Ratio
Active
$430,000
5
bds
|
4
ba
|
2,376
sqft
|
built
1999
302 Julliard Blvd, Davenport, FL 33897
$-579
Cash flow
-7.0%
Cash-on-Cash Return
4.5%
Cap rate
0.7%
Rent to Value Ratio
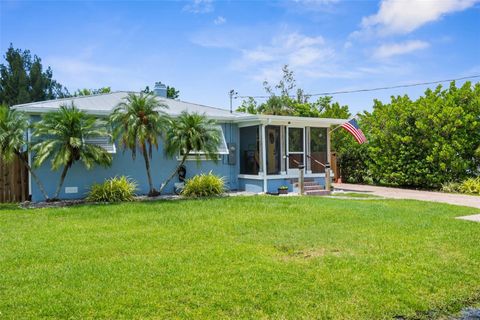
Active
$399,900
4
bds
|
2
ba
|
2,188
sqft
|
built
1956
4919 Lemon Bay Dr, Venice, FL 34293
$-127
Cash flow
-1.7%
Cash-on-Cash Return
5.8%
Cap rate
0.8%
Rent to Value Ratio
Active
$249,000
2
bds
|
1
ba
|
950
sqft
|
built
1949
219 Darst Ave, Punta Gorda, FL 33950
$-215
Cash flow
-4.5%
Cash-on-Cash Return
5.1%
Cap rate
0.8%
Rent to Value Ratio
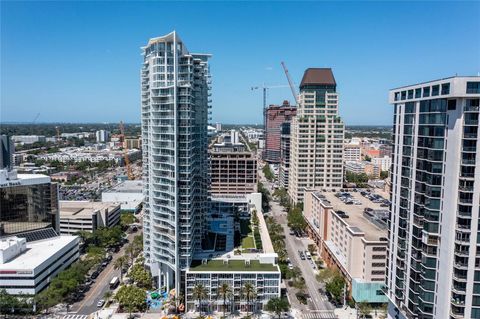
Active
$930,000
2
bds
|
2
ba
|
1,197
sqft
|
built
2009
175 1st St S, Saint Petersburg, FL 33701
$-3,045
Cash flow
-17.1%
Cash-on-Cash Return
2.2%
Cap rate
0.6%
Rent to Value Ratio
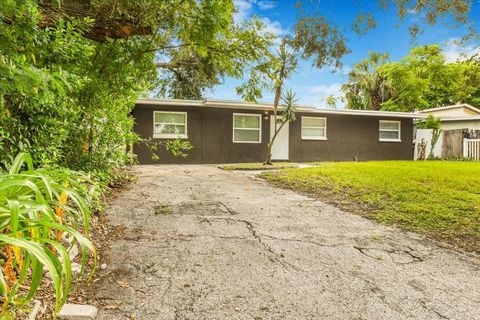
Active
$400,000
4
bds
|
2
ba
|
1,338
sqft
|
built
1957
2110 Alemanda Dr, Clearwater, FL 33764
$-1,065
Cash flow
-13.9%
Cash-on-Cash Return
3.0%
Cap rate
0.4%
Rent to Value Ratio
Active
$365,000
2
bds
|
2
ba
|
1,156
sqft
|
built
1950
2009 Forest Cir, Orlando, FL 32803
$-551
Cash flow
-7.9%
Cash-on-Cash Return
4.3%
Cap rate
0.6%
Rent to Value Ratio
Active
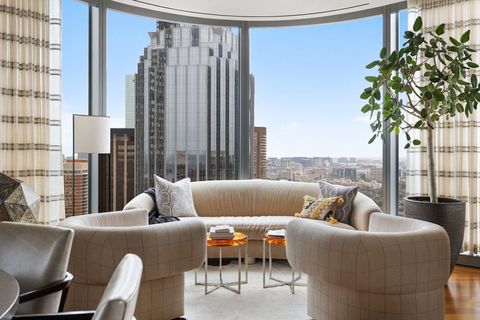
$6,295,000
2
bds
|
3
ba
|
2,226
sqft
|
built
2015
1 Dalton St, Boston, MA 02115
$-32,947
Cash flow
-27.3%
Cash-on-Cash Return
-0.6%
Cap rate
0.1%
Rent to Value Ratio
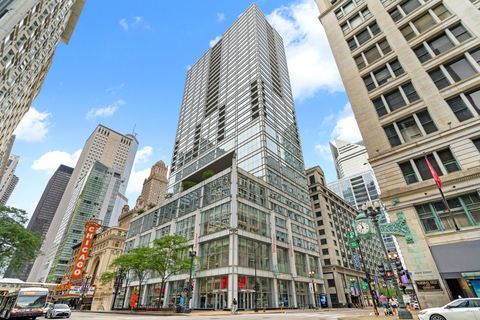
Active
$289,000
1
bds
|
1
ba
|
0
sqft
|
built
2008
8 E Randolph St, Chicago, IL 60601
$-554
Cash flow
-10.0%
Cash-on-Cash Return
3.4%
Cap rate
1.0%
Rent to Value Ratio
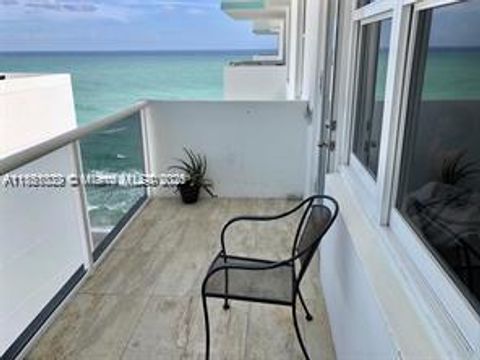
Active
$425,000
1
bds
|
2
ba
|
896
sqft
|
built
1971
3725 S Ocean Dr, Hollywood, FL 33019
$-1,289
Cash flow
-15.8%
Cash-on-Cash Return
2.5%
Cap rate
0.8%
Rent to Value Ratio
Active
$424,900
3
bds
|
2
ba
|
1,754
sqft
|
built
1973
684 N Howard Ave, Elmhurst, IL 60126
$-406
Cash flow
-5.0%
Cash-on-Cash Return
4.5%
Cap rate
0.8%
Rent to Value Ratio
Active
$770,000
4
bds
|
3
ba
|
3,130
sqft
|
built
2015
2514 Sugargrove Trl NE, Leland, NC 28451
$-1,389
Cash flow
-9.4%
Cash-on-Cash Return
3.5%
Cap rate
0.5%
Rent to Value Ratio
Active
$469,999
3
bds
|
2
ba
|
2,028
sqft
|
built
1958
24 Stony Run Rd, Newburgh, NY 12550
$-851
Cash flow
-9.4%
Cash-on-Cash Return
3.9%
Cap rate
0.6%
Rent to Value Ratio
Active
$595,000
3
bds
|
3
ba
|
2,548
sqft
|
built
1980
8401 S 4130 Rd, Talala, OK 74080
$-820
Cash flow
-7.2%
Cash-on-Cash Return
4.0%
Cap rate
0.5%
Rent to Value Ratio
Active
$650,000
5
bds
|
3
ba
|
0
sqft
|
built
2017
9576 Grays Song Dr, Cordova, TN 38018
$-1,238
Cash flow
-9.9%
Cash-on-Cash Return
3.4%
Cap rate
0.5%
Rent to Value Ratio
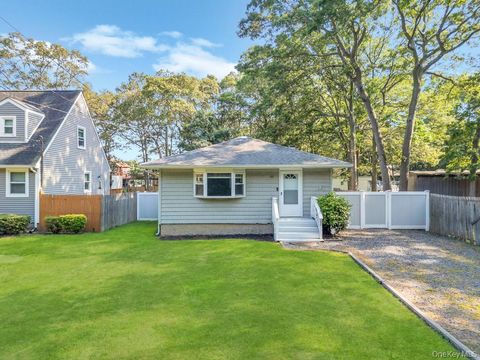
Active
$465,000
3
bds
|
1
ba
|
996
sqft
|
built
1970
62 Eleanor Ave, Mastic, NY 11950
$-573
Cash flow
-6.4%
Cash-on-Cash Return
4.6%
Cap rate
0.8%
Rent to Value Ratio
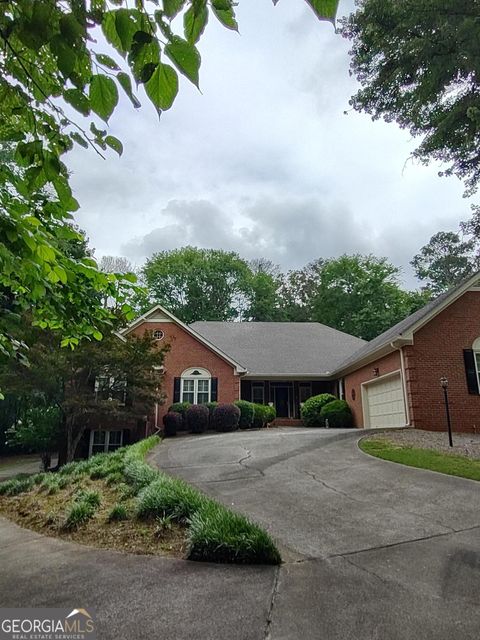
Active
$575,000
4
bds
|
4.5
ba
|
4,680
sqft
|
built
1992
5015 Shadow Path Ln SW, Lilburn, GA 30047
$-1,174
Cash flow
-10.7%
Cash-on-Cash Return
3.7%
Cap rate
0.5%
Rent to Value Ratio
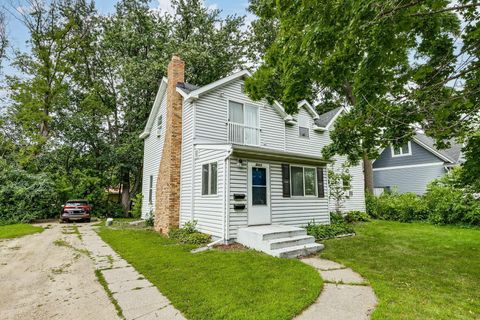
Active
$450,000
5
bds
|
3
ba
|
2,060
sqft
|
built
1885
4969 Stewart Ave, White Bear Lake, MN 55110
$-1,107
Cash flow
-12.8%
Cash-on-Cash Return
2.7%
Cap rate
0.5%
Rent to Value Ratio
Active
$570,000
2
bds
|
2
ba
|
1,500
sqft
|
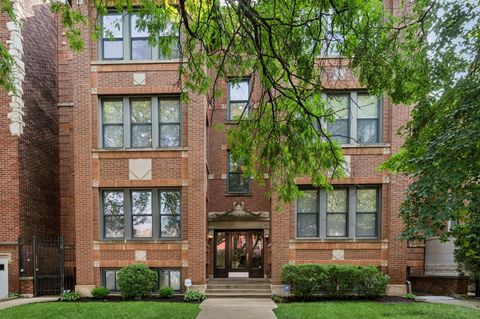
built
1917
4647 N Wolcott Ave, Chicago, IL 60640
$-1,307
Cash flow
-12.0%
Cash-on-Cash Return
2.9%
Cap rate
0.6%
Rent to Value Ratio
Active
$549,900
8
bds
|
3
ba
|
0
sqft
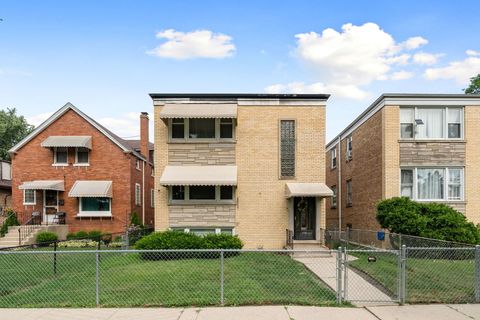
|
built
1958
2705 N Sayre Ave, Chicago, IL 60707
$-1,000
Cash flow
-9.5%
Cash-on-Cash Return
3.5%
Cap rate
0.5%
Rent to Value Ratio
Active
$249,900
2
bds
|
1
ba
|
1,300
sqft
|
built
1979
5501 N California Ave, Chicago, IL 60625
$-145
Cash flow
-3.0%
Cash-on-Cash Return
5.0%
Cap rate
0.9%
Rent to Value Ratio
Active
$449,995
2
bds
|
2
ba
|
0
sqft
|
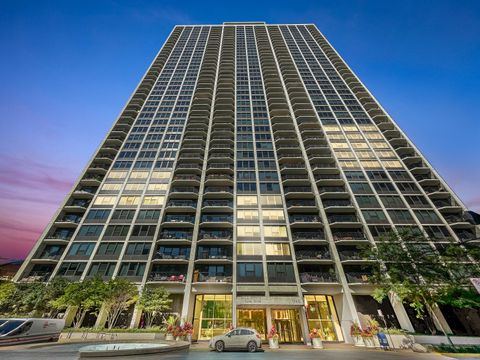
built
1970
1560 N Sandburg Ter, Chicago, IL 60610
$-1,814
Cash flow
-21.0%
Cash-on-Cash Return
0.8%
Cap rate
0.7%
Rent to Value Ratio
Active
$239,999
1
bds
|
1
ba
|
705
sqft
|
built
2005
1720 S Michigan Ave, Chicago, IL 60616
$-726
Cash flow
-15.8%
Cash-on-Cash Return
2.1%
Cap rate
0.8%
Rent to Value Ratio
Active
$173,500
2
bds
|
1
ba
|
1,008
sqft
|
built
1950
3418 Butterworth St SW, Grand Rapids, MI 49534
$-58
Cash flow
-1.7%
Cash-on-Cash Return
5.7%
Cap rate
0.8%
Rent to Value Ratio