Box Elder County Investment Properties for Sale
Browse homes for sale and investment properties in Box Elder County. Refine your search by price, property type, or more.
Best cash flowing properties in Box Elder County
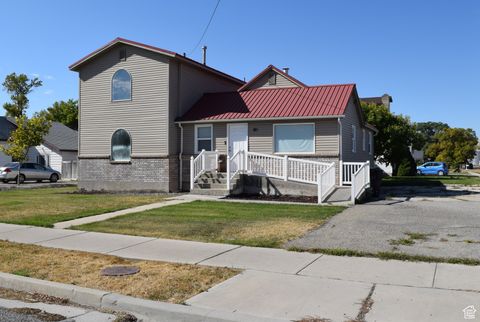
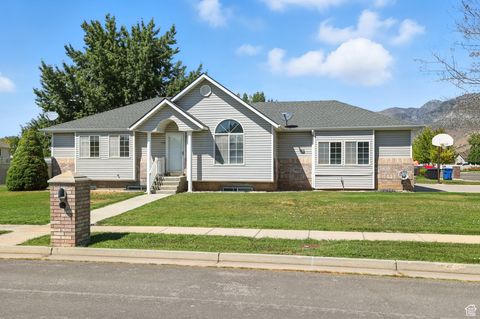
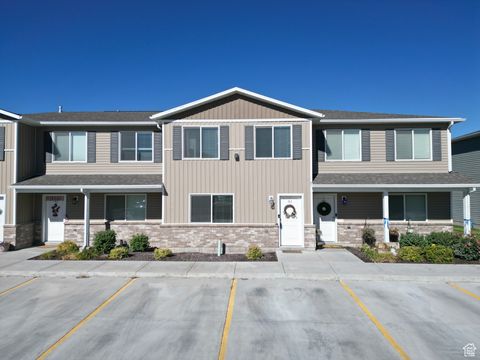
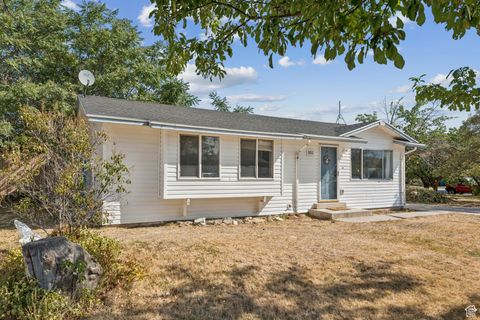
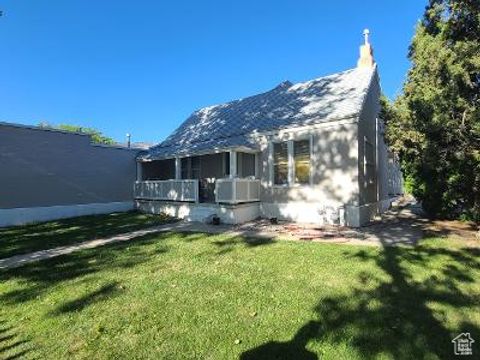
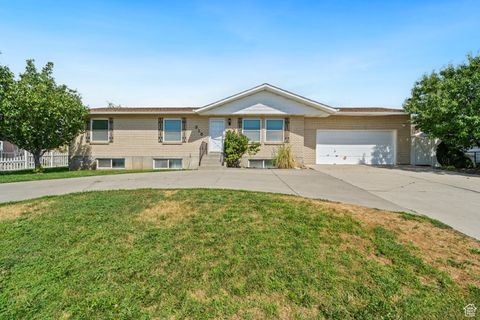
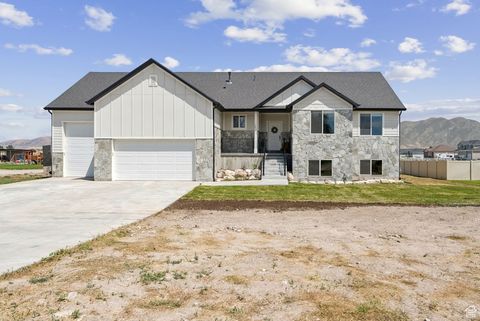
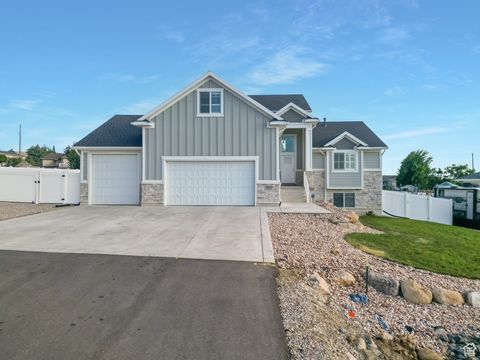
Active
$348,900
4
bds
|
2
ba
|
2,903
sqft
|
built
1941
112 S Main St, Garland, UT 84312
$-304
Cash flow
-4.5%
Cash-on-Cash Return
4.6%
Cap rate
0.6%
Rent to Value Ratio
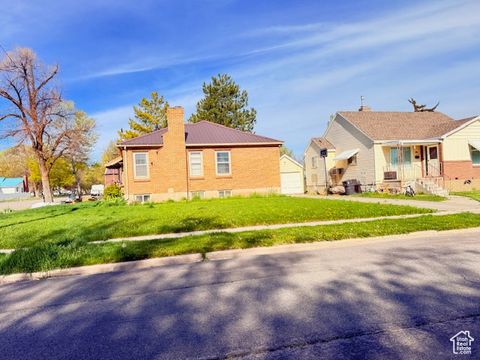
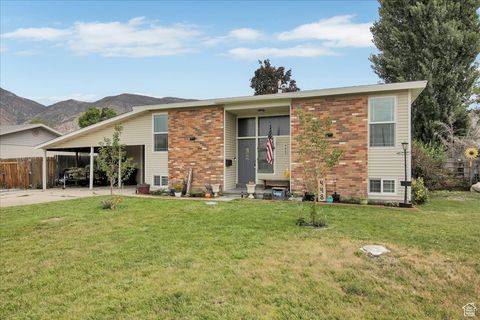
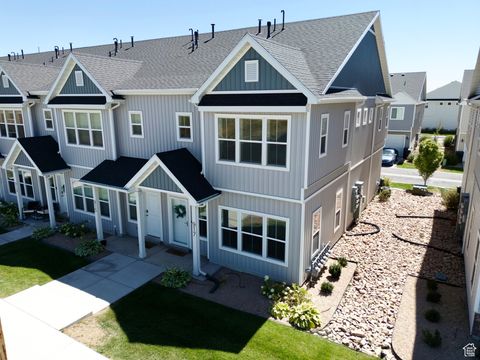
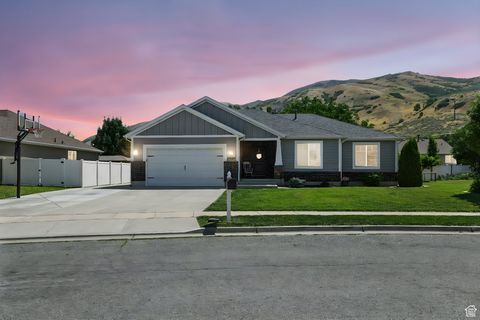
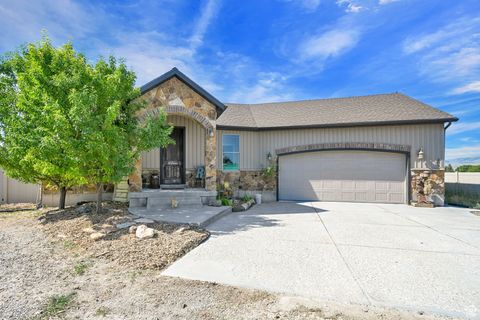
Active
$344,900
3
bds
|
3
ba
|
2,694
sqft
|
built
1942
155 E 300 N, Tremonton, UT 84337
$-375
Cash flow
-5.7%
Cash-on-Cash Return
4.4%
Cap rate
0.6%
Rent to Value Ratio
121 out of 153 properties for sale in Box Elder County
Limited Results Shown
Create a free account, or log in to reveal all property listings and enjoy the complete experience.
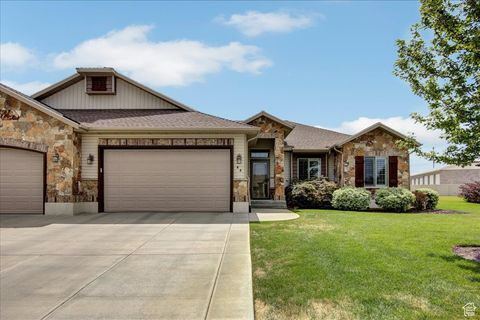
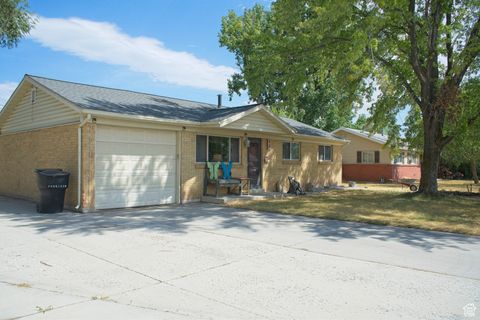
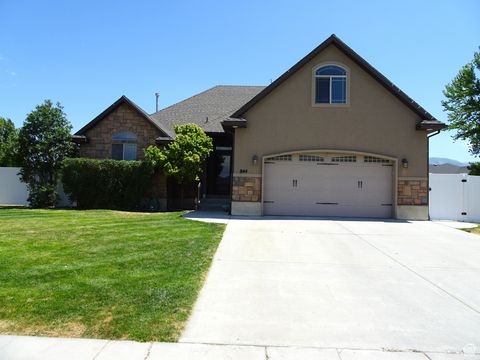
Active
$369,900
4
bds
|
2
ba
|
1,436
sqft
|
built
1925
105 N 300 W, Brigham City, UT 84302
$-556
Cash flow
-7.8%
Cash-on-Cash Return
3.9%
Cap rate
0.5%
Rent to Value Ratio
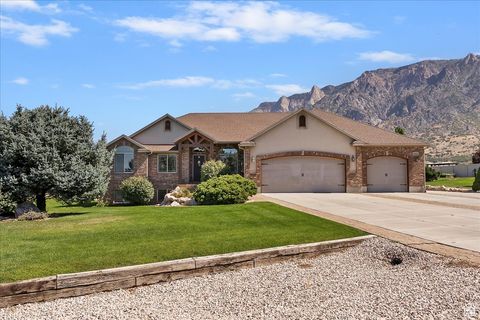
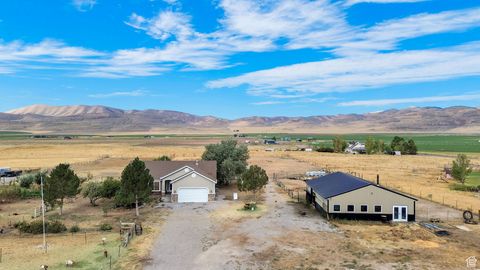
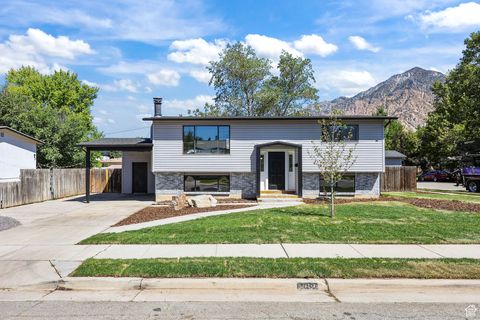
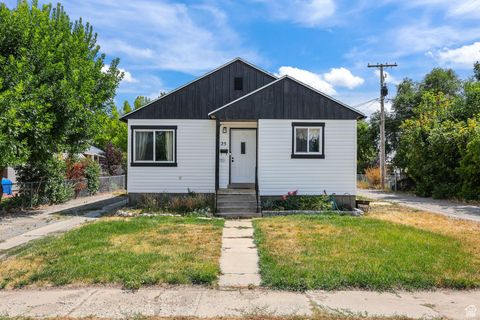
Active
$424,999
5
bds
|
2
ba
|
2,040
sqft
|
built
1975
16580 N 5200 W, Garland, UT 84312
$-929
Cash flow
-11.4%
Cash-on-Cash Return
3.1%
Cap rate
0.4%
Rent to Value Ratio
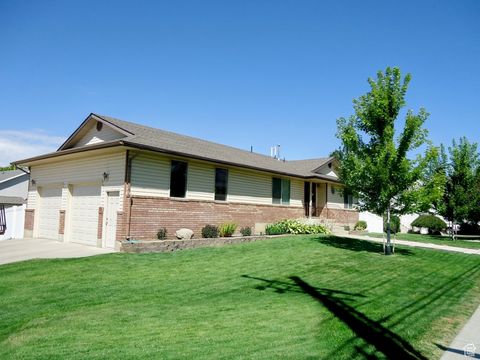
Active
$449,900
4
bds
|
3
ba
|
2,271
sqft
|
built
1974
134 Skyline Dr, Brigham City, UT 84302
$-1,092
Cash flow
-12.7%
Cash-on-Cash Return
2.8%
Cap rate
0.4%
Rent to Value Ratio
Active
$385,000
4
bds
|
2
ba
|
1,880
sqft
|
built
1971
448 Parkinson Dr, Brigham City, UT 84302
$-584
Cash flow
-7.9%
Cash-on-Cash Return
3.9%
Cap rate
0.5%
Rent to Value Ratio
Active
$415,000
2
bds
|
2
ba
|
1,412
sqft
|
built
2012
44 E 1300 N, Brigham City, UT 84302
$-1,034
Cash flow
-13.0%
Cash-on-Cash Return
2.7%
Cap rate
0.4%
Rent to Value Ratio
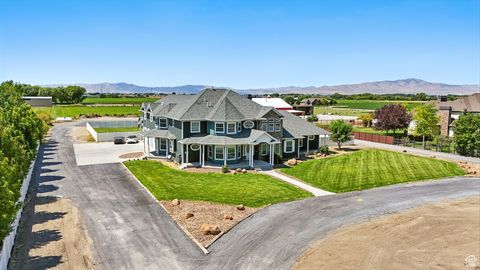
Active
$845,000
4
bds
|
5
ba
|
3,800
sqft
|
built
2006
860 W 8100 S, Willard, UT 84340
$-2,774
Cash flow
-17.1%
Cash-on-Cash Return
1.7%
Cap rate
0.3%
Rent to Value Ratio
Active
$525,000
5
bds
|
3
ba
|
2,146
sqft
|
built
1998
748 W 650 N, Brigham City, UT 84302
$-1,131
Cash flow
-11.2%
Cash-on-Cash Return
3.1%
Cap rate
0.4%
Rent to Value Ratio
Active
$794,000
4
bds
|
3
ba
|
2,988
sqft
|
built
2000
13585 N 10000 W, Tremonton, UT 84337
$-2,635
Cash flow
-17.3%
Cash-on-Cash Return
1.7%
Cap rate
0.3%
Rent to Value Ratio
Active
$850,000
5
bds
|
3
ba
|
4,000
sqft
|
built
1975
15600 N Beaver Dam Rd, Collinston, UT 84306
$-2,522
Cash flow
-15.5%
Cash-on-Cash Return
2.1%
Cap rate
0.3%
Rent to Value Ratio
Active
$485,000
4
bds
|
3
ba
|
2,330
sqft
|
built
1993
946 S 800 W, Brigham City, UT 84302
$-1,084
Cash flow
-11.7%
Cash-on-Cash Return
3.0%
Cap rate
0.4%
Rent to Value Ratio
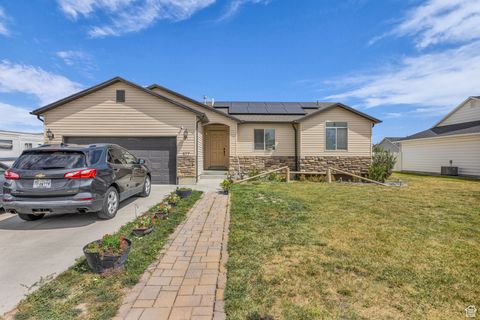
Active
$265,000
3
bds
|
2
ba
|
1,340
sqft
|
built
2018
320 W 600 S, Tremonton, UT 84337
$-566
Cash flow
-11.1%
Cash-on-Cash Return
3.1%
Cap rate
0.6%
Rent to Value Ratio
Active
$290,000
3
bds
|
3
ba
|
1,476
sqft
|
built
2021
917 W 1000 N, Tremonton, UT 84337
$-392
Cash flow
-7.1%
Cash-on-Cash Return
4.1%
Cap rate
0.6%
Rent to Value Ratio
Active
$314,900
3
bds
|
1
ba
|
990
sqft
|
built
1961
795 S 150 W, Tremonton, UT 84337
$-654
Cash flow
-10.8%
Cash-on-Cash Return
3.2%
Cap rate
0.4%
Rent to Value Ratio
Active
$417,000
4
bds
|
2
ba
|
1,870
sqft
|
built
1971
262 W 800 N, Brigham City, UT 84302
$-1,008
Cash flow
-12.6%
Cash-on-Cash Return
2.8%
Cap rate
0.4%
Rent to Value Ratio
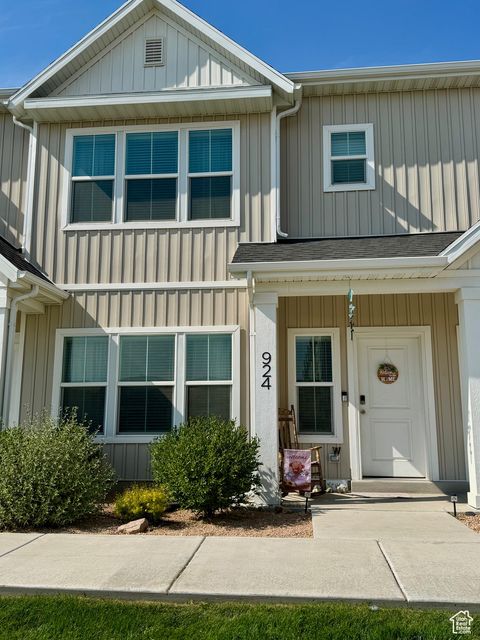
Active
$299,900
3
bds
|
1
ba
|
924
sqft
|
built
1980
551 W 720 S, Tremonton, UT 84337
$-603
Cash flow
-10.5%
Cash-on-Cash Return
3.3%
Cap rate
0.5%
Rent to Value Ratio
Active
$337,000
2
bds
|
1
ba
|
660
sqft
|
built
1908
627 N Main St, Garland, UT 84312
$-938
Cash flow
-14.5%
Cash-on-Cash Return
2.3%
Cap rate
0.3%
Rent to Value Ratio
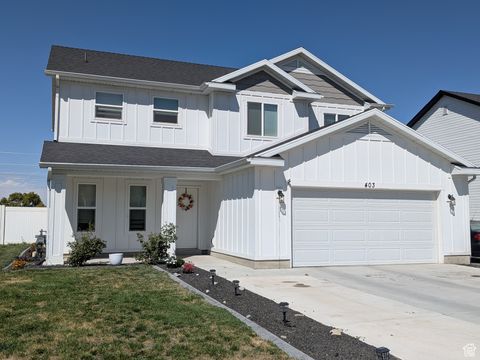
Active
$499,900
4
bds
|
3
ba
|
2,153
sqft
|
built
2021
403 N 800 W, Brigham City, UT 84302
$-817
Cash flow
-8.5%
Cash-on-Cash Return
3.7%
Cap rate
0.5%
Rent to Value Ratio
Active
$725,000
5
bds
|
3
ba
|
2,772
sqft
|
built
1997
625 E 100 S, Brigham City, UT 84302
$-2,266
Cash flow
-16.3%
Cash-on-Cash Return
1.9%
Cap rate
0.3%
Rent to Value Ratio
Active
$575,000
9
bds
|
6
ba
|
1,900
sqft
|
built
1900
557 S Main St, Brigham City, UT 84302
$-1,788
Cash flow
-16.2%
Cash-on-Cash Return
1.9%
Cap rate
0.3%
Rent to Value Ratio
Active
$450,000
4
bds
|
1
ba
|
1,859
sqft
|
built
1953
311 S 100 W, Tremonton, UT 84337
$-834
Cash flow
-9.7%
Cash-on-Cash Return
3.5%
Cap rate
0.5%
Rent to Value Ratio
Active
$629,000
5
bds
|
4
ba
|
4,027
sqft
|
built
2021
1069 N 2800 W, Tremonton, UT 84337
$-901
Cash flow
-7.5%
Cash-on-Cash Return
4.0%
Cap rate
0.6%
Rent to Value Ratio
Active
$415,000
3
bds
|
2
ba
|
2,184
sqft
|
built
1959
1076 Sycamore Dr, Brigham City, UT 84302
$-874
Cash flow
-11.0%
Cash-on-Cash Return
3.2%
Cap rate
0.4%
Rent to Value Ratio
Active
$300,000
3
bds
|
3
ba
|
1,513
sqft
|
built
2021
924 W 960 N, Tremonton, UT 84337
$-434
Cash flow
-7.5%
Cash-on-Cash Return
3.9%
Cap rate
0.6%
Rent to Value Ratio
Active
$478,000
5
bds
|
2
ba
|
2,582
sqft
|
built
1963
801 Medoland Dr, Brigham City, UT 84302
$-1,065
Cash flow
-11.6%
Cash-on-Cash Return
3.0%
Cap rate
0.4%
Rent to Value Ratio
Active
$450,000
3
bds
|
2
ba
|
1,555
sqft
|
built
2022
877 N 2300 W, Tremonton, UT 84337
$-1,085
Cash flow
-12.6%
Cash-on-Cash Return
2.8%
Cap rate
0.4%
Rent to Value Ratio
Active
$449,900
4
bds
|
2
ba
|
2,052
sqft
|
built
1962
505 W 500 S, Brigham City, UT 84302
$-1,035
Cash flow
-12.0%
Cash-on-Cash Return
2.9%
Cap rate
0.4%
Rent to Value Ratio
Active
$469,900
5
bds
|
3
ba
|
2,942
sqft
|
built
1978
315 S 500 W, Brigham City, UT 84302
$-1,125
Cash flow
-12.5%
Cash-on-Cash Return
2.8%
Cap rate
0.4%
Rent to Value Ratio
Active
$1,899,000
8
bds
|
8
ba
|
7,409
sqft
|
built
2013
8325 N 3600 W, Honeyville, UT 84314
$-7,368
Cash flow
-20.2%
Cash-on-Cash Return
1.0%
Cap rate
0.2%
Rent to Value Ratio
Active
$517,810
3
bds
|
2
ba
|
3,380
sqft
|
built
2023
1118 E 1310 S, Garland, UT 84312
$-864
Cash flow
-8.7%
Cash-on-Cash Return
3.7%
Cap rate
0.5%
Rent to Value Ratio
Active
$465,000
5
bds
|
3
ba
|
2,625
sqft
|
built
2013
477 E 1325 S, Garland, UT 84312
$-1,426
Cash flow
-16.0%
Cash-on-Cash Return
2.0%
Cap rate
0.3%
Rent to Value Ratio
Active
$729,000
3
bds
|
2
ba
|
3,344
sqft
|
built
2023
10160 N 6800 W, Tremonton, UT 84337
$-1,684
Cash flow
-12.1%
Cash-on-Cash Return
2.9%
Cap rate
0.4%
Rent to Value Ratio
Active
$589,000
6
bds
|
3
ba
|
2,890
sqft
|
built
2012
2277 S 525 W, Brigham City, UT 84302
$-1,495
Cash flow
-13.2%
Cash-on-Cash Return
2.6%
Cap rate
0.4%
Rent to Value Ratio
Active
$586,900
6
bds
|
3
ba
|
3,523
sqft
|
built
2007
844 N 400 E, Tremonton, UT 84337
$-1,188
Cash flow
-10.6%
Cash-on-Cash Return
3.2%
Cap rate
0.5%
Rent to Value Ratio
Active
$335,000
4
bds
|
1
ba
|
1,646
sqft
|
built
1946
25 W 400 S, Tremonton, UT 84337
$-551
Cash flow
-8.6%
Cash-on-Cash Return
3.7%
Cap rate
0.5%
Rent to Value Ratio
Active
$775,000
5
bds
|
4
ba
|
3,463
sqft
|
built
2020
581 W 7550 S, Willard, UT 84340
$-1,450
Cash flow
-9.8%
Cash-on-Cash Return
3.4%
Cap rate
0.5%
Rent to Value Ratio
Active
$735,000
3
bds
|
3
ba
|
2,680
sqft
|
built
2013
209 W 100 S, Fielding, UT 84311
$-2,566
Cash flow
-18.2%
Cash-on-Cash Return
1.5%
Cap rate
0.2%
Rent to Value Ratio
Active
$270,000
2
bds
|
2
ba
|
1,225
sqft
|
built
1998
750 S 400 E, Brigham City, UT 84302
$-552
Cash flow
-10.7%
Cash-on-Cash Return
3.2%
Cap rate
0.5%
Rent to Value Ratio
Active
$599,000
4
bds
|
3
ba
|
2,321
sqft
|
built
2007
3970 W Arizona St, Corinne, UT 84307
$-1,525
Cash flow
-13.3%
Cash-on-Cash Return
2.6%
Cap rate
0.4%
Rent to Value Ratio