Utah Investment Properties for Sale
Browse homes for sale and investment properties in Utah. Refine your search by price, property type, or more.
Best cash flowing properties in Utah

Active
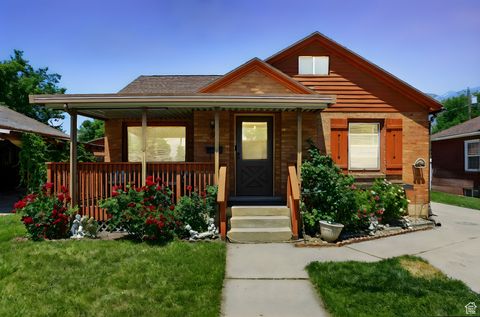
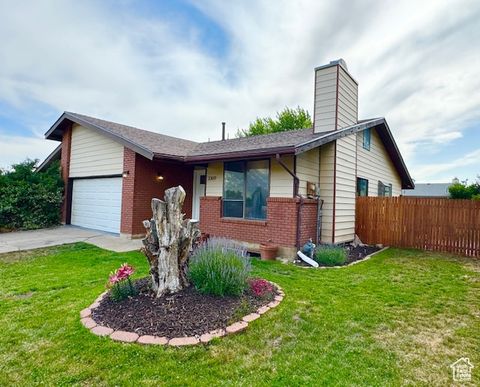
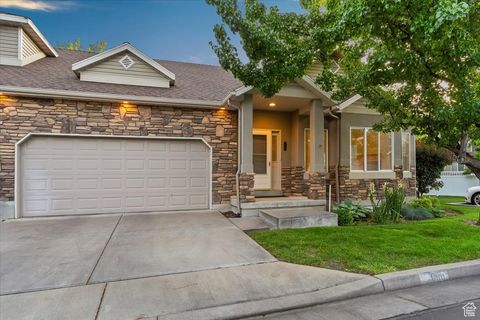
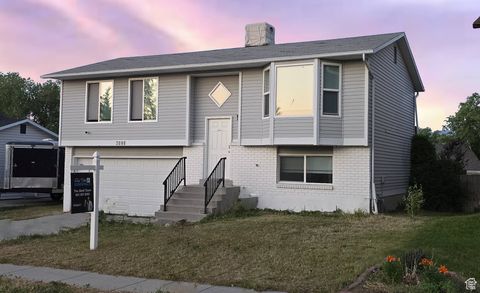
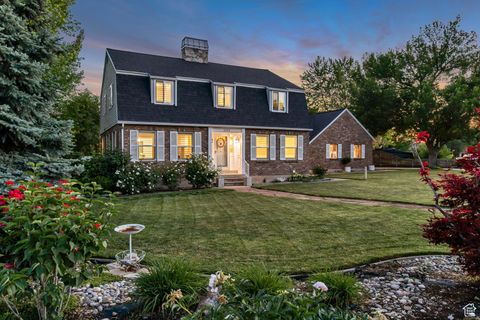
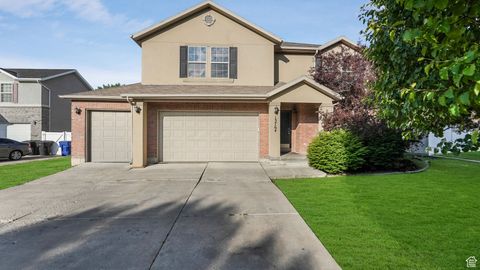
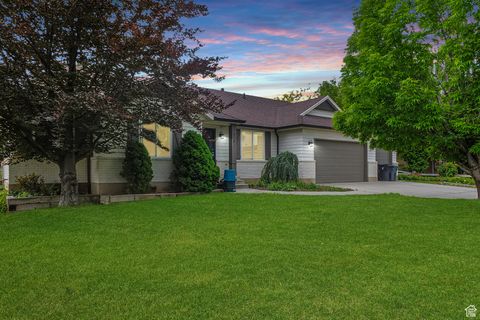
$420,000
5
bds
|
2
ba
|
2,790
sqft
|
built
1947
150 S 450 E, Clearfield, UT 84015
$-384
Cash flow
-4.8%
Cash-on-Cash Return
4.6%
Cap rate
0.6%
Rent to Value Ratio
Active
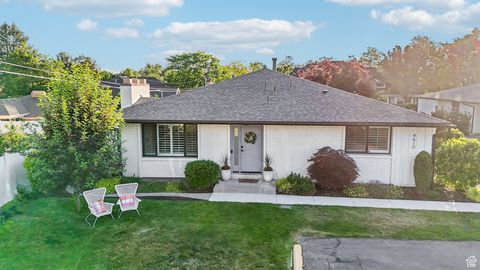
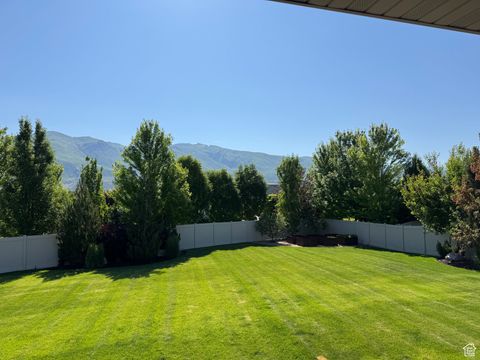
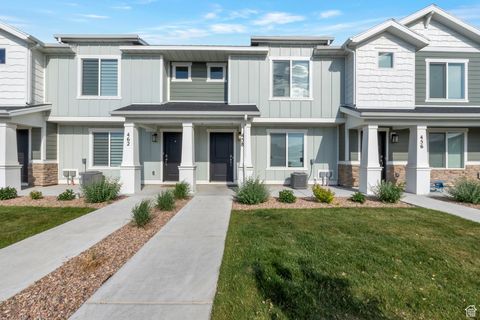
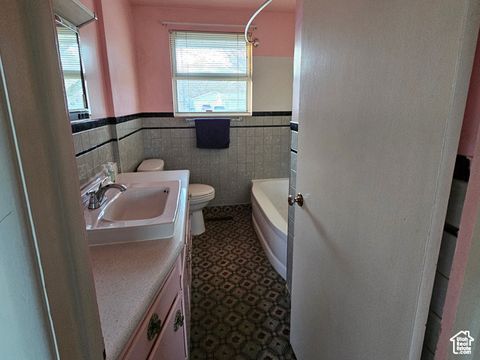
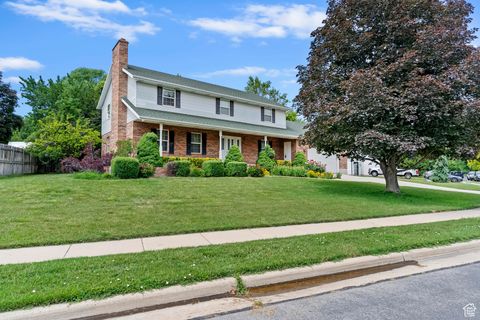
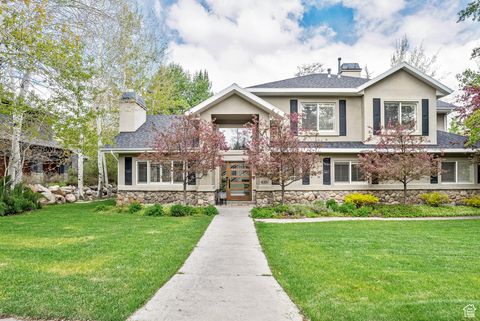
$399,000
4
bds
|
2
ba
|
2,116
sqft
|
built
1949
170 W 400 S, Springville, UT 84663
$-462
Cash flow
-6.0%
Cash-on-Cash Return
4.3%
Cap rate
0.6%
Rent to Value Ratio
5,598 out of 11,034 properties for sale in Utah
Limited Results Shown
Create a free account, or log in to reveal all property listings and enjoy the complete experience.
Active
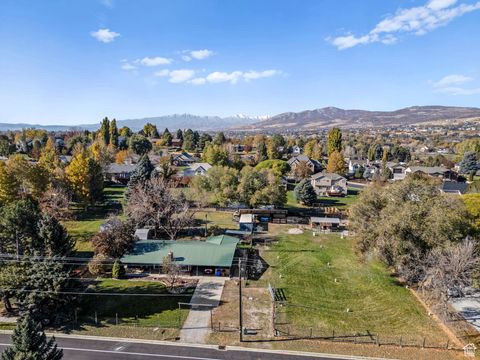
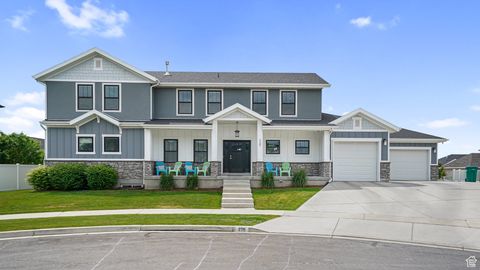
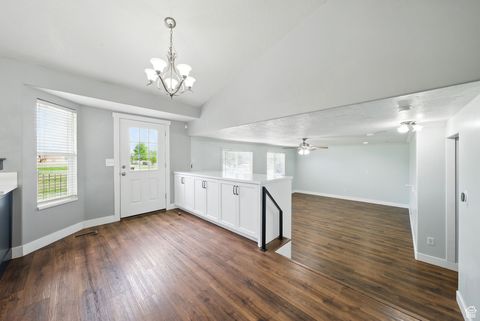
$800,000
3
bds
|
3
ba
|
2,826
sqft
|
built
1976
4610 S Locust Ln, Holladay, UT 84117
$-2,306
Cash flow
-15.0%
Cash-on-Cash Return
2.2%
Cap rate
0.4%
Rent to Value Ratio
Active
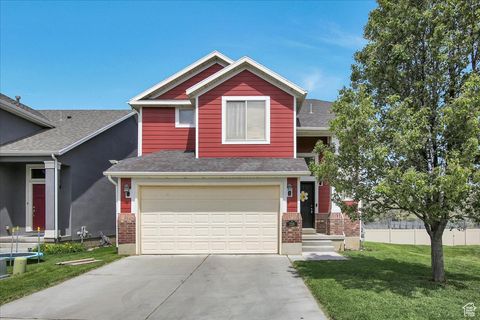
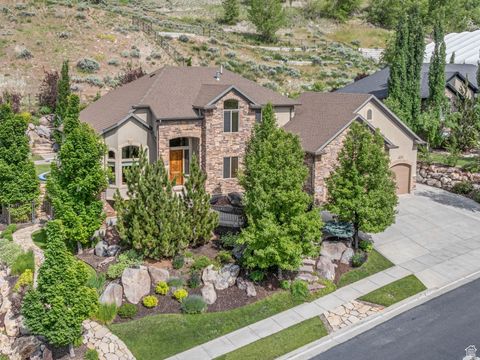
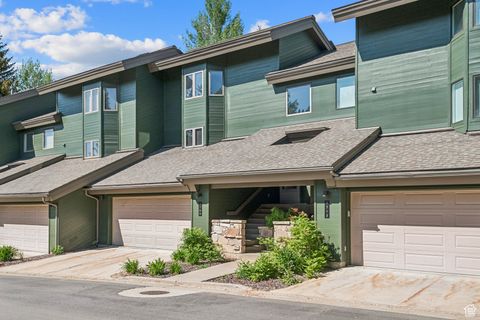
$795,000
3
bds
|
3
ba
|
2,840
sqft
|
built
1965
1983 E 1700 S, Salt Lake City, UT 84108
$-1,002
Cash flow
-6.6%
Cash-on-Cash Return
4.2%
Cap rate
0.6%
Rent to Value Ratio
Active
$444,900
5
bds
|
4
ba
|
2,274
sqft
|
built
1998
755 E 890 N, Tooele, UT 84074
$-793
Cash flow
-9.3%
Cash-on-Cash Return
3.5%
Cap rate
0.5%
Rent to Value Ratio
Active
$475,000
6
bds
|
3
ba
|
2,600
sqft
|
built
1979
3369 N 425 E, North Ogden, UT 84414
$-979
Cash flow
-10.8%
Cash-on-Cash Return
3.2%
Cap rate
0.5%
Rent to Value Ratio
Active
$1,397,000
5
bds
|
4
ba
|
4,962
sqft
|
built
2016
336 S 1400 W, Farmington, UT 84025
$-4,025
Cash flow
-15.0%
Cash-on-Cash Return
2.2%
Cap rate
0.3%
Rent to Value Ratio

Active
$629,900
4
bds
|
3
ba
|
2,381
sqft
|
built
2005
2167 E Eagle Chase Dr, Draper, UT 84020
$-1,613
Cash flow
-13.4%
Cash-on-Cash Return
2.6%
Cap rate
0.4%
Rent to Value Ratio
Active
$899,000
4
bds
|
2
ba
|
2,104
sqft
|
built
1965
222 S 800 E, Alpine, UT 84004
$-2,588
Cash flow
-15.0%
Cash-on-Cash Return
2.2%
Cap rate
0.3%
Rent to Value Ratio

Active
$787,000
5
bds
|
3
ba
|
2,464
sqft
|
built
1927
525 E St, Salt Lake City, UT 84103
$-1,639
Cash flow
-10.9%
Cash-on-Cash Return
3.2%
Cap rate
0.4%
Rent to Value Ratio
Active
$499,900
4
bds
|
4
ba
|
2,401
sqft
|
built
2011
2118 W Foxwood St, West Haven, UT 84401
$-928
Cash flow
-9.7%
Cash-on-Cash Return
3.5%
Cap rate
0.5%
Rent to Value Ratio
Active
$485,000
3
bds
|
3
ba
|
2,660
sqft
|
built
2006
696 S Clearwater Falls Dr, Layton, UT 84041
$-1,209
Cash flow
-13.0%
Cash-on-Cash Return
2.7%
Cap rate
0.5%
Rent to Value Ratio

Active
$450,000
3
bds
|
1
ba
|
934
sqft
|
built
1910
158 N 900 W, Provo, UT 84601
$-1,304
Cash flow
-15.1%
Cash-on-Cash Return
2.2%
Cap rate
0.3%
Rent to Value Ratio
Active
$424,900
3
bds
|
3
ba
|
1,341
sqft
|
built
2022
458 N Trident Dr, Saratoga Springs, UT 84045
$-1,010
Cash flow
-12.4%
Cash-on-Cash Return
2.8%
Cap rate
0.4%
Rent to Value Ratio
Active
$1,349,999
7
bds
|
6
ba
|
5,250
sqft
|
built
2016
225 W 1390 N, Orem, UT 84057
$-4,719
Cash flow
-18.2%
Cash-on-Cash Return
1.5%
Cap rate
0.2%
Rent to Value Ratio
Active
$1,590,000
8
bds
|
5
ba
|
5,700
sqft
|
built
2007
673 Parkway Dr, North Salt Lake, UT 84054
$-4,065
Cash flow
-13.3%
Cash-on-Cash Return
2.6%
Cap rate
0.4%
Rent to Value Ratio
Active
$459,900
4
bds
|
2
ba
|
1,415
sqft
|
built
1987
6523 S Purple Sage Dr, West Jordan, UT 84081
$-927
Cash flow
-10.5%
Cash-on-Cash Return
3.3%
Cap rate
0.5%
Rent to Value Ratio
Active
$439,000
4
bds
|
2
ba
|
1,824
sqft
|
built
1959
385 E 300 N, Spanish Fork, UT 84660
$-711
Cash flow
-8.5%
Cash-on-Cash Return
3.7%
Cap rate
0.5%
Rent to Value Ratio
Active
$648,000
5
bds
|
4
ba
|
2,711
sqft
|
built
2002
1826 N 2600 W, Lehi, UT 84043
$-1,529
Cash flow
-12.3%
Cash-on-Cash Return
2.8%
Cap rate
0.4%
Rent to Value Ratio
Active
$420,000
5
bds
|
2
ba
|
2,790
sqft
|
built
1947
150 S 450 E, Clearfield, UT 84015
$-384
Cash flow
-4.8%
Cash-on-Cash Return
4.6%
Cap rate
0.6%
Rent to Value Ratio
Active
$2,385,000
3
bds
|
3
ba
|
2,527
sqft
|
built
1982
1709 Lakeside Cir, Park City, UT 84060
$-12,033
Cash flow
-26.3%
Cash-on-Cash Return
-0.4%
Cap rate
0.2%
Rent to Value Ratio
Active
$749,900
6
bds
|
4
ba
|
3,848
sqft
|
built
1979
1323 Fairway Cir, Farmington, UT 84025
$-1,836
Cash flow
-12.8%
Cash-on-Cash Return
2.7%
Cap rate
0.4%
Rent to Value Ratio
Active
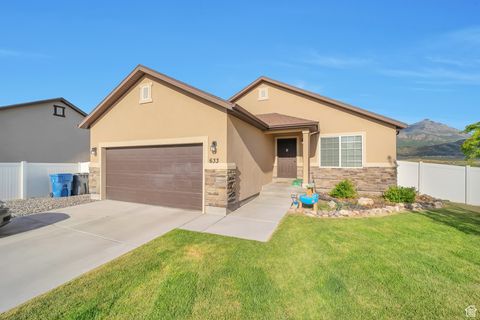
$465,000
3
bds
|
2
ba
|
2,172
sqft
|
built
2016
633 Little Rock Dr, Santaquin, UT 84655
$-1,143
Cash flow
-12.8%
Cash-on-Cash Return
2.7%
Cap rate
0.4%
Rent to Value Ratio
Active
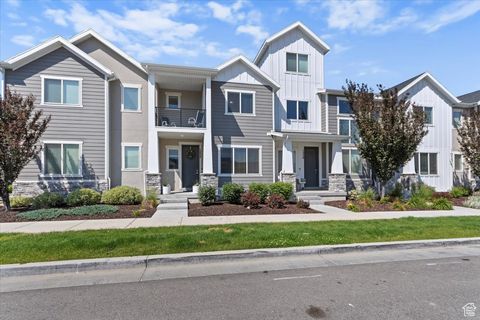
$489,000
4
bds
|
4
ba
|
2,298
sqft
|
built
2020
1252 W Cinch Way, Bluffdale, UT 84065
$-1,218
Cash flow
-13.0%
Cash-on-Cash Return
2.7%
Cap rate
0.4%
Rent to Value Ratio
Active
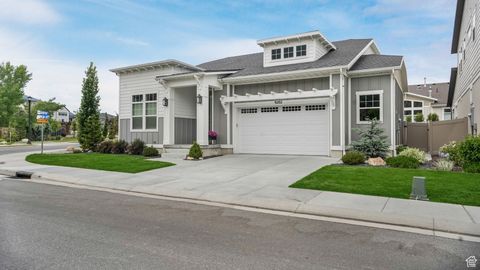
$1,175,000
3
bds
|
3
ba
|
3,105
sqft
|
built
2020
9202 S Renoir Ln, Cottonwood Heights, UT 84093
$-4,486
Cash flow
-19.9%
Cash-on-Cash Return
1.1%
Cap rate
0.2%
Rent to Value Ratio

Active
$529,000
4
bds
|
2
ba
|
2,288
sqft
|
built
1956
318 W La Salle Dr, Midvale, UT 84047
$-979
Cash flow
-9.7%
Cash-on-Cash Return
3.5%
Cap rate
0.5%
Rent to Value Ratio

Active
$599,900
3
bds
|
3
ba
|
3,019
sqft
|
built
1960
3243 S 200 W, Bountiful, UT 84010
$-1,572
Cash flow
-13.7%
Cash-on-Cash Return
2.5%
Cap rate
0.4%
Rent to Value Ratio
Active
$750,000
6
bds
|
4
ba
|
5,461
sqft
|
built
2005
13764 S Rosie Ln, Herriman, UT 84096
$-1,065
Cash flow
-7.4%
Cash-on-Cash Return
4.0%
Cap rate
0.5%
Rent to Value Ratio
Active
$759,900
6
bds
|
4
ba
|
4,050
sqft
|
built
1978
1356 Fairway Cir, Farmington, UT 84025
$-1,192
Cash flow
-8.2%
Cash-on-Cash Return
3.8%
Cap rate
0.5%
Rent to Value Ratio
Active
$399,000
4
bds
|
2
ba
|
2,116
sqft
|
built
1949
170 W 400 S, Springville, UT 84663
$-462
Cash flow
-6.0%
Cash-on-Cash Return
4.3%
Cap rate
0.6%
Rent to Value Ratio

Active
$699,900
5
bds
|
3
ba
|
3,300
sqft
|
built
1997
808 E 3400 N, Ogden, UT 84414
$-1,501
Cash flow
-11.2%
Cash-on-Cash Return
3.1%
Cap rate
0.4%
Rent to Value Ratio

Active
$634,900
3
bds
|
3
ba
|
2,813
sqft
|
built
2003
856 S 1580 W, Lehi, UT 84043
$-1,498
Cash flow
-12.3%
Cash-on-Cash Return
2.8%
Cap rate
0.4%
Rent to Value Ratio
Active
$824,900
9
bds
|
4
ba
|
4,360
sqft
|
built
2004
1472 S Via La Costa Way, Kaysville, UT 84037
$-2,072
Cash flow
-13.1%
Cash-on-Cash Return
2.7%
Cap rate
0.4%
Rent to Value Ratio
Active
$584,900
5
bds
|
3
ba
|
2,416
sqft
|
built
1978
540 E 990 N, Pleasant Grove, UT 84062
$-1,433
Cash flow
-12.8%
Cash-on-Cash Return
2.7%
Cap rate
0.4%
Rent to Value Ratio
Active
$849,900
4
bds
|
3
ba
|
3,500
sqft
|
built
2001
2101 W 325 S, Mapleton, UT 84664
$-1,873
Cash flow
-11.5%
Cash-on-Cash Return
3.0%
Cap rate
0.4%
Rent to Value Ratio

Active
$1,250,000
5
bds
|
3
ba
|
4,349
sqft
|
built
2018
2208 E Snow Blossom Way, Draper, UT 84020
$-3,789
Cash flow
-15.8%
Cash-on-Cash Return
2.0%
Cap rate
0.3%
Rent to Value Ratio
Active
$1,295,000
6
bds
|
4
ba
|
3,970
sqft
|
built
1973
975 E Canyon Breeze Ln, Draper, UT 84020
$-4,779
Cash flow
-19.3%
Cash-on-Cash Return
1.3%
Cap rate
0.2%
Rent to Value Ratio
Active
$2,900,000
4
bds
|
3
ba
|
2,850
sqft
|
built
1995
4381 Willow Creek Dr, Park City, UT 84098
$-9,830
Cash flow
-17.7%
Cash-on-Cash Return
1.6%
Cap rate
0.2%
Rent to Value Ratio

Active
$1,495,000
5
bds
|
5
ba
|
5,723
sqft
|
built
1997
4715 S 1500 E, Ogden, UT 84403
$-4,130
Cash flow
-14.4%
Cash-on-Cash Return
2.4%
Cap rate
0.3%
Rent to Value Ratio

Active
$700,000
5
bds
|
4
ba
|
3,619
sqft
|
built
2020
4827 N Sage Park Dr, Eagle Mountain, UT 84005
$-1,805
Cash flow
-13.5%
Cash-on-Cash Return
2.6%
Cap rate
0.4%
Rent to Value Ratio

Active
$985,000
3
bds
|
3
ba
|
3,017
sqft
|
built
1898
78 S St, Salt Lake City, UT 84103
$-2,232
Cash flow
-11.8%
Cash-on-Cash Return
3.0%
Cap rate
0.4%
Rent to Value Ratio

Active
$644,000
4
bds
|
4
ba
|
2,062
sqft
|
built
1988
211 S 860 E, Orem, UT 84097
$-1,990
Cash flow
-16.1%
Cash-on-Cash Return
2.0%
Cap rate
0.3%
Rent to Value Ratio