Utah Investment Properties for Sale
Browse homes for sale and investment properties in Utah. Refine your search by price, property type, or more.
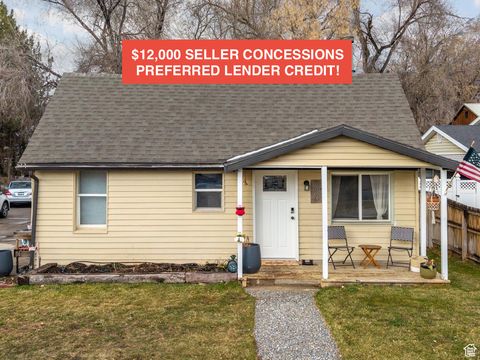
Best cash flowing properties in Utah
Active
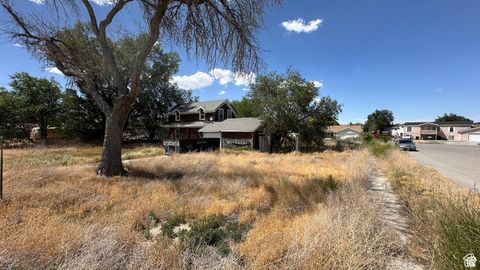
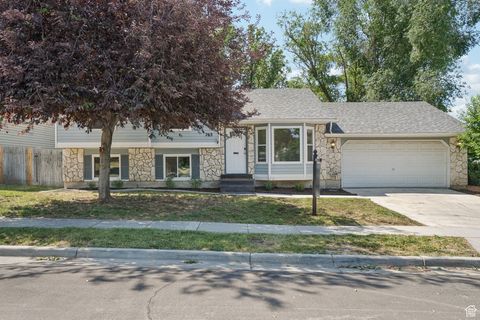
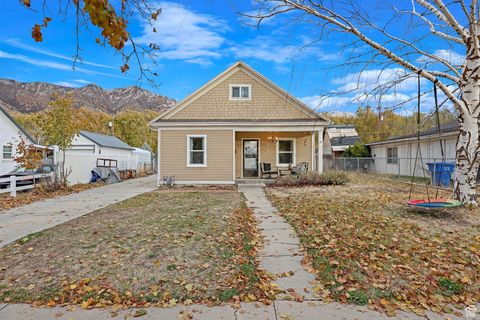
$230,000
3
bds
|
2
ba
|
1,943
sqft
|
built
1925
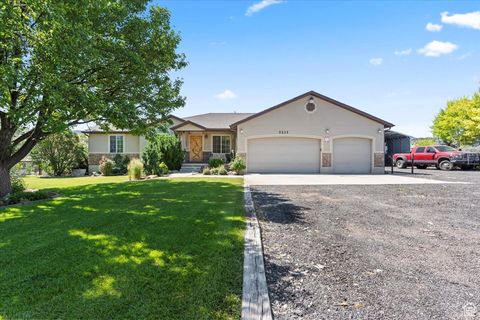
637 E Main St, Grantsville, UT 84029
$3
Cash flow
0.1%
Cash-on-Cash Return
5.7%
Cap rate
0.8%
Rent to Value Ratio
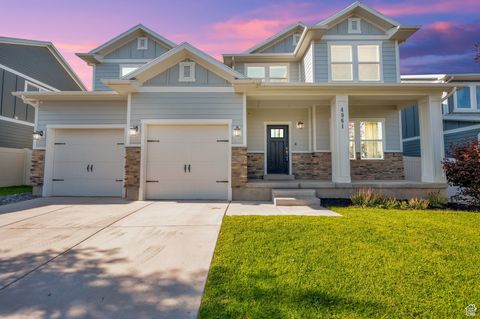
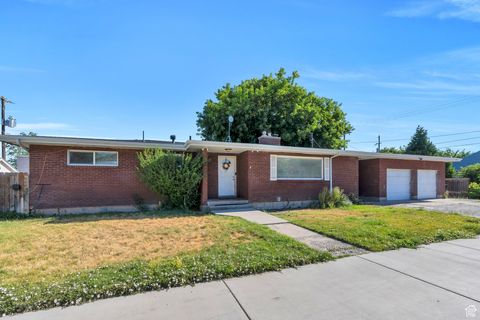
Active
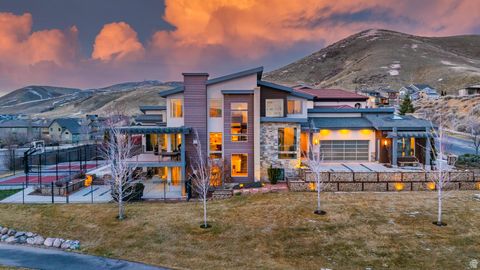
$600,000
6
bds
|
4
ba
|
3,662
sqft
|
built
2015
4961 E Oakwood Dr, Eagle Mountain, UT 84005
$-389
Cash flow
-3.4%
Cash-on-Cash Return
4.9%
Cap rate
0.7%
Rent to Value Ratio
5,598 out of 11,034 properties for sale in Utah
Limited Results Shown
Create a free account, or log in to reveal all property listings and enjoy the complete experience.
Active
$600,000
6
bds
|
4
ba
|
3,662
sqft
|
built
2015
4961 E Oakwood Dr, Eagle Mountain, UT 84005
$-389
Cash flow
-3.4%
Cash-on-Cash Return
4.9%
Cap rate
0.7%
Rent to Value Ratio
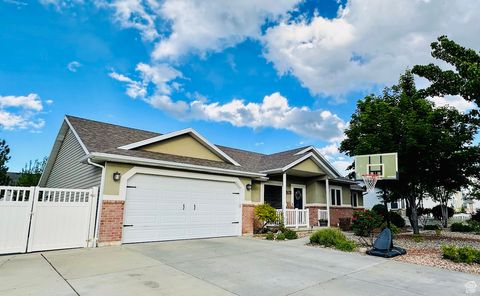
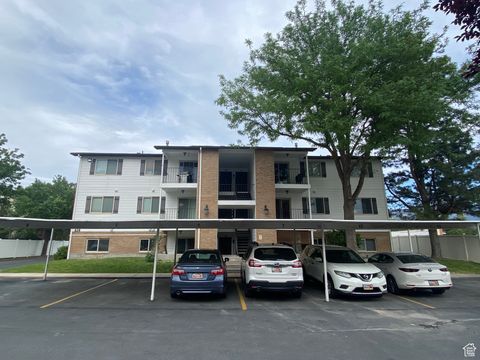
Active
$659,900
5
bds
|
3
ba
|
3,188
sqft
|
built
1997
8675 S Pebblecreek Rd, West Jordan, UT 84081
$-1,440
Cash flow
-11.4%
Cash-on-Cash Return
3.1%
Cap rate
0.4%
Rent to Value Ratio
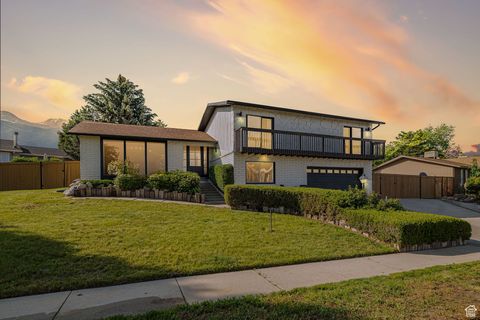
Active
$1,100,000
5
bds
|
4
ba
|
3,250
sqft
|
built
1973
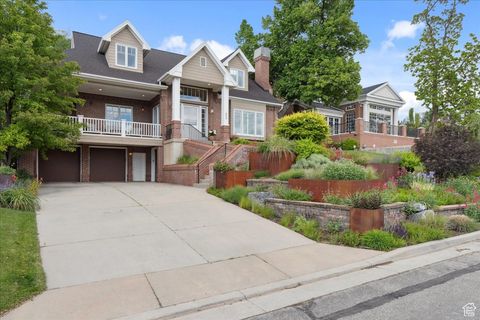
2616 E Grandview Dr, Sandy, UT 84092
$-1,658
Cash flow
-7.9%
Cash-on-Cash Return
3.9%
Cap rate
0.5%
Rent to Value Ratio
Active
$507,500
4
bds
|
2
ba
|
1,799
sqft
|
built
1991
763 W Windflower Ln, Sandy, UT 84070
$-877
Cash flow
-9.0%
Cash-on-Cash Return
3.6%
Cap rate
0.5%
Rent to Value Ratio
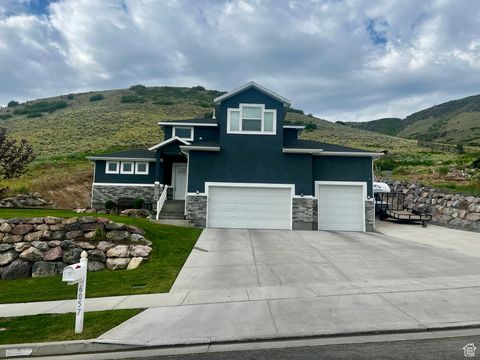
Active
$1,850,000
7
bds
|
7
ba
|
6,154
sqft
|
built
2013
4601 N Toscana Hills Dr, Lehi, UT 84043
$-6,865
Cash flow
-19.4%
Cash-on-Cash Return
1.2%
Cap rate
0.2%
Rent to Value Ratio
Active
$459,900
4
bds
|
2
ba
|
1,826
sqft
|
built
1971
6770 W 3860 S, West Valley City, UT 84128
$-871
Cash flow
-9.9%
Cash-on-Cash Return
3.4%
Cap rate
0.5%
Rent to Value Ratio
Active
$449,900
3
bds
|
1
ba
|
1,303
sqft
|
built
1986
3683 W Christy Ann Dr, Taylorsville, UT 84129
$-1,215
Cash flow
-14.1%
Cash-on-Cash Return
2.4%
Cap rate
0.4%
Rent to Value Ratio
Active
$335,000
3
bds
|
1
ba
|
1,248
sqft
|
built
1918
330 N 100 W, Brigham City, UT 84302
$-439
Cash flow
-6.8%
Cash-on-Cash Return
4.1%
Cap rate
0.5%
Rent to Value Ratio
Active
$469,000
4
bds
|
2
ba
|
1,920
sqft
|
built
1950
1655 S Main St, Orem, UT 84058
$-1,050
Cash flow
-11.7%
Cash-on-Cash Return
3.0%
Cap rate
0.4%
Rent to Value Ratio
Active
$385,900
3
bds
|
2
ba
|
1,399
sqft
|
built
2020
54 N Heading Row, Saratoga Springs, UT 84045
$-819
Cash flow
-11.1%
Cash-on-Cash Return
3.1%
Cap rate
0.5%
Rent to Value Ratio
Active
$498,000
4
bds
|
2
ba
|
2,012
sqft
|
built
1955
448 N 900 W, Salt Lake City, UT 84116
$-708
Cash flow
-7.4%
Cash-on-Cash Return
4.0%
Cap rate
0.5%
Rent to Value Ratio
Active
$2,150,000
5
bds
|
5
ba
|
7,208
sqft
|
built
1988
2058 E Oak Manor Dr, Sandy, UT 84092
$-8,004
Cash flow
-19.4%
Cash-on-Cash Return
1.2%
Cap rate
0.2%
Rent to Value Ratio
Active
$390,000
4
bds
|
2
ba
|
2,176
sqft
|
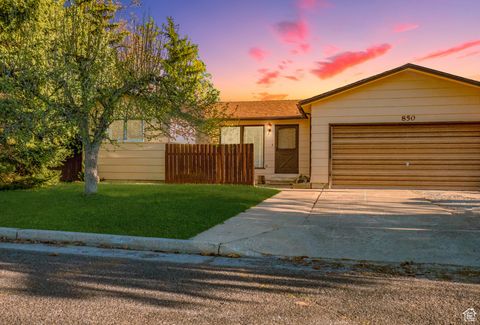
built
1979
850 W 370 S, Logan, UT 84321
$-476
Cash flow
-6.4%
Cash-on-Cash Return
4.2%
Cap rate
0.6%
Rent to Value Ratio
Active
$514,900
4
bds
|
4
ba
|
2,354
sqft
|
built
2007
930 N 980 W, Orem, UT 84057
$-1,562
Cash flow
-15.8%
Cash-on-Cash Return
2.0%
Cap rate
0.4%
Rent to Value Ratio
Active
$499,950
4
bds
|
4
ba
|
2,164
sqft
|
built
1984
9152 S Cripple Creek Cir, West Jordan, UT 84088
$-967
Cash flow
-10.1%
Cash-on-Cash Return
3.4%
Cap rate
0.5%
Rent to Value Ratio
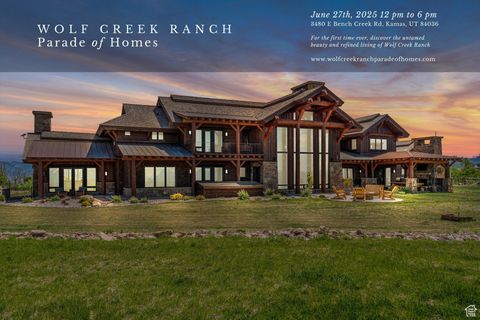
Active
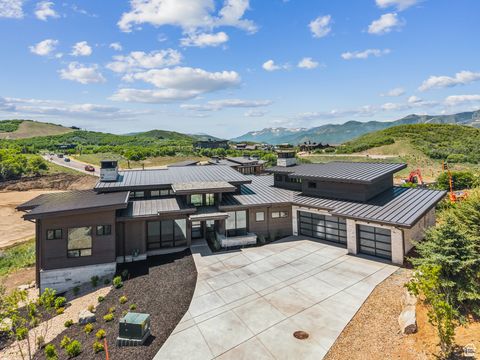
$6,295,000
5
bds
|
7
ba
|
6,127
sqft
|
built
2024
2179 E Adventure Way, Kamas, UT 84036
$-25,572
Cash flow
-21.2%
Cash-on-Cash Return
0.8%
Cap rate
0.1%
Rent to Value Ratio
Active
$375,000
2
bds
|
2
ba
|
977
sqft
|
built
1931
330 W 100 S, Springville, UT 84663
$-795
Cash flow
-11.1%
Cash-on-Cash Return
3.1%
Cap rate
0.4%
Rent to Value Ratio
Active
$550,000
6
bds
|
2
ba
|
3,160
sqft
|
built
1956
197 E Utah Ave, Payson, UT 84651
$-1,415
Cash flow
-13.4%
Cash-on-Cash Return
2.6%
Cap rate
0.4%
Rent to Value Ratio
Active
$298,900
2
bds
|
1
ba
|
887
sqft
|
built
1986
838 E Bristle Pine Pl, Salt Lake City, UT 84106
$-621
Cash flow
-10.8%
Cash-on-Cash Return
3.2%
Cap rate
0.5%
Rent to Value Ratio
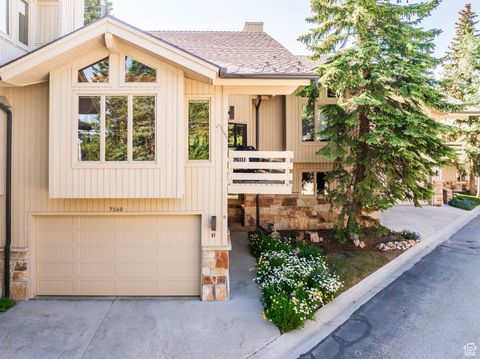
Active
$2,750,000
3
bds
|
4
ba
|
2,100
sqft
|
built
1985
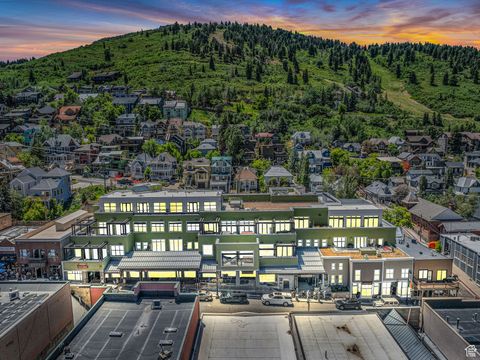
7560 Ridge Dr, Park City, UT 84060
$-11,377
Cash flow
-21.6%
Cash-on-Cash Return
0.7%
Cap rate
0.2%
Rent to Value Ratio
Active
$364,999
3
bds
|
3
ba
|
1,655
sqft
|
built
2014
206 N 750 E, Vineyard, UT 84059
$-933
Cash flow
-13.3%
Cash-on-Cash Return
2.6%
Cap rate
0.5%
Rent to Value Ratio
Active
$12,000,000
8
bds
|
11
ba
|
13,591
sqft
|
built
2018
1975 N Westward Ho Rd, Heber City, UT 84032
$-59,997
Cash flow
-26.1%
Cash-on-Cash Return
-0.3%
Cap rate
0.1%
Rent to Value Ratio
Active
$625,800
3
bds
|
2
ba
|
2,980
sqft
|
built
2016
63 N Canyon Maple Rd, Vineyard, UT 84059
$-1,417
Cash flow
-11.8%
Cash-on-Cash Return
3.0%
Cap rate
0.4%
Rent to Value Ratio

Active
$610,000
4
bds
|
3
ba
|
2,740
sqft
|
built
1997
1403 Gleneagles Dr, Syracuse, UT 84075
$-1,318
Cash flow
-11.3%
Cash-on-Cash Return
3.1%
Cap rate
0.4%
Rent to Value Ratio
Active
$879,999
6
bds
|
4
ba
|
4,390
sqft
|
built
2017
6057 W Herriman View Way, Herriman, UT 84096
$-1,813
Cash flow
-10.7%
Cash-on-Cash Return
3.2%
Cap rate
0.5%
Rent to Value Ratio
Active
$375,000
3
bds
|
3
ba
|
1,592
sqft
|
built
2019
382 E 1850 N, North Ogden, UT 84414
$-799
Cash flow
-11.1%
Cash-on-Cash Return
3.1%
Cap rate
0.5%
Rent to Value Ratio
Active
$500,000
4
bds
|
2
ba
|
1,828
sqft
|
built
1980
6568 S 5180 W, West Jordan, UT 84081
$-1,467
Cash flow
-15.3%
Cash-on-Cash Return
2.2%
Cap rate
0.3%
Rent to Value Ratio
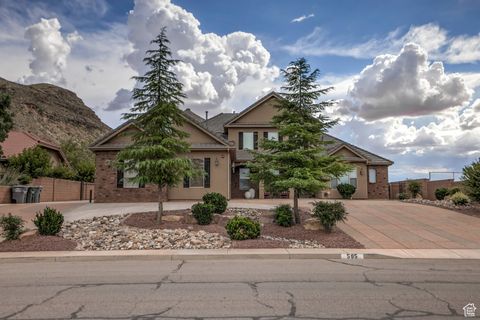
Active
$1,050,000
6
bds
|
4
ba
|
3,847
sqft
|
built
2005
595 W 2050 S, Hurricane, UT 84737
$-2,050
Cash flow
-10.2%
Cash-on-Cash Return
3.3%
Cap rate
0.5%
Rent to Value Ratio
Active
$1,775,000
2
bds
|
3
ba
|
3,106
sqft
|
built
1999
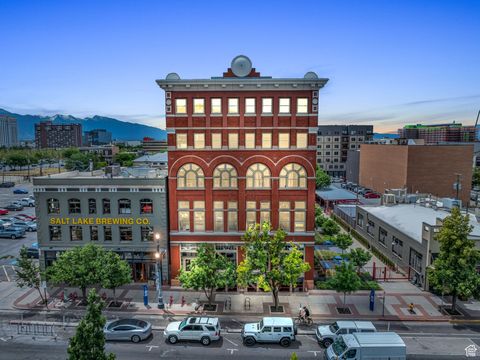
159 W Broadway, Salt Lake City, UT 84101
$-6,777
Cash flow
-19.9%
Cash-on-Cash Return
1.1%
Cap rate
0.3%
Rent to Value Ratio
Active
$1,150,000
5
bds
|
4
ba
|
2,928
sqft
|
built
2002
7217 W Mc Cuiston Ave, Herriman, UT 84096
$-4,439
Cash flow
-20.1%
Cash-on-Cash Return
1.0%
Cap rate
0.2%
Rent to Value Ratio
Active
$5,000,000
4
bds
|
5
ba
|
3,872
sqft
|
built
2015
333 Main St, Park City, UT 84060
$-24,175
Cash flow
-25.2%
Cash-on-Cash Return
-0.1%
Cap rate
0.1%
Rent to Value Ratio
Active
$2,300,000
4
bds
|
5
ba
|
4,588
sqft
|
built
1996
377 E 12th Ave, Salt Lake City, UT 84103
$-7,217
Cash flow
-16.4%
Cash-on-Cash Return
1.9%
Cap rate
0.3%
Rent to Value Ratio
Active
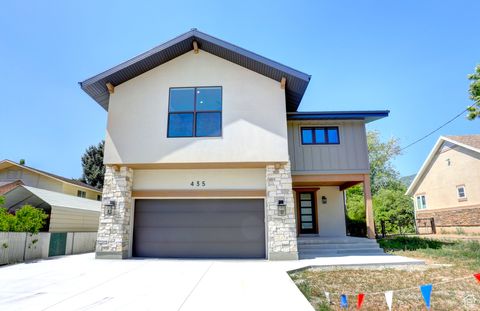
$998,800
5
bds
|
4
ba
|
4,270
sqft
|
built
2025
435 E Maple St, Mapleton, UT 84664
$-2,153
Cash flow
-11.2%
Cash-on-Cash Return
3.1%
Cap rate
0.4%
Rent to Value Ratio
Active
$1,059,500
5
bds
|
4
ba
|
5,809
sqft
|
built
1997
1009 W Park Palisade Dr, South Jordan, UT 84095
$-631
Cash flow
-3.1%
Cash-on-Cash Return
5.0%
Cap rate
0.7%
Rent to Value Ratio
Active
$230,000
3
bds
|
2
ba
|
1,943
sqft
|
built
1925
637 E Main St, Grantsville, UT 84029
$3
Cash flow
0.1%
Cash-on-Cash Return
5.7%
Cap rate
0.8%
Rent to Value Ratio

Active
$1,095,000
4
bds
|
2
ba
|
2,000
sqft
|
built
1950
2487 S Beverly St, Salt Lake City, UT 84106
$-3,415
Cash flow
-16.3%
Cash-on-Cash Return
1.9%
Cap rate
0.3%
Rent to Value Ratio

Active
$399,500
2
bds
|
2
ba
|
1,117
sqft
|
built
2005
164 E Spencer Peak Way, Draper, UT 84020
$-1,188
Cash flow
-15.5%
Cash-on-Cash Return
2.1%
Cap rate
0.4%
Rent to Value Ratio
Active
$499,998
5
bds
|
3
ba
|
2,804
sqft
|
built
2018
7690 N Red Oak Rd, Eagle Mountain, UT 84005
$-768
Cash flow
-8.0%
Cash-on-Cash Return
3.8%
Cap rate
0.5%
Rent to Value Ratio
Active
$684,899
6
bds
|
3
ba
|
3,103
sqft
|
built
1999
619 W 225 S, Layton, UT 84041
$-2,100
Cash flow
-16.0%
Cash-on-Cash Return
2.0%
Cap rate
0.3%
Rent to Value Ratio
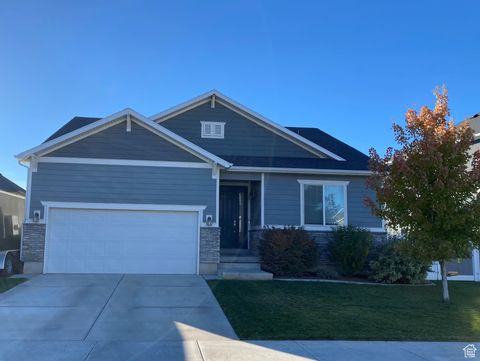
Active
$599,890
4
bds
|
4
ba
|
2,928
sqft
|
built
2021
1526 W Stone Gate Dr, Saratoga Springs, UT 84045
$-1,250
Cash flow
-10.9%
Cash-on-Cash Return
3.2%
Cap rate
0.4%
Rent to Value Ratio