Utah Investment Properties for Sale
Browse homes for sale and investment properties in Utah. Refine your search by price, property type, or more.
Best cash flowing properties in Utah
Pending
$224,900
1
bds
|
1
ba
|
1,125
sqft
|
built
2021
470 W 15 S, Providence, UT 84332
$-450
Cash flow
-10.4%
Cash-on-Cash Return
3.3%
Cap rate
0.6%
Rent to Value Ratio
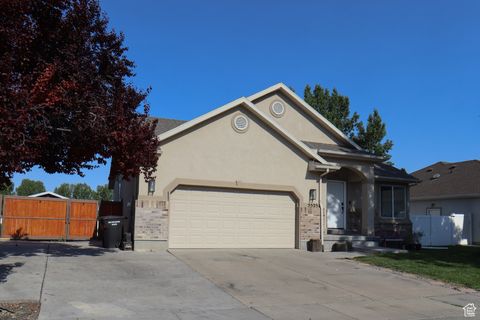
Active
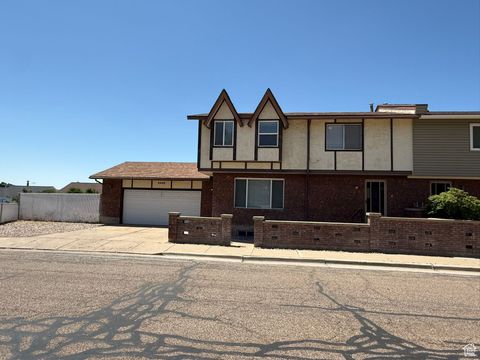
$399,900
3
bds
|
3
ba
|
2,152
sqft
|
built
1977
5509 S 2150 W, Roy, UT 84067
$-707
Cash flow
-9.2%
Cash-on-Cash Return
3.6%
Cap rate
0.5%
Rent to Value Ratio
6,421 out of 10,106 properties for sale in Utah
Limited Results Shown
Create a free account, or log in to reveal all property listings and enjoy the complete experience.

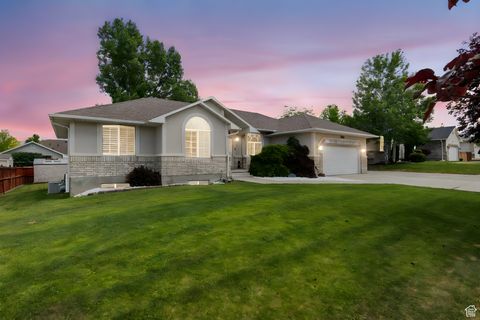
Active
$615,000
5
bds
|
3
ba
|
2,646
sqft
|
built
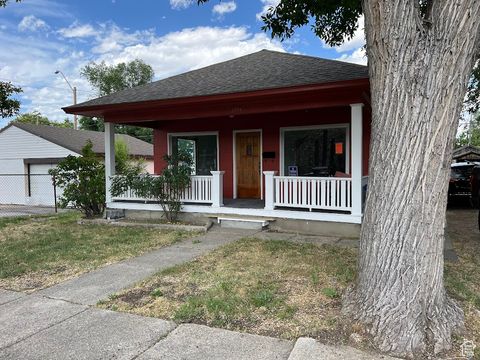
1954
720 N 1200 E, Provo, UT 84606
$-1,193
Cash flow
-10.1%
Cash-on-Cash Return
3.4%
Cap rate
0.5%
Rent to Value Ratio
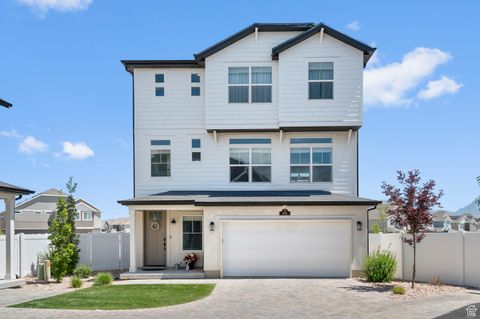
Active
$690,000
4
bds
|
3
ba
|
3,344
sqft
|
built
1998
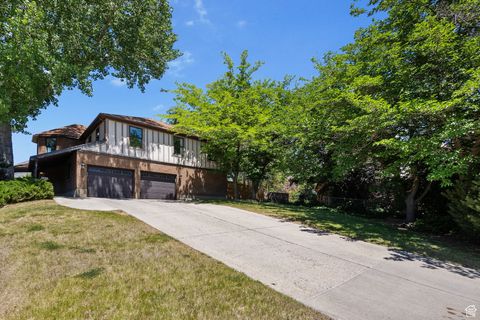
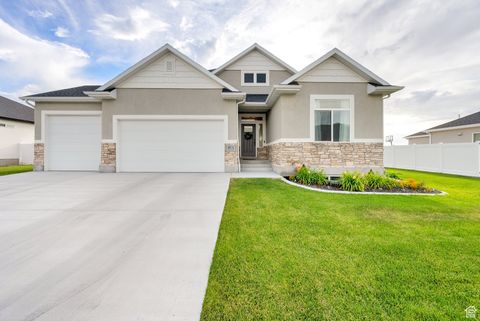
9353 S 4460 W, West Jordan, UT 84088
$-1,320
Cash flow
-10.0%
Cash-on-Cash Return
3.4%
Cap rate
0.5%
Rent to Value Ratio
Active
$544,900
3
bds
|
3
ba
|
2,220
sqft
|
built
2021
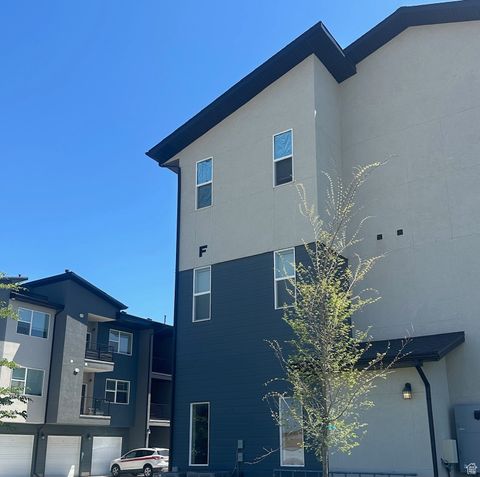
106 E Polaris Dr, Saratoga Springs, UT 84045
$-1,308
Cash flow
-12.5%
Cash-on-Cash Return
2.8%
Cap rate
0.4%
Rent to Value Ratio
Active
$1,125,000
6
bds
|
4
ba
|
4,721
sqft
|
built
1979
2673 E Toni Cir, Cottonwood Heights, UT 84121
$-2,676
Cash flow
-12.4%
Cash-on-Cash Return
2.8%
Cap rate
0.4%
Rent to Value Ratio
Active
$789,000
5
bds
|
3
ba
|
3,182
sqft
|
built
2000
4212 N Majors St, Eagle Mountain, UT 84005
$-2,177
Cash flow
-14.4%
Cash-on-Cash Return
2.4%
Cap rate
0.3%
Rent to Value Ratio

Active
$540,000
5
bds
|
2
ba
|
3,300
sqft
|
built
2004
2017 E Lodge Pole Dr, Eagle Mountain, UT 84005
$-1,146
Cash flow
-11.1%
Cash-on-Cash Return
3.1%
Cap rate
0.4%
Rent to Value Ratio

Active
$550,000
5
bds
|
3
ba
|
3,493
sqft
|
built
2023
7215 N Clear Meadow Way, Eagle Mountain, UT 84005
$-1,334
Cash flow
-12.7%
Cash-on-Cash Return
2.8%
Cap rate
0.4%
Rent to Value Ratio

Active
$439,900
3
bds
|
3
ba
|
1,704
sqft
|
built
2003
9656 S Villa Springs Cv, Sandy, UT 84070
$-1,580
Cash flow
-18.7%
Cash-on-Cash Return
1.4%
Cap rate
0.3%
Rent to Value Ratio
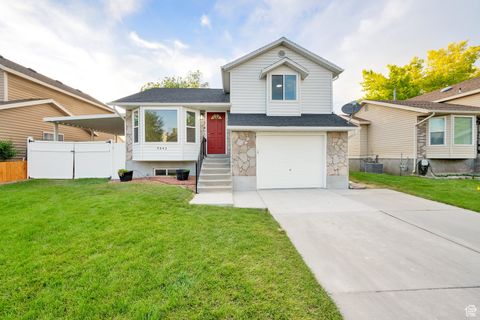
Active under contract
$385,000
5
bds
|
2
ba
|
2,070
sqft
|
built
1919
2859 S 9000 W, Magna, UT 84044
$-851
Cash flow
-11.5%
Cash-on-Cash Return
3.0%
Cap rate
0.4%
Rent to Value Ratio

Active
$590,000
4
bds
|
3
ba
|
1,650
sqft
|
built
1958
495 E Mary Rose Dr, Murray, UT 84107
$-1,493
Cash flow
-13.2%
Cash-on-Cash Return
2.6%
Cap rate
0.4%
Rent to Value Ratio
Active
$1,399,000
4
bds
|
3
ba
|
5,414
sqft
|
built
1997
1269 Alice Ln, Farmington, UT 84025
$-5,073
Cash flow
-18.9%
Cash-on-Cash Return
1.3%
Cap rate
0.2%
Rent to Value Ratio
Active
$625,000
3
bds
|
2
ba
|
3,491
sqft
|
built
2022
4951 N Stratford Dr, Tooele, UT 84074
$-1,362
Cash flow
-11.4%
Cash-on-Cash Return
3.1%
Cap rate
0.4%
Rent to Value Ratio

Active
$425,000
3
bds
|
2
ba
|
972
sqft
|
built
1909
234 E 100 S, Salt Lake City, UT 84111
$-1,133
Cash flow
-13.9%
Cash-on-Cash Return
2.5%
Cap rate
0.4%
Rent to Value Ratio
Active
$399,900
3
bds
|
3
ba
|
2,152
sqft
|
built
1977
5509 S 2150 W, Roy, UT 84067
$-707
Cash flow
-9.2%
Cash-on-Cash Return
3.6%
Cap rate
0.5%
Rent to Value Ratio
Pending
$730,000
4
bds
|
3
ba
|
3,237
sqft
|
built
2020
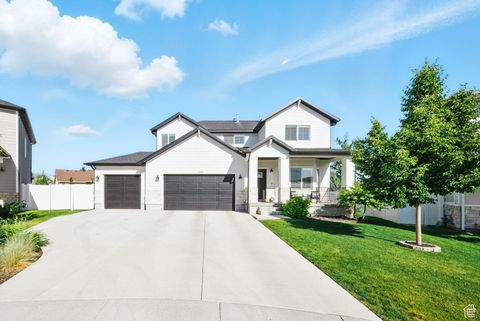
4888 W Transcendent Ct, West Jordan, UT 84081
$-2,036
Cash flow
-14.6%
Cash-on-Cash Return
2.3%
Cap rate
0.3%
Rent to Value Ratio
Active
$350,000
2
bds
|
1
ba
|
808
sqft
|
built
2008
1150 Wiltshire Dr, North Salt Lake, UT 84054
$-893
Cash flow
-13.3%
Cash-on-Cash Return
2.6%
Cap rate
0.5%
Rent to Value Ratio

Active
$545,000
2
bds
|
2
ba
|
3,680
sqft
|
built
2022
1298 E Salt Creek Peak, Eagle Mountain, UT 84005
$-1,314
Cash flow
-12.6%
Cash-on-Cash Return
2.8%
Cap rate
0.4%
Rent to Value Ratio
Active
$3,250,000
5
bds
|
5
ba
|
5,639
sqft
|
built
1977
5757 S Holladay Blvd, Holladay, UT 84121
$-11,040
Cash flow
-17.7%
Cash-on-Cash Return
1.6%
Cap rate
0.2%
Rent to Value Ratio

Active
$495,000
4
bds
|
2
ba
|
1,511
sqft
|
built
1948
1114 W Briarcliff Ave, Salt Lake City, UT 84116
$-984
Cash flow
-10.4%
Cash-on-Cash Return
3.3%
Cap rate
0.5%
Rent to Value Ratio
Active
$3,900,000
7
bds
|
9
ba
|
11,261
sqft
|
built
2018
1621 E Box Elder Cir, Alpine, UT 84004
$-16,446
Cash flow
-22.0%
Cash-on-Cash Return
0.6%
Cap rate
0.1%
Rent to Value Ratio
Active
$515,000
5
bds
|
3
ba
|
2,638
sqft
|
built
1999
868 Valley View Dr, Tooele, UT 84074
$-1,075
Cash flow
-10.9%
Cash-on-Cash Return
3.2%
Cap rate
0.4%
Rent to Value Ratio

Pending
$725,000
3
bds
|
3
ba
|
2,568
sqft
|
built
1988
1705 E Plata Way, Sandy, UT 84093
$-1,772
Cash flow
-12.8%
Cash-on-Cash Return
2.7%
Cap rate
0.4%
Rent to Value Ratio
Active
$1,450,000
7
bds
|
4
ba
|
4,056
sqft
|
built
2022
815 N 1310 E, Heber City, UT 84032
$-3,041
Cash flow
-10.9%
Cash-on-Cash Return
3.2%
Cap rate
0.4%
Rent to Value Ratio
Active
$689,900
3
bds
|
3
ba
|
2,634
sqft
|
built
2022
903 S 250 W, American Fork, UT 84003
$-1,745
Cash flow
-13.2%
Cash-on-Cash Return
2.6%
Cap rate
0.4%
Rent to Value Ratio

Active
$350,000
2
bds
|
1
ba
|
747
sqft
|
built
1943
1704 W 50 N, Provo, UT 84601
$-812
Cash flow
-12.1%
Cash-on-Cash Return
2.9%
Cap rate
0.4%
Rent to Value Ratio
Active
$570,000
6
bds
|
3
ba
|
2,626
sqft
|
built
2005
5525 Hampton Way, Stansbury Park, UT 84074
$-1,040
Cash flow
-9.5%
Cash-on-Cash Return
3.5%
Cap rate
0.5%
Rent to Value Ratio

Active
$488,000
3
bds
|
4
ba
|
2,258
sqft
|
built
2019
2717 W Redwick Ct, Salt Lake City, UT 84129
$-967
Cash flow
-10.3%
Cash-on-Cash Return
3.3%
Cap rate
0.5%
Rent to Value Ratio

Pending
$630,000
4
bds
|
4
ba
|
2,253
sqft
|
built
2017
10401 S Liffey Ln, South Jordan, UT 84009
$-886
Cash flow
-7.3%
Cash-on-Cash Return
4.0%
Cap rate
0.6%
Rent to Value Ratio

Active
$849,900
6
bds
|
4
ba
|
3,804
sqft
|
built
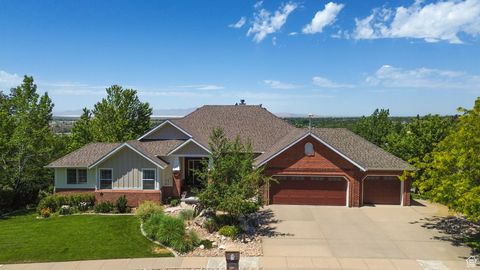
1995
5077 W 11000 N, Highland, UT 84003
$-2,272
Cash flow
-13.9%
Cash-on-Cash Return
2.5%
Cap rate
0.3%
Rent to Value Ratio
Pending
$465,000
4
bds
|
2
ba
|
1,479
sqft
|
built
1989
3042 W 8565 S, West Jordan, UT 84088
$-1,261
Cash flow
-14.1%
Cash-on-Cash Return
2.4%
Cap rate
0.3%
Rent to Value Ratio
Pending
$224,900
1
bds
|
1
ba
|
1,125
sqft
|
built
2021
470 W 15 S, Providence, UT 84332
$-450
Cash flow
-10.4%
Cash-on-Cash Return
3.3%
Cap rate
0.6%
Rent to Value Ratio

Pending
$545,000
4
bds
|
3
ba
|
1,504
sqft
|
built
2000
1410 W 50 S, Lehi, UT 84043
$-1,361
Cash flow
-13.0%
Cash-on-Cash Return
2.7%
Cap rate
0.4%
Rent to Value Ratio
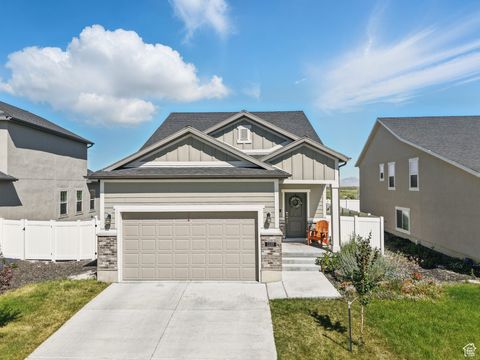
Active
$485,000
3
bds
|
3
ba
|
2,440
sqft
|
built
2020
1110 W Osprey Dr, Grantsville, UT 84074
$-827
Cash flow
-8.9%
Cash-on-Cash Return
3.6%
Cap rate
0.5%
Rent to Value Ratio

Active
$336,900
3
bds
|
2
ba
|
1,233
sqft
|
built
2020
3811 W 1530 N, Lehi, UT 84043
$-848
Cash flow
-13.1%
Cash-on-Cash Return
2.7%
Cap rate
0.5%
Rent to Value Ratio
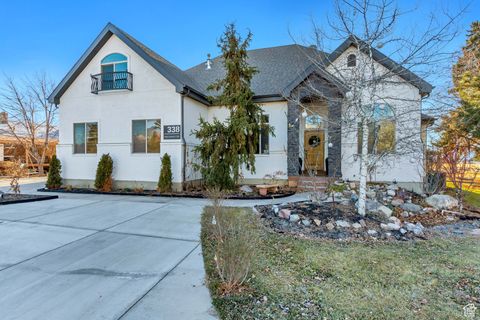
Active
$1,079,000
8
bds
|
4
ba
|
4,512
sqft
|
built
2009
338 S Holdaway Rd, Vineyard, UT 84059
$-2,340
Cash flow
-11.3%
Cash-on-Cash Return
3.1%
Cap rate
0.4%
Rent to Value Ratio

Active
$655,000
5
bds
|
3
ba
|
3,108
sqft
|
built
2013
1412 S 4175 W, Syracuse, UT 84075
$-1,601
Cash flow
-12.8%
Cash-on-Cash Return
2.7%
Cap rate
0.4%
Rent to Value Ratio
Active
$1,799,000
6
bds
|
4
ba
|
4,532
sqft
|
built
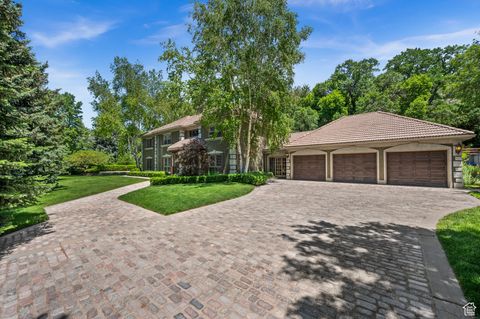
1994
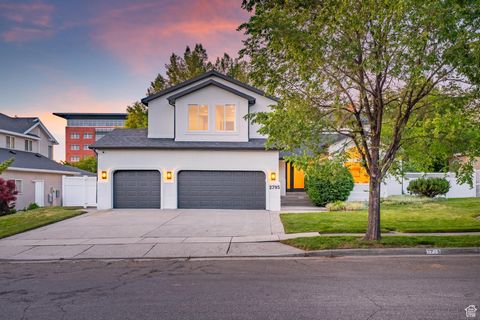
2795 E Palma Way, Cottonwood Heights, UT 84121
$-5,869
Cash flow
-17.0%
Cash-on-Cash Return
1.8%
Cap rate
0.3%
Rent to Value Ratio
Active
$735,000
3
bds
|
3
ba
|
1,365
sqft
|
built
1985
2953 W Wildflower Ct, Park City, UT 84098
$-2,154
Cash flow
-15.3%
Cash-on-Cash Return
2.2%
Cap rate
0.4%
Rent to Value Ratio
Active
$685,000
4
bds
|
2
ba
|
1,764
sqft
|
built
1948
1523 E 3115 S, Millcreek, UT 84106
$-1,620
Cash flow
-12.3%
Cash-on-Cash Return
2.8%
Cap rate
0.4%
Rent to Value Ratio

Active
$1,599,000
6
bds
|
5
ba
|
4,740
sqft
|
built
1978
5862 S Ayrshire Dr, Murray, UT 84107
$-2,586
Cash flow
-8.4%
Cash-on-Cash Return
3.7%
Cap rate
0.5%
Rent to Value Ratio