Utah Investment Properties for Sale
Browse homes for sale and investment properties in Utah. Refine your search by price, property type, or more.
Best cash flowing properties in Utah
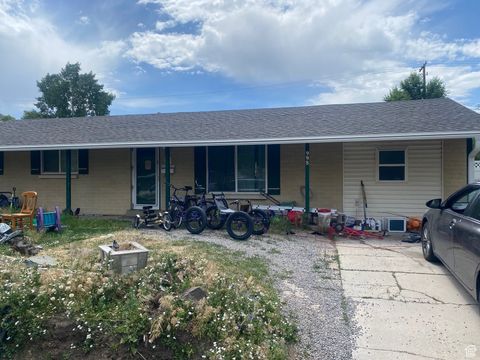
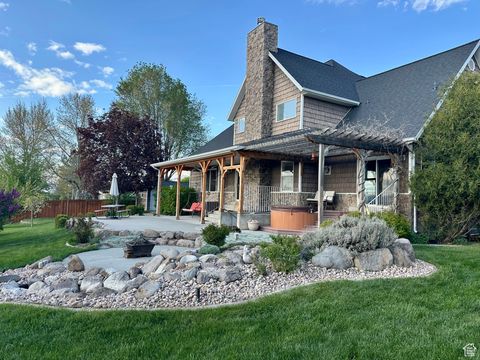
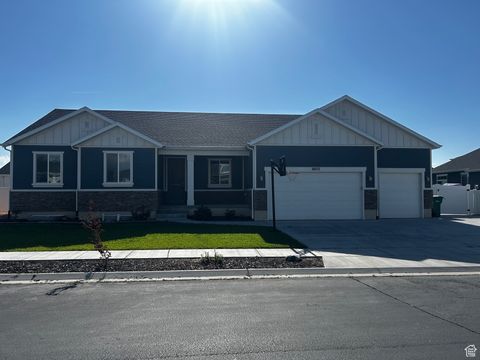
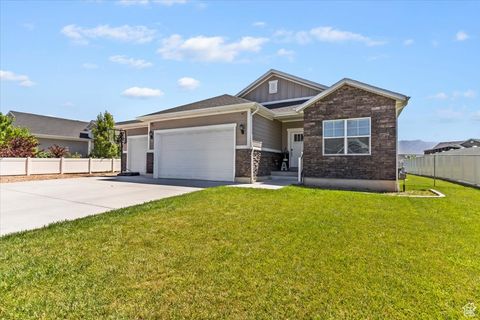
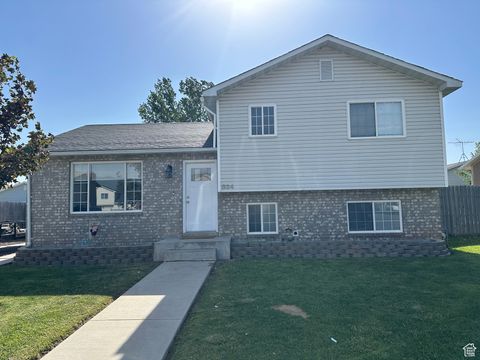
Active under contract
$324,900
4
bds
|
2
ba
|
1,806
sqft
|
built
1959
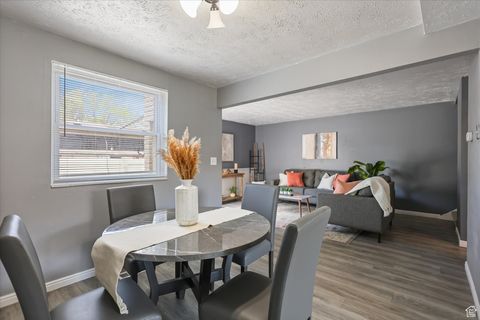
998 Oak Dr, Brigham City, UT 84302
$-305
Cash flow
-4.9%
Cash-on-Cash Return
4.6%
Cap rate
0.6%
Rent to Value Ratio
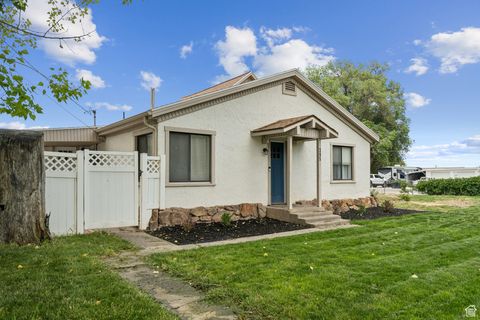
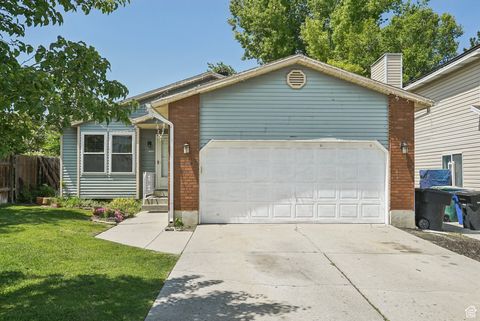
Active
$409,999
3
bds
|
1
ba
|
1,686
sqft
|
built
1918
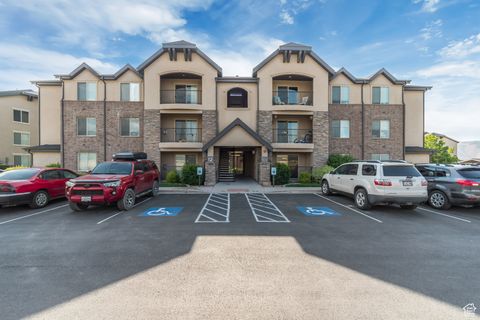
395 N 600 W, Payson, UT 84651
$-359
Cash flow
-4.6%
Cash-on-Cash Return
4.6%
Cap rate
0.6%
Rent to Value Ratio
6,421 out of 10,106 properties for sale in Utah
Limited Results Shown
Create a free account, or log in to reveal all property listings and enjoy the complete experience.
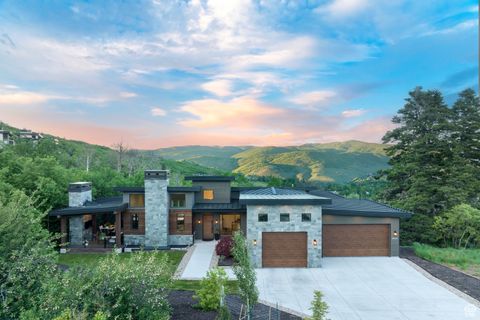
Active
$3,399,000
4
bds
|
4
ba
|
3,723
sqft
|
built
2021
8960 Parleys Ln, Park City, UT 84098
$-11,563
Cash flow
-17.7%
Cash-on-Cash Return
1.6%
Cap rate
0.3%
Rent to Value Ratio
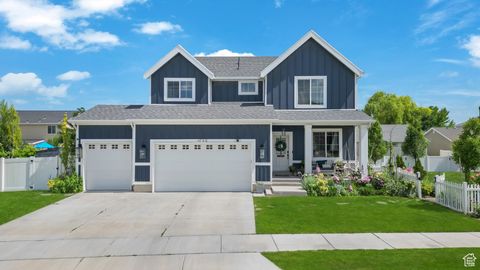
Active
$740,000
4
bds
|
4
ba
|
2,812
sqft
|
built
2019
748 S Crooked Post Way, Saratoga Springs, UT 84045
$-2,227
Cash flow
-15.7%
Cash-on-Cash Return
2.1%
Cap rate
0.3%
Rent to Value Ratio

Active under contract
$445,000
3
bds
|
2
ba
|
1,600
sqft
|
built
1962
470 Hiland Rd, Ogden, UT 84404
$-830
Cash flow
-9.7%
Cash-on-Cash Return
3.4%
Cap rate
0.5%
Rent to Value Ratio

Active
$665,000
4
bds
|
2
ba
|
2,368
sqft
|
built
1956
4601 S Creekview Cir, Murray, UT 84107
$-1,433
Cash flow
-11.2%
Cash-on-Cash Return
3.1%
Cap rate
0.4%
Rent to Value Ratio

Active
$895,000
4
bds
|
3
ba
|
4,004
sqft
|
built
1993
1222 E Big Pine Cir, Sandy, UT 84094
$-2,400
Cash flow
-14.0%
Cash-on-Cash Return
2.5%
Cap rate
0.3%
Rent to Value Ratio
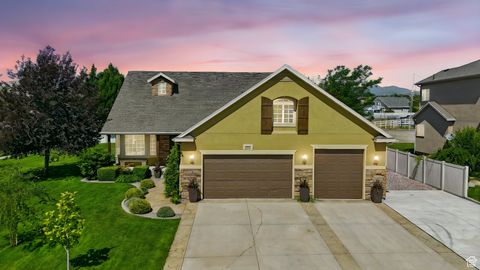
Active
$895,000
6
bds
|
4
ba
|
4,446
sqft
|
built
2003
840 S Williams Cv, Salem, UT 84653
$-2,152
Cash flow
-12.5%
Cash-on-Cash Return
2.8%
Cap rate
0.4%
Rent to Value Ratio
Active
$1,280,000
3
bds
|
4
ba
|
2,990
sqft
|
built
2022
12756 N Belaview Way, Hideout, UT 84036
$-3,726
Cash flow
-15.2%
Cash-on-Cash Return
2.2%
Cap rate
0.4%
Rent to Value Ratio

Active
$1,700,000
3
bds
|
3
ba
|
3,858
sqft
|
built
2018
1889 W Oakridge Dr, Lehi, UT 84043
$-6,802
Cash flow
-20.9%
Cash-on-Cash Return
0.9%
Cap rate
0.2%
Rent to Value Ratio

Active
$805,000
7
bds
|
4
ba
|
4,288
sqft
|
built
2005
8743 N Franklin Dr, Eagle Mountain, UT 84005
$-2,381
Cash flow
-15.4%
Cash-on-Cash Return
2.1%
Cap rate
0.3%
Rent to Value Ratio

Pending
$399,900
3
bds
|
2
ba
|
1,229
sqft
|
built
1914
472 S 1000 W, Salt Lake City, UT 84104
$-737
Cash flow
-9.6%
Cash-on-Cash Return
3.5%
Cap rate
0.5%
Rent to Value Ratio
Active
$495,000
4
bds
|
4
ba
|
2,454
sqft
|
built
2008
2536 S Andover St, West Haven, UT 84401
$-885
Cash flow
-9.3%
Cash-on-Cash Return
3.5%
Cap rate
0.5%
Rent to Value Ratio

Active
$669,000
4
bds
|
2
ba
|
1,850
sqft
|
built
1928
1373 S Green St, Salt Lake City, UT 84105
$-1,419
Cash flow
-11.1%
Cash-on-Cash Return
3.1%
Cap rate
0.4%
Rent to Value Ratio

Active
$589,900
3
bds
|
2
ba
|
3,088
sqft
|
built
2021
4764 N Grandview Peak Dr, Eagle Mountain, UT 84005
$-1,403
Cash flow
-12.4%
Cash-on-Cash Return
2.8%
Cap rate
0.4%
Rent to Value Ratio

Active
$875,000
3
bds
|
3
ba
|
3,641
sqft
|
built
2018
14899 S Canyon Pointe Rd, Draper, UT 84020
$-1,643
Cash flow
-9.8%
Cash-on-Cash Return
3.4%
Cap rate
0.5%
Rent to Value Ratio
Active
$950,000
6
bds
|
3
ba
|
4,775
sqft
|
built
2018
1043 S 900 E, Salem, UT 84653
$-2,645
Cash flow
-14.5%
Cash-on-Cash Return
2.3%
Cap rate
0.3%
Rent to Value Ratio
Active
$719,000
6
bds
|
4
ba
|
3,924
sqft
|
built
2019
6053 S 4400 W, Hooper, UT 84315
$-2,034
Cash flow
-14.8%
Cash-on-Cash Return
2.3%
Cap rate
0.3%
Rent to Value Ratio
Pending
$354,500
3
bds
|
3
ba
|
1,636
sqft
|
built
2014
456 E 2170 N, North Logan, UT 84341
$-827
Cash flow
-12.2%
Cash-on-Cash Return
2.9%
Cap rate
0.5%
Rent to Value Ratio
Active
$409,999
3
bds
|
1
ba
|
1,686
sqft
|
built
1918
395 N 600 W, Payson, UT 84651
$-359
Cash flow
-4.6%
Cash-on-Cash Return
4.6%
Cap rate
0.6%
Rent to Value Ratio
Pending
$699,700
5
bds
|
4
ba
|
4,007
sqft
|
built
1996
3474 W 7520 S, West Jordan, UT 84084
$-1,388
Cash flow
-10.3%
Cash-on-Cash Return
3.3%
Cap rate
0.5%
Rent to Value Ratio
Active
$519,900
5
bds
|
3
ba
|
1,946
sqft
|
built
1990
5733 W Plumbago Ave, Salt Lake City, UT 84118
$-998
Cash flow
-10.0%
Cash-on-Cash Return
3.4%
Cap rate
0.5%
Rent to Value Ratio

Active
$595,000
1
bds
|
2
ba
|
1,476
sqft
|
built
1957
7669 S 1130 E, Midvale, UT 84047
$-1,313
Cash flow
-11.5%
Cash-on-Cash Return
3.0%
Cap rate
0.4%
Rent to Value Ratio
Active
$535,000
3
bds
|
2
ba
|
1,677
sqft
|
built
2018
4026 S 3700 W, West Haven, UT 84401
$-1,537
Cash flow
-15.0%
Cash-on-Cash Return
2.2%
Cap rate
0.3%
Rent to Value Ratio

Active
$679,000
6
bds
|
4
ba
|
3,460
sqft
|
built
2009
1198 Reese Dr, Provo, UT 84601
$-1,496
Cash flow
-11.5%
Cash-on-Cash Return
3.0%
Cap rate
0.4%
Rent to Value Ratio
Active
$500,000
5
bds
|
2
ba
|
2,175
sqft
|
built
1986
5024 W Shooting Star Ave, West Jordan, UT 84081
$-877
Cash flow
-9.2%
Cash-on-Cash Return
3.6%
Cap rate
0.5%
Rent to Value Ratio
Active
$590,000
3
bds
|
2
ba
|
2,898
sqft
|
built
1938
49 W 150 S, Coalville, UT 84017
$-788
Cash flow
-7.0%
Cash-on-Cash Return
4.1%
Cap rate
0.5%
Rent to Value Ratio

Active
$765,000
3
bds
|
3
ba
|
3,752
sqft
|
built
2016
735 W Horizon Dr, Lehi, UT 84043
$-2,190
Cash flow
-14.9%
Cash-on-Cash Return
2.2%
Cap rate
0.3%
Rent to Value Ratio
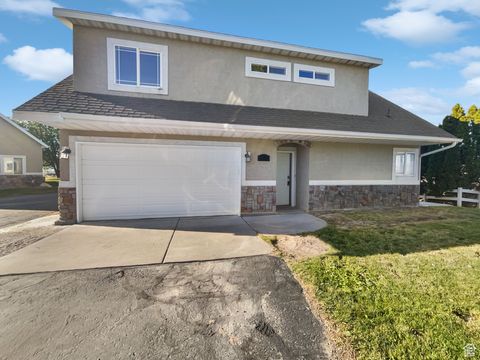
Active
$490,000
3
bds
|
3
ba
|
1,650
sqft
|
built
2016
891 W Edinburgh Dr, North Salt Lake, UT 84054
$-1,173
Cash flow
-12.5%
Cash-on-Cash Return
2.8%
Cap rate
0.4%
Rent to Value Ratio
Pending
$349,900
5
bds
|
3
ba
|
1,704
sqft
|
built
1977
55 W San Rafael Ct, West Jordan, UT 84088
$-621
Cash flow
-9.3%
Cash-on-Cash Return
3.5%
Cap rate
0.6%
Rent to Value Ratio
Active
$274,900
2
bds
|
2
ba
|
1,230
sqft
|
built
2014
1045 S 1700 W, Payson, UT 84651
$-729
Cash flow
-13.8%
Cash-on-Cash Return
2.5%
Cap rate
0.5%
Rent to Value Ratio
Active
$1,800,000
3
bds
|
3
ba
|
2,345
sqft
|
built
1983
754 Quaking Aspen Ct, Park City, UT 84060
$-4,869
Cash flow
-14.1%
Cash-on-Cash Return
2.4%
Cap rate
0.3%
Rent to Value Ratio
Active
$439,999
3
bds
|
2
ba
|
2,121
sqft
|
built
2018
14929 S Beckenbauer Ave, Herriman, UT 84096
$-1,009
Cash flow
-12.0%
Cash-on-Cash Return
2.9%
Cap rate
0.5%
Rent to Value Ratio

Active
$925,000
5
bds
|
4
ba
|
4,873
sqft
|
built
1988
4127 Bridlewood Dr, Bountiful, UT 84010
$-2,290
Cash flow
-12.9%
Cash-on-Cash Return
2.7%
Cap rate
0.4%
Rent to Value Ratio
Active
$380,000
3
bds
|
2
ba
|
1,650
sqft
|
built
1994
834 S 660 W, Tremonton, UT 84337
$-985
Cash flow
-13.5%
Cash-on-Cash Return
2.6%
Cap rate
0.4%
Rent to Value Ratio
Active under contract
$324,900
4
bds
|
2
ba
|
1,806
sqft
|
built
1959
998 Oak Dr, Brigham City, UT 84302
$-305
Cash flow
-4.9%
Cash-on-Cash Return
4.6%
Cap rate
0.6%
Rent to Value Ratio
Active under contract
$835,000
4
bds
|
4
ba
|
3,702
sqft
|
built
2001
7414 S Regal Hill Dr, West Jordan, UT 84081
$-2,511
Cash flow
-15.7%
Cash-on-Cash Return
2.1%
Cap rate
0.3%
Rent to Value Ratio
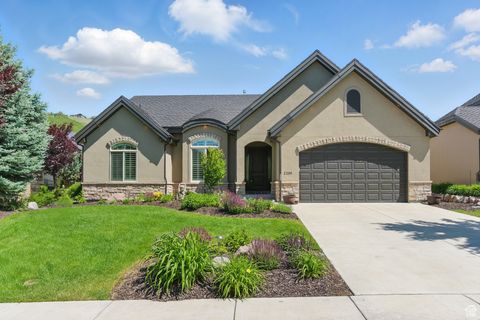
Active
$441,000
3
bds
|
2
ba
|
1,255
sqft
|
built
2002
2238 N Harvest Moon Dr, Saratoga Springs, UT 84045
$-1,053
Cash flow
-12.5%
Cash-on-Cash Return
2.8%
Cap rate
0.4%
Rent to Value Ratio
Active
$1,098,000
5
bds
|
3
ba
|
4,317
sqft
|
built
2018
2209 E Viscaya Dr, Draper, UT 84020
$-3,139
Cash flow
-14.9%
Cash-on-Cash Return
2.2%
Cap rate
0.4%
Rent to Value Ratio
Active under contract
$849,900
4
bds
|
2
ba
|
2,264
sqft
|
built
1956
1876 E Northwoodside Dr, Holladay, UT 84124
$-2,122
Cash flow
-13.0%
Cash-on-Cash Return
2.7%
Cap rate
0.4%
Rent to Value Ratio
Active
$815,000
8
bds
|
4
ba
|
3,300
sqft
|
built
1978
41 S 200 E, Santaquin, UT 84655
$-2,764
Cash flow
-17.7%
Cash-on-Cash Return
1.6%
Cap rate
0.2%
Rent to Value Ratio
Pending
$815,000
4
bds
|
3
ba
|
3,687
sqft
|
built
1968
2384 E Cinnabar Ln, Cottonwood Heights, UT 84121
$-1,543
Cash flow
-9.9%
Cash-on-Cash Return
3.4%
Cap rate
0.5%
Rent to Value Ratio