Utah Investment Properties for Sale
Browse homes for sale and investment properties in Utah. Refine your search by price, property type, or more.
Best cash flowing properties in Utah

Active
$247,000
2
bds
|
1
ba
|
970
sqft
|
built
1975
265 E 8880 S, Sandy, UT 84070
$-371
Cash flow
-7.8%
Cash-on-Cash Return
3.9%
Cap rate
0.6%
Rent to Value Ratio

Active
$264,998
2
bds
|
2
ba
|
1,198
sqft
|
built
1970
1384 Millcreek Dr, Ogden, UT 84404
$-657
Cash flow
-12.9%
Cash-on-Cash Return
2.7%
Cap rate
0.5%
Rent to Value Ratio
6,353 out of 9,441 properties for sale in Utah
Limited Results Shown
Create a free account, or log in to reveal all property listings and enjoy the complete experience.

Active
$380,000
3
bds
|
2
ba
|
1,302
sqft
|
built
2000
173 E Irisfield Dr, Draper, UT 84020
$-867
Cash flow
-11.9%
Cash-on-Cash Return
2.9%
Cap rate
0.5%
Rent to Value Ratio
Active
$4,250,000
4
bds
|
4
ba
|
3,171
sqft
|
built
1999
329 Ontario Ave, Park City, UT 84060
$-15,489
Cash flow
-19.0%
Cash-on-Cash Return
1.3%
Cap rate
0.2%
Rent to Value Ratio

Active
$440,000
2
bds
|
2
ba
|
1,271
sqft
|
built
2010
275 W 60 S, Hyde Park, UT 84318
$-1,118
Cash flow
-13.3%
Cash-on-Cash Return
2.6%
Cap rate
0.4%
Rent to Value Ratio
Active
$679,900
5
bds
|
4
ba
|
3,670
sqft
|
built
2006
3760 N 2800 W, Farr West, UT 84404
$-1,851
Cash flow
-14.2%
Cash-on-Cash Return
2.4%
Cap rate
0.4%
Rent to Value Ratio
Active
$900,000
5
bds
|
4
ba
|
4,393
sqft
|
built
1991
1434 Bennett Cir, Farmington, UT 84025
$-1,256
Cash flow
-7.3%
Cash-on-Cash Return
4.0%
Cap rate
0.5%
Rent to Value Ratio

Active
$12,500,000
4
bds
|
9
ba
|
11,438
sqft
|
built
1992
3826 E Thousand Oaks Cir, Salt Lake City, UT 84124
$-57,996
Cash flow
-24.2%
Cash-on-Cash Return
0.1%
Cap rate
0.1%
Rent to Value Ratio
Active
$7,500,000
7
bds
|
7
ba
|
10,969
sqft
|
built
2001
196 Holly Dr, Alpine, UT 84004
$-35,004
Cash flow
-24.4%
Cash-on-Cash Return
0.1%
Cap rate
0.1%
Rent to Value Ratio

Active
$1,426,400
7
bds
|
5
ba
|
10,440
sqft
|
built
1981
3077 Bannock Dr, Provo, UT 84604
$-4,571
Cash flow
-16.7%
Cash-on-Cash Return
1.8%
Cap rate
0.3%
Rent to Value Ratio

Active
$529,000
5
bds
|
2
ba
|
2,222
sqft
|
built
1973
980 W 230 N, Orem, UT 84057
$-1,424
Cash flow
-14.0%
Cash-on-Cash Return
2.4%
Cap rate
0.3%
Rent to Value Ratio

Active
$307,500
2
bds
|
2
ba
|
1,317
sqft
|
built
1999
827 E 760 N, Ogden, UT 84404
$-746
Cash flow
-12.7%
Cash-on-Cash Return
2.8%
Cap rate
0.5%
Rent to Value Ratio

Active
$1,898,000
4
bds
|
3
ba
|
5,104
sqft
|
built
1969
2008 N 3850 E, Eden, UT 84310
$-5,612
Cash flow
-15.4%
Cash-on-Cash Return
2.1%
Cap rate
0.3%
Rent to Value Ratio

Active
$724,900
4
bds
|
2
ba
|
2,532
sqft
|
built
2003
3246 E Hidden Springs Dr, Washington, UT 84780
$-1,743
Cash flow
-12.5%
Cash-on-Cash Return
2.8%
Cap rate
0.4%
Rent to Value Ratio

Active
$1,675,000
4
bds
|
4
ba
|
5,026
sqft
|
built
2022
11619 S Halcom Dr, South Jordan, UT 84095
$-3,575
Cash flow
-11.1%
Cash-on-Cash Return
3.1%
Cap rate
0.4%
Rent to Value Ratio

Active
$1,245,000
4
bds
|
5
ba
|
2,599
sqft
|
built
2018
6394 E 850 S, Huntsville, UT 84317
$-4,700
Cash flow
-19.7%
Cash-on-Cash Return
1.1%
Cap rate
0.2%
Rent to Value Ratio

Active
$625,000
6
bds
|
3
ba
|
2,980
sqft
|
built
1997
9821 N Manila Cir, Cedar Hills, UT 84062
$-1,799
Cash flow
-15.0%
Cash-on-Cash Return
2.2%
Cap rate
0.3%
Rent to Value Ratio
Active
$439,000
4
bds
|
4
ba
|
2,283
sqft
|
built
2016
116 W Condor Rd, Saratoga Springs, UT 84045
$-1,035
Cash flow
-12.3%
Cash-on-Cash Return
2.8%
Cap rate
0.5%
Rent to Value Ratio

Active
$1,349,000
5
bds
|
4
ba
|
4,380
sqft
|
built
2019
1407 E Abigail Ln, Eagle Mountain, UT 84005
$-4,344
Cash flow
-16.8%
Cash-on-Cash Return
1.8%
Cap rate
0.3%
Rent to Value Ratio
Active
$1,549,900
5
bds
|
4
ba
|
6,090
sqft
|
built
2023
6684 W Valynn Dr, Herriman, UT 84096
$-4,065
Cash flow
-13.7%
Cash-on-Cash Return
2.5%
Cap rate
0.4%
Rent to Value Ratio
Active
$799,000
4
bds
|
3
ba
|
1,907
sqft
|
built
1972
2605 E Portsmouth Ave, Cottonwood Heights, UT 84121
$-2,315
Cash flow
-15.1%
Cash-on-Cash Return
2.2%
Cap rate
0.3%
Rent to Value Ratio

Active
$669,000
6
bds
|
4
ba
|
3,936
sqft
|
built
2023
4623 N Festival Way, Eagle Mountain, UT 84005
$-1,346
Cash flow
-10.5%
Cash-on-Cash Return
3.3%
Cap rate
0.5%
Rent to Value Ratio
Active
$699,000
3
bds
|
3
ba
|
2,014
sqft
|
built
2005
340 N Snow Canyon Dr, Ivins, UT 84738
$-1,498
Cash flow
-11.2%
Cash-on-Cash Return
3.1%
Cap rate
0.5%
Rent to Value Ratio
Active
$1,250,000
4
bds
|
4
ba
|
3,642
sqft
|
built
2005
1973 W Modoc Loop, Coalville, UT 84017
$-1,972
Cash flow
-8.2%
Cash-on-Cash Return
3.8%
Cap rate
0.5%
Rent to Value Ratio

Active
$565,000
5
bds
|
4
ba
|
2,704
sqft
|
built
2006
564 W 475 N, Clearfield, UT 84015
$-1,396
Cash flow
-12.9%
Cash-on-Cash Return
2.7%
Cap rate
0.4%
Rent to Value Ratio

Active
$399,900
3
bds
|
1
ba
|
998
sqft
|
built
1909
1022 W 400 N, Salt Lake City, UT 84116
$-904
Cash flow
-11.8%
Cash-on-Cash Return
3.0%
Cap rate
0.4%
Rent to Value Ratio

Active
$1,100,000
4
bds
|
2
ba
|
2,800
sqft
|
built
1957
1325 E Milne Ln, Cottonwood Heights, UT 84047
$-2,475
Cash flow
-11.7%
Cash-on-Cash Return
3.0%
Cap rate
0.4%
Rent to Value Ratio
Active
$874,999
3
bds
|
2
ba
|
1,508
sqft
|
built
1980
190 Aspen Dr, Park City, UT 84098
$-1,704
Cash flow
-10.2%
Cash-on-Cash Return
3.3%
Cap rate
0.4%
Rent to Value Ratio
Active
$739,000
6
bds
|
4
ba
|
3,537
sqft
|
built
2010
1137 S 925 E, Salem, UT 84653
$-2,375
Cash flow
-16.8%
Cash-on-Cash Return
1.8%
Cap rate
0.3%
Rent to Value Ratio
Active
$680,000
4
bds
|
3
ba
|
2,879
sqft
|
built
1968
134 E 175 S, North Salt Lake, UT 84054
$-1,568
Cash flow
-12.0%
Cash-on-Cash Return
2.9%
Cap rate
0.4%
Rent to Value Ratio

Active
$199,000
2
bds
|
2
ba
|
1,100
sqft
|
built
1970
1423 Arthur Dr, Provo, UT 84601
$-714
Cash flow
-18.7%
Cash-on-Cash Return
1.4%
Cap rate
0.6%
Rent to Value Ratio

Active
$539,500
3
bds
|
2
ba
|
1,547
sqft
|
built
1924
248 E Westminster Ave, Salt Lake City, UT 84115
$-1,458
Cash flow
-14.1%
Cash-on-Cash Return
2.4%
Cap rate
0.3%
Rent to Value Ratio
Active
$399,000
bds
|
1
ba
|
351
sqft
|
built
2020
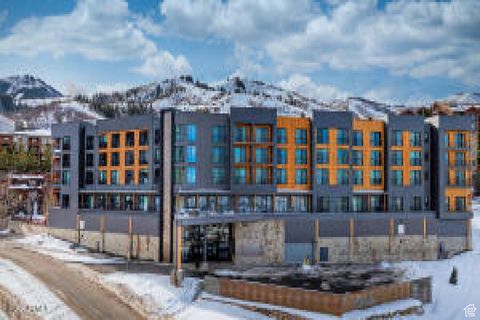
2670 Canyons Resort Dr, Park City, UT 84098
$-1,616
Cash flow
-21.1%
Cash-on-Cash Return
0.8%
Cap rate
0.4%
Rent to Value Ratio

Active
$2,300,000
7
bds
|
7
ba
|
7,444
sqft
|
built
1999
151 W 3700 N, Provo, UT 84604
$-9,863
Cash flow
-22.4%
Cash-on-Cash Return
0.5%
Cap rate
0.1%
Rent to Value Ratio

Active
$580,900
3
bds
|
2
ba
|
1,755
sqft
|
built
1972
7688 S 1130 E, Midvale, UT 84047
$-1,339
Cash flow
-12.0%
Cash-on-Cash Return
2.9%
Cap rate
0.4%
Rent to Value Ratio
Active
$720,000
5
bds
|
4
ba
|
3,346
sqft
|
built
2014
10243 S Silver Mine Rd, South Jordan, UT 84009
$-1,354
Cash flow
-9.8%
Cash-on-Cash Return
3.4%
Cap rate
0.5%
Rent to Value Ratio

Active
$1,875,000
1
bds
|
5
ba
|
4,600
sqft
|
built
2019
4554 Forestdale Dr, Park City, UT 84098
$-7,707
Cash flow
-21.4%
Cash-on-Cash Return
0.7%
Cap rate
0.2%
Rent to Value Ratio

Active
$795,000
5
bds
|
2
ba
|
4,515
sqft
|
built
1909
1533 W 4800 S, Taylorsville, UT 84123
$-2,405
Cash flow
-15.8%
Cash-on-Cash Return
2.0%
Cap rate
0.3%
Rent to Value Ratio

Active
$619,000
6
bds
|
2
ba
|
3,218
sqft
|
built
1925
260 W 100 N, Lehi, UT 84043
$-957
Cash flow
-8.1%
Cash-on-Cash Return
3.8%
Cap rate
0.5%
Rent to Value Ratio
Active
$5,690,000
8
bds
|
10
ba
|
12,963
sqft
|
built
2006
17 S Crosshill Ln, Sandy, UT 84092
$-26,373
Cash flow
-24.2%
Cash-on-Cash Return
0.1%
Cap rate
0.1%
Rent to Value Ratio