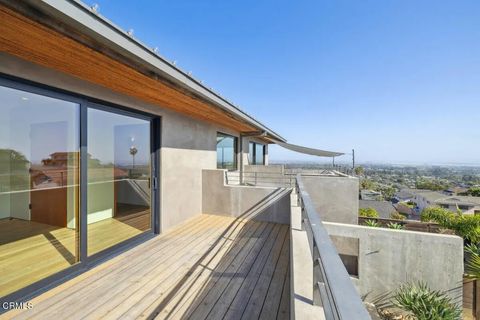
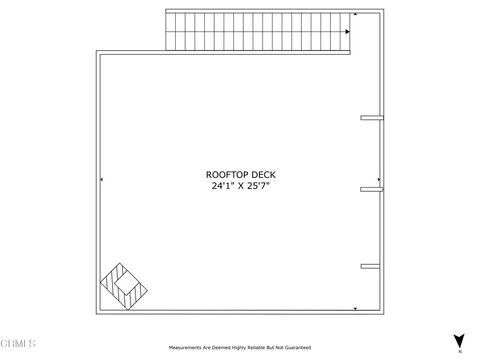
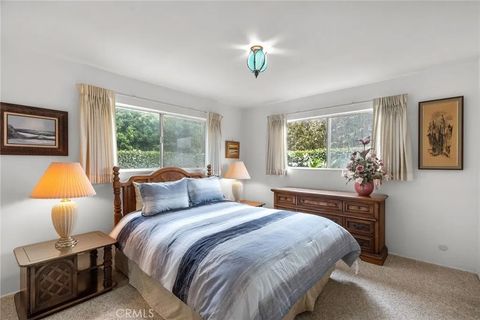
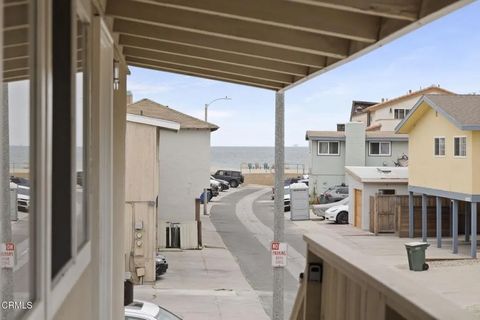
Ventura, CA Investment Properties for Sale
Browse homes for sale and investment properties in Ventura, CA. Refine your search by price, property type, or more.
Best cash flowing properties in Ventura, CA
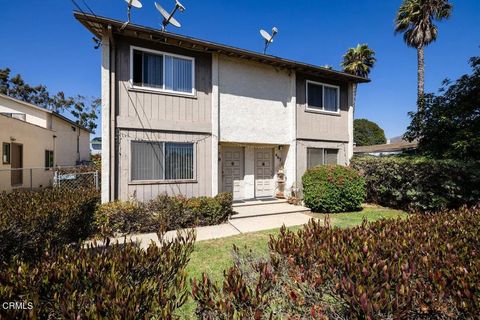
Active
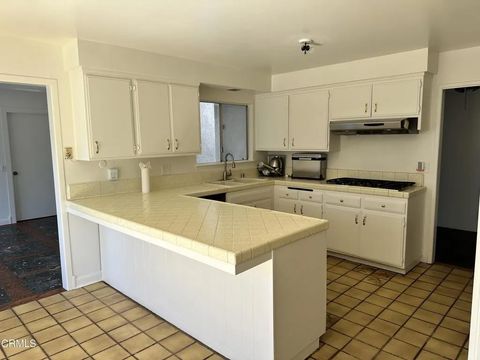
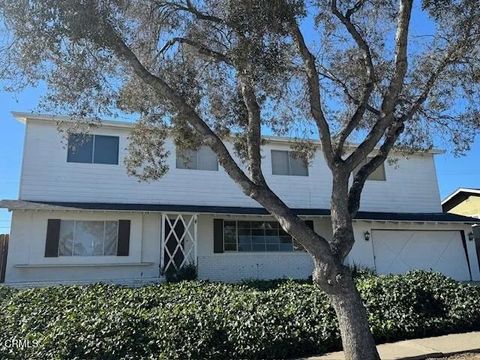
$859,999
4
bds
|
3
ba
|
1,840
sqft
|
built
1977
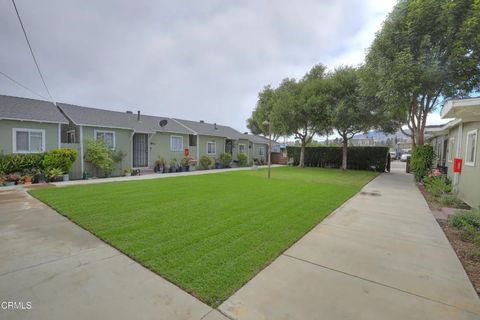
6368 Hunter St, Ventura, CA 93003
$-1,520
Cash flow
-9.2%
Cash-on-Cash Return
3.9%
Cap rate
0.5%
Rent to Value Ratio
Active
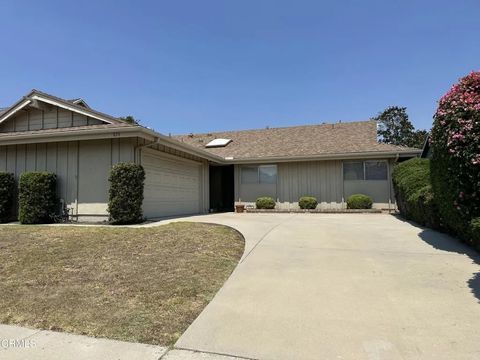
$869,900
4
bds
|
3
ba
|
1,787
sqft
|
built
1965
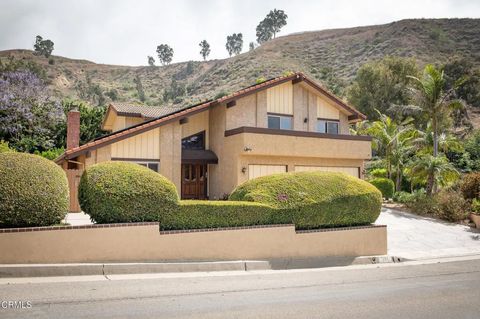
874 Gardner Ave, Ventura, CA 93004
$-1,570
Cash flow
-9.4%
Cash-on-Cash Return
3.9%
Cap rate
0.5%
Rent to Value Ratio
23 out of 139 properties for sale in Ventura, CA
Limited Results Shown
Create a free account, or log in to reveal all property listings and enjoy the complete experience.
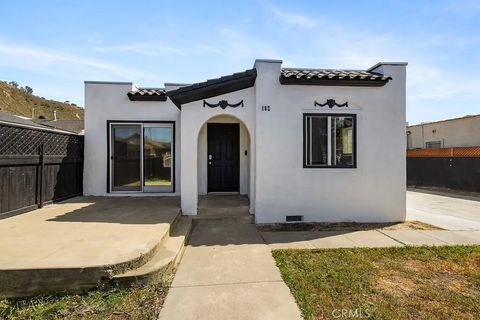
Active
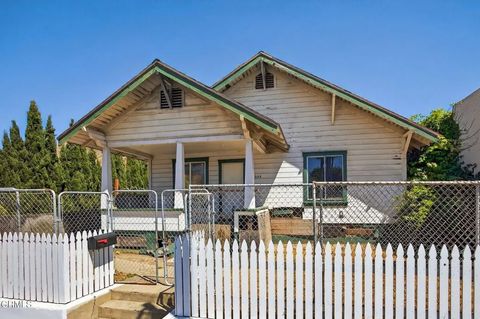
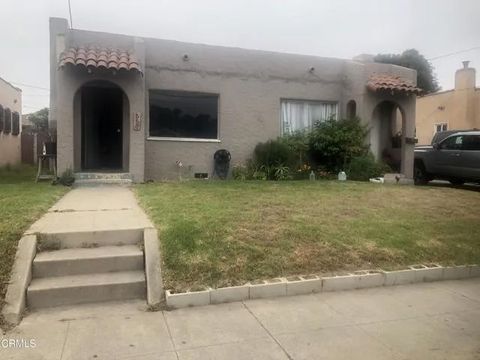
$750,000
2
bds
|
1
ba
|
1,705
sqft
|
built
1890
234 N Ventura Ave, Ventura, CA 93001
$-1,998
Cash flow
-13.9%
Cash-on-Cash Return
2.9%
Cap rate
0.3%
Rent to Value Ratio
Active
$999,000
3
bds
|
2
ba
|
2,025
sqft
|
built
1970
7802 El Dorado St, Ventura, CA 93004
$-2,291
Cash flow
-12.0%
Cash-on-Cash Return
3.3%
Cap rate
0.4%
Rent to Value Ratio
Active
$899,000
4
bds
|
4
ba
|
2,205
sqft
|
built
1983
467 W Simpson St, Ventura, CA 93001
$-2,614
Cash flow
-15.2%
Cash-on-Cash Return
2.6%
Cap rate
0.3%
Rent to Value Ratio
Active
$899,999
6
bds
|
3
ba
|
0
sqft
|
built
1928
182 E Mc Farlane Dr, Ventura, CA 93001
$-2,343
Cash flow
-13.6%
Cash-on-Cash Return
2.9%
Cap rate
0.4%
Rent to Value Ratio

Active
$925,000
3
bds
|
2
ba
|
1,244
sqft
|
built
1959
489 Mara Ave, Ventura, CA 93004
$-2,193
Cash flow
-12.4%
Cash-on-Cash Return
3.2%
Cap rate
0.4%
Rent to Value Ratio
Active
$2,600,000
6
bds
|
3
ba
|
2,936
sqft
|
built
1965
2851 Seahorse Ave, Ventura, CA 93001
$-8,248
Cash flow
-16.6%
Cash-on-Cash Return
2.3%
Cap rate
0.3%
Rent to Value Ratio
Active
$1,375,000
5
bds
|
3
ba
|
2,510
sqft
|
built
1957
114 San Marino Ave, Ventura, CA 93003
$-3,503
Cash flow
-13.3%
Cash-on-Cash Return
3.0%
Cap rate
0.4%
Rent to Value Ratio
Active
$2,500,000
1
bds
|
1
ba
|
0
sqft
|
built
1926
852 N Ventura Ave, Ventura, CA 93001
$-10,502
Cash flow
-21.9%
Cash-on-Cash Return
1.0%
Cap rate
0.1%
Rent to Value Ratio
Active
$1,195,000
4
bds
|
3
ba
|
2,415
sqft
|
built
1984
1675 Arroyo Seco Dr, Ventura, CA 93004
$-2,938
Cash flow
-12.8%
Cash-on-Cash Return
3.1%
Cap rate
0.4%
Rent to Value Ratio
Active
$1,250,000
3
bds
|
3
ba
|
2,392
sqft
|
built
1979
191 Harborview Ct, Ventura, CA 93003
$-2,802
Cash flow
-11.7%
Cash-on-Cash Return
3.4%
Cap rate
0.4%
Rent to Value Ratio
Active
$895,000
2
bds
|
1
ba
|
1,232
sqft
|
built
1926
253 Cedar St, Ventura, CA 93001
$-2,042
Cash flow
-11.9%
Cash-on-Cash Return
3.3%
Cap rate
0.4%
Rent to Value Ratio
Active
$1,869,000
4
bds
|
3
ba
|
2,057
sqft
|
built
2020
572 Skyline Rd, Ventura, CA 93003
$-6,346
Cash flow
-17.7%
Cash-on-Cash Return
2.0%
Cap rate
0.2%
Rent to Value Ratio
Active
$1,695,000
2
bds
|
3
ba
|
2,216
sqft
|
built
2020
5572 Rainier St, Ventura, CA 93003
$-5,052
Cash flow
-15.6%
Cash-on-Cash Return
2.5%
Cap rate
0.3%
Rent to Value Ratio
Active
$2,249,000
3
bds
|
2
ba
|
2,438
sqft
|
built
1971
1277 Devon Ln, Ventura, CA 93001
$-6,887
Cash flow
-16.0%
Cash-on-Cash Return
2.4%
Cap rate
0.3%
Rent to Value Ratio
Active
$2,350,000
4
bds
|
4
ba
|
0
sqft
|
built
1132 Pittsfield Ln, Ventura, CA 93001
$-8,502
Cash flow
-18.9%
Cash-on-Cash Return
1.7%
Cap rate
0.2%
Rent to Value Ratio
Active
$1,364,000
3
bds
|
2
ba
|
0
sqft
|
built
1949
130 Virginia Dr, Ventura, CA 93003
$-4,206
Cash flow
-16.1%
Cash-on-Cash Return
2.4%
Cap rate
0.3%
Rent to Value Ratio
Active
$1,435,000
3
bds
|
3
ba
|
2,030
sqft
|
built
1981
7017 Sonora Ct, Ventura, CA 93003
$-3,875
Cash flow
-14.1%
Cash-on-Cash Return
2.8%
Cap rate
0.3%
Rent to Value Ratio
Active
$1,140,000
3
bds
|
2
ba
|
0
sqft
|
built
1951
66 N Dos Caminos Ave, Ventura, CA 93003
$-3,763
Cash flow
-17.2%
Cash-on-Cash Return
2.1%
Cap rate
0.3%
Rent to Value Ratio
Active
$1,250,000
3
bds
|
2
ba
|
0
sqft
|
built
1957
11465 Nardo St, Ventura, CA 93004
$-3,837
Cash flow
-16.0%
Cash-on-Cash Return
2.4%
Cap rate
0.3%
Rent to Value Ratio
Active
$1,600,000
8
bds
|
4
ba
|
4,026
sqft
|
built
1957
275 Fairfax Ave, Ventura, CA 93003
$-4,226
Cash flow
-13.8%
Cash-on-Cash Return
2.9%
Cap rate
0.4%
Rent to Value Ratio
Active
$999,000
1
bds
|
1
ba
|
0
sqft
|
built
1927
557 N Olive St, Ventura, CA 93001
$-3,326
Cash flow
-17.4%
Cash-on-Cash Return
2.1%
Cap rate
0.3%
Rent to Value Ratio