Wakefield, MA Investment Properties for Sale
Browse homes for sale and investment properties in Wakefield, MA. Refine your search by price, property type, or more.
Best cash flowing properties in Wakefield, MA
Active
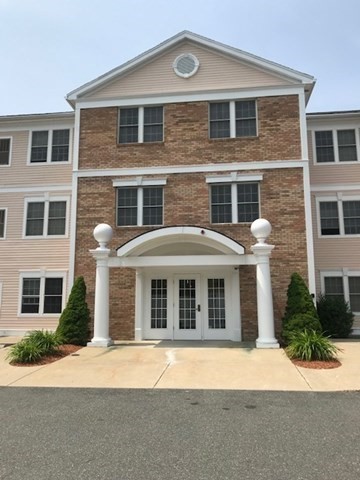
$479,000
2
bds
|
2
ba
|
960
sqft
|
built
2002
1 Millbrook Ln, Wakefield, MA 01880
$-1,385
Cash flow
-15.1%
Cash-on-Cash Return
2.2%
Cap rate
0.5%
Rent to Value Ratio
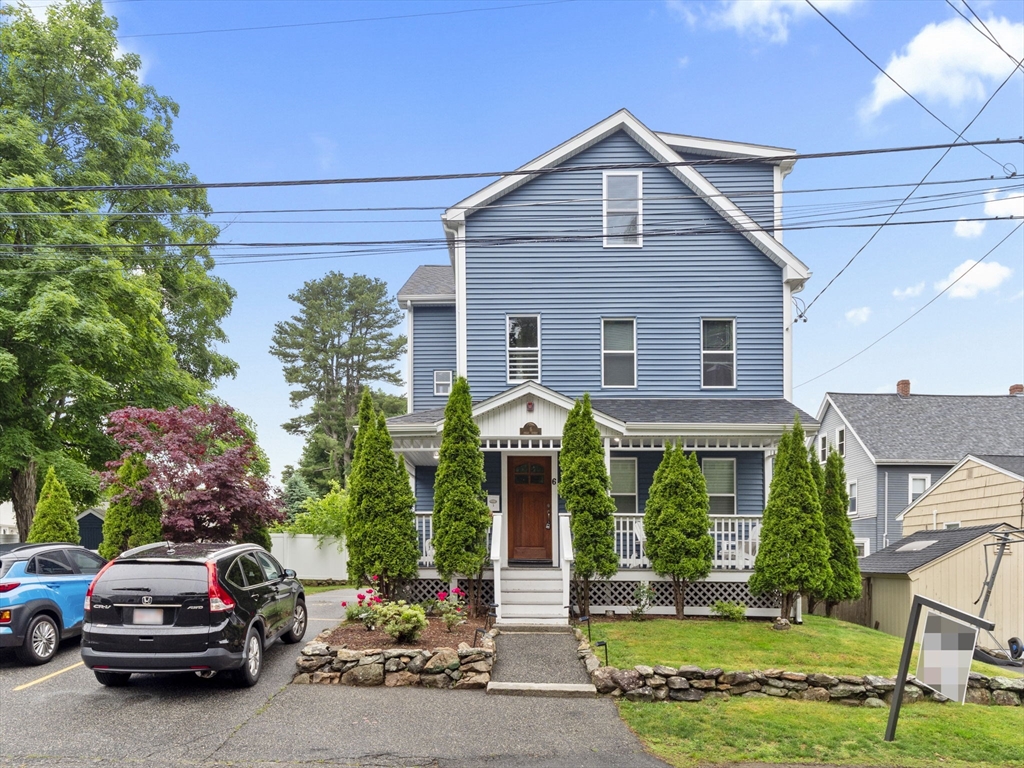
Active
$559,999
2
bds
|
1
ba
|
865
sqft
|
built
1930
6 Nelly St, Wakefield, MA 01880
$-1,407
Cash flow
-13.1%
Cash-on-Cash Return
2.7%
Cap rate
0.5%
Rent to Value Ratio
16 out of 26 properties for sale in Wakefield, MA
Limited Results Shown
Create a free account, or log in to reveal all property listings and enjoy the complete experience.
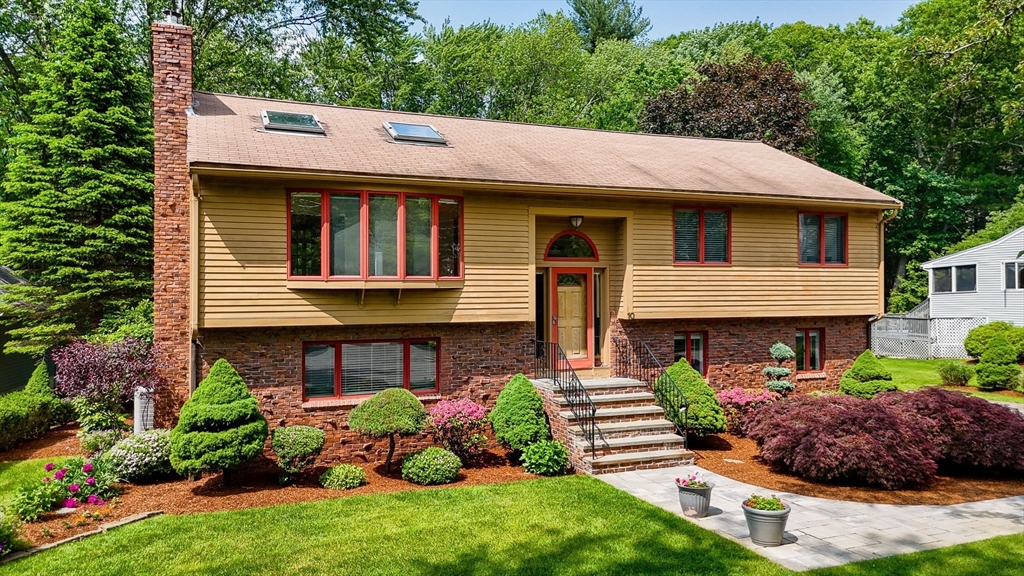
Pending
$899,900
3
bds
|
2
ba
|
2,079
sqft
|
built
1985
10 Briarwood Ln, Wakefield, MA 01880
$-2,174
Cash flow
-12.6%
Cash-on-Cash Return
2.8%
Cap rate
0.5%
Rent to Value Ratio
Active
$559,999
2
bds
|
1
ba
|
865
sqft
|
built
1930
6 Nelly St, Wakefield, MA 01880
$-1,407
Cash flow
-13.1%
Cash-on-Cash Return
2.7%
Cap rate
0.5%
Rent to Value Ratio
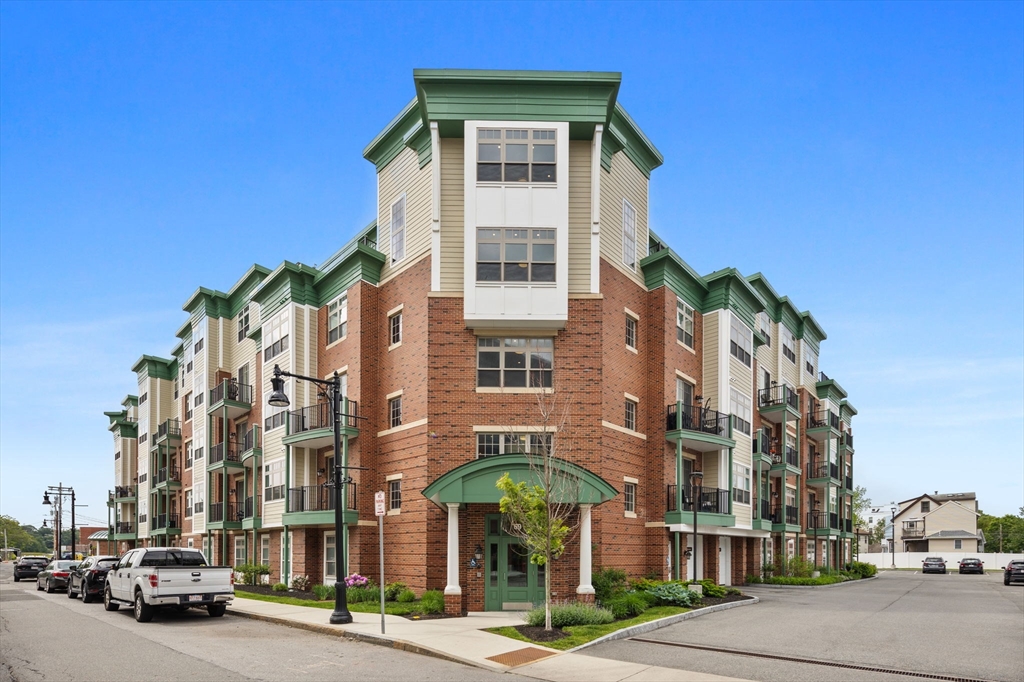
Active
$539,900
1
bds
|
1
ba
|
832
sqft
|
built
2019
69 Foundry St, Wakefield, MA 01880
$-1,539
Cash flow
-14.9%
Cash-on-Cash Return
2.3%
Cap rate
0.5%
Rent to Value Ratio
Active under contract
$929,000
4
bds
|
4
ba
|
2,361
sqft
|
built
1963
60 Morrison Rd W, Wakefield, MA 01880
$-2,074
Cash flow
-11.6%
Cash-on-Cash Return
3.0%
Cap rate
0.5%
Rent to Value Ratio
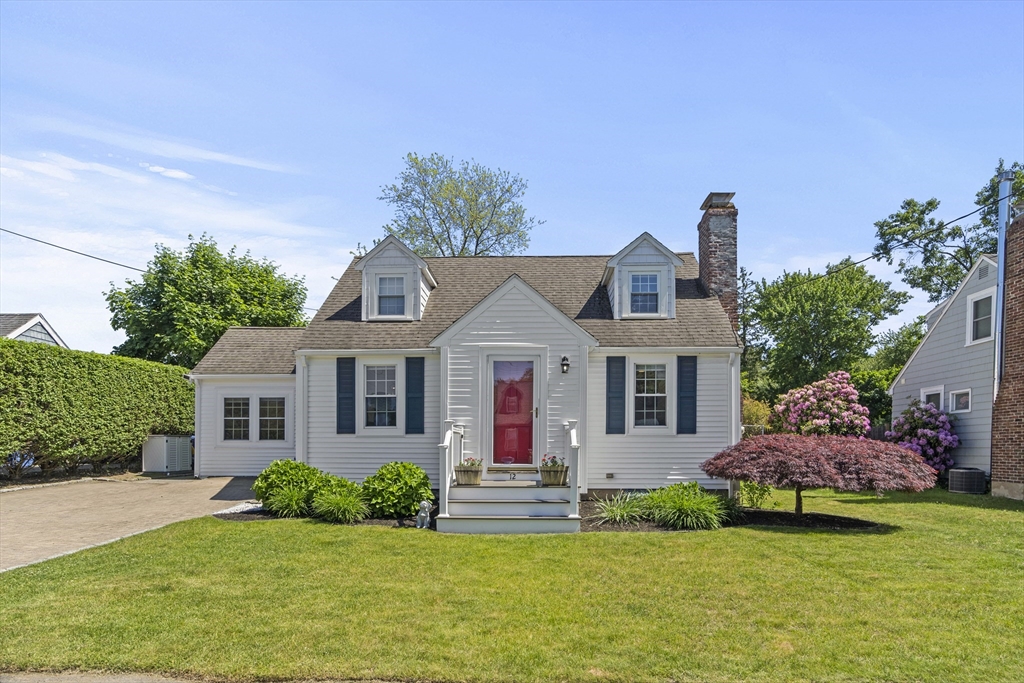
Pending
$719,900
3
bds
|
1
ba
|
1,236
sqft
|
built
1942
12 Willow St, Wakefield, MA 01880
$-1,640
Cash flow
-11.9%
Cash-on-Cash Return
2.9%
Cap rate
0.5%
Rent to Value Ratio
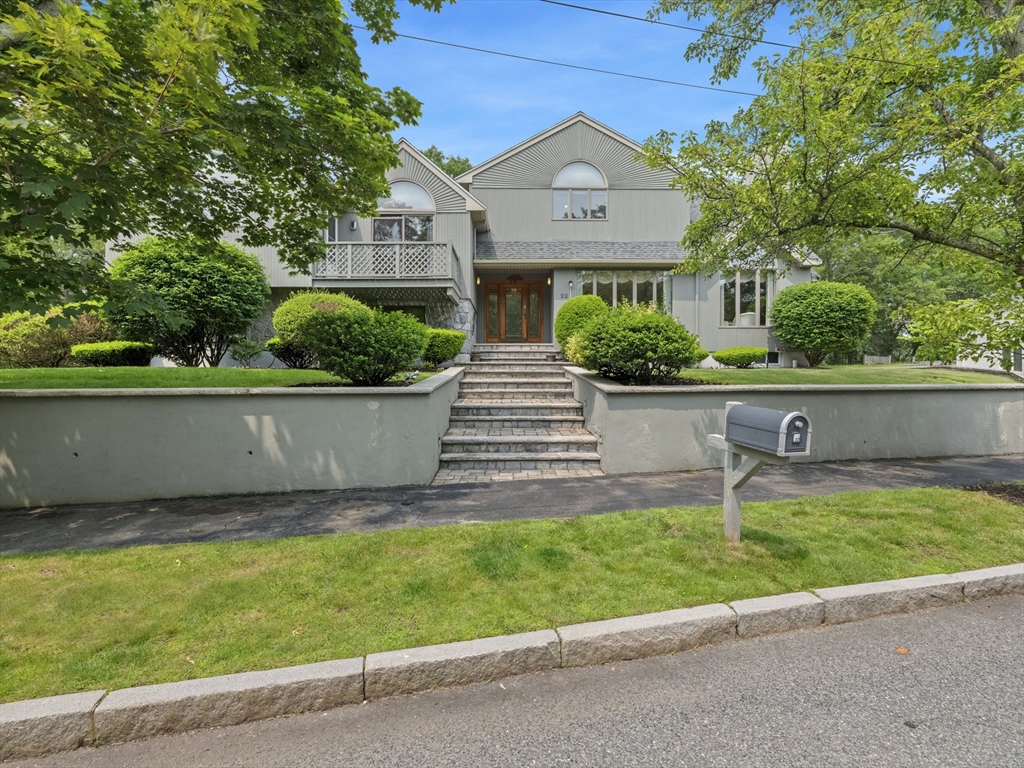
Active
$1,399,900
4
bds
|
5
ba
|
4,758
sqft
|
built
1987
22 Orsini Dr, Wakefield, MA 01880
$-3,922
Cash flow
-14.6%
Cash-on-Cash Return
2.3%
Cap rate
0.4%
Rent to Value Ratio
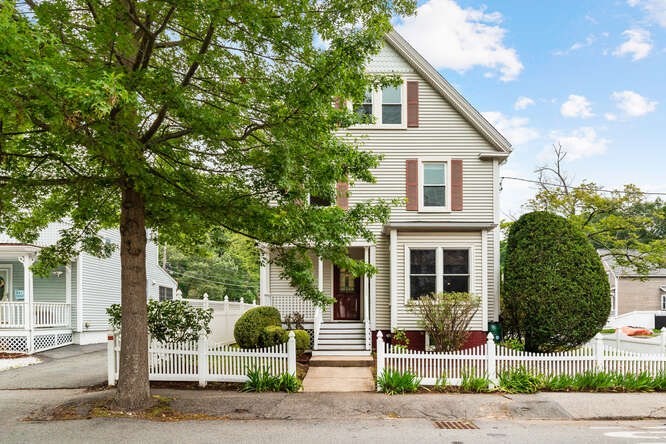
Pending
$799,900
4
bds
|
2
ba
|
1,813
sqft
|
built
1900
6 Francis Ave, Wakefield, MA 01880
$-1,747
Cash flow
-11.4%
Cash-on-Cash Return
3.1%
Cap rate
0.5%
Rent to Value Ratio
Active
$479,000
2
bds
|
2
ba
|
960
sqft
|
built
2002
1 Millbrook Ln, Wakefield, MA 01880
$-1,385
Cash flow
-15.1%
Cash-on-Cash Return
2.2%
Cap rate
0.5%
Rent to Value Ratio
Pending
$949,000
1
bds
|
6
ba
|
2,610
sqft
|
built
1900
16 Chestnut St, Wakefield, MA 01880
$-3,208
Cash flow
-17.6%
Cash-on-Cash Return
1.6%
Cap rate
0.3%
Rent to Value Ratio
Active
$1,200,000
8
bds
|
5
ba
|
3,613
sqft
|
built
1885
24 Park St, Wakefield, MA 01880
$-4,287
Cash flow
-18.6%
Cash-on-Cash Return
1.4%
Cap rate
0.3%
Rent to Value Ratio
Active
$975,000
4
bds
|
3
ba
|
2,385
sqft
|
built
2019
10 Wakefield Ave, Wakefield, MA 01880
$-2,271
Cash flow
-12.2%
Cash-on-Cash Return
2.9%
Cap rate
0.5%
Rent to Value Ratio
Active
$1,225,000
4
bds
|
5
ba
|
4,065
sqft
|
built
1987
142 Montrose Ave, Wakefield, MA 01880
$-2,897
Cash flow
-12.3%
Cash-on-Cash Return
2.8%
Cap rate
0.5%
Rent to Value Ratio
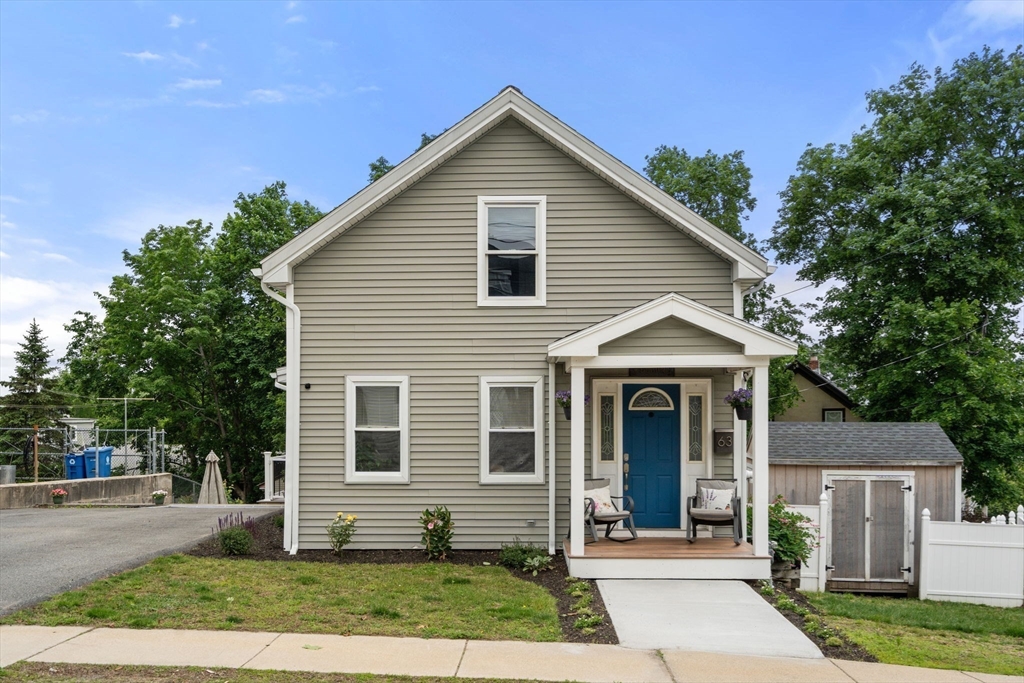
Active
$899,900
5
bds
|
3
ba
|
1,961
sqft
|
built
1900
63 Richardson St, Wakefield, MA 01880
$-2,441
Cash flow
-14.2%
Cash-on-Cash Return
2.4%
Cap rate
0.4%
Rent to Value Ratio
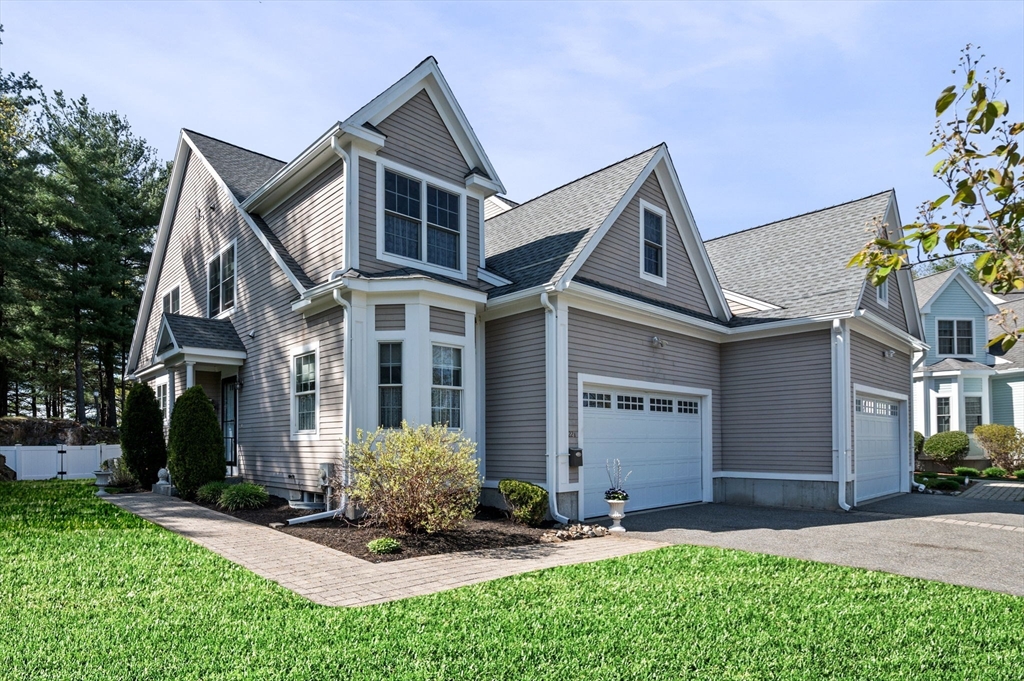
Active
$1,100,000
4
bds
|
4
ba
|
2,917
sqft
|
built
2008
22 Gates Ln, Wakefield, MA 01880
$-2,927
Cash flow
-13.9%
Cash-on-Cash Return
2.5%
Cap rate
0.4%
Rent to Value Ratio
Active
$1,419,000
4
bds
|
3
ba
|
3,200
sqft
|
built
1950
6 Lovis Ave, Wakefield, MA 01880
$-3,082
Cash flow
-11.3%
Cash-on-Cash Return
3.1%
Cap rate
0.4%
Rent to Value Ratio
Active
$1,299,900
4
bds
|
6
ba
|
4,264
sqft
|
built
2002
762 Main St, Wakefield, MA 01880
$-3,972
Cash flow
-15.9%
Cash-on-Cash Return
2.0%
Cap rate
0.3%
Rent to Value Ratio