Wareham, MA Investment Properties for Sale
Browse homes for sale and investment properties in Wareham, MA. Refine your search by price, property type, or more.
Best cash flowing properties in Wareham, MA
Active
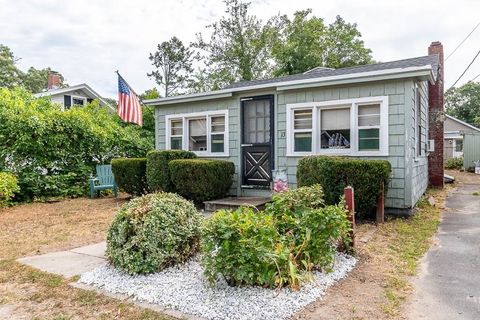
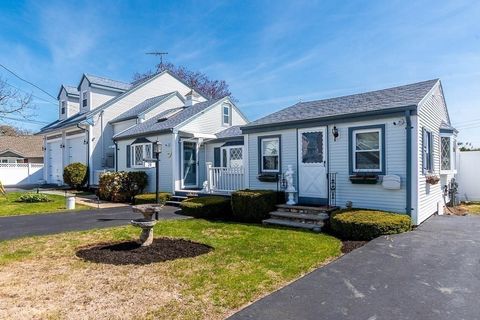
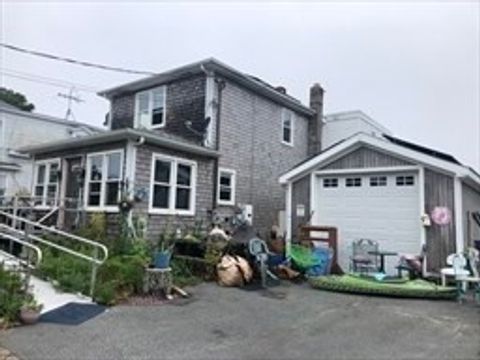
$299,900
2
bds
|
1
ba
|
920
sqft
|
built
1940
13 Judson St, Wareham, MA 02571
$-84
Cash flow
-1.5%
Cash-on-Cash Return
5.3%
Cap rate
0.8%
Rent to Value Ratio
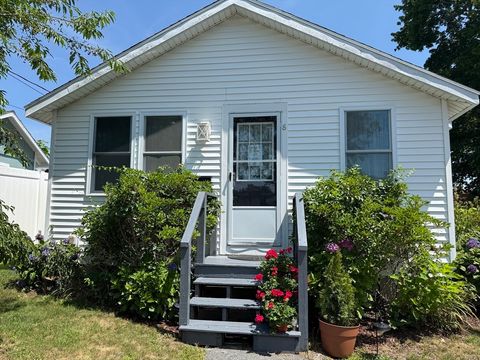
Active
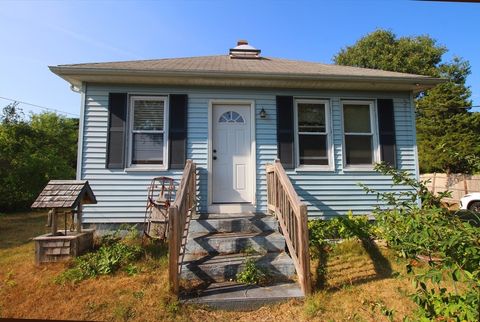
$325,000
2
bds
|
1
ba
|
758
sqft
|
built
1930
1 Mattos Ave, Wareham, MA 02571
$-247
Cash flow
-4.0%
Cash-on-Cash Return
4.8%
Cap rate
0.7%
Rent to Value Ratio
19 out of 28 properties for sale in Wareham, MA
Limited Results Shown
Create a free account, or log in to reveal all property listings and enjoy the complete experience.
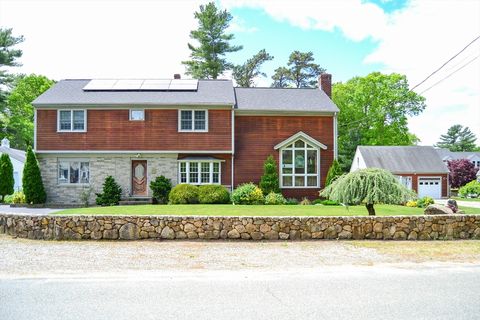
Active
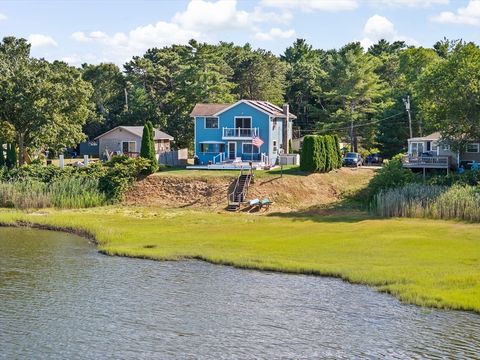
$850,000
3
bds
|
2
ba
|
1,612
sqft
|
built
1950
28 Arlington Rd, Wareham, MA 02571
$-2,309
Cash flow
-14.2%
Cash-on-Cash Return
2.4%
Cap rate
0.4%
Rent to Value Ratio
Active
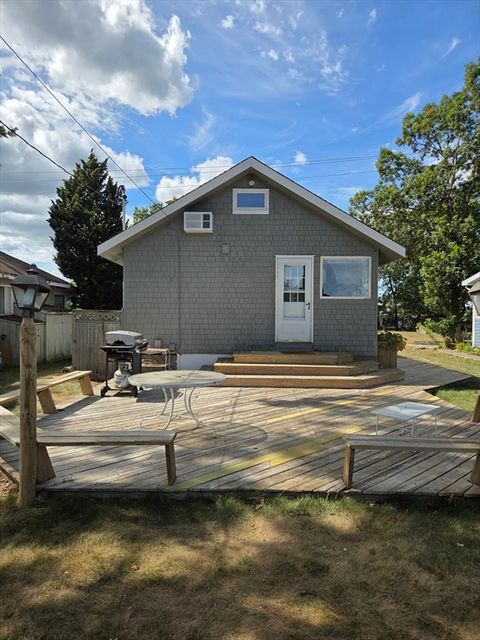
$389,000
2
bds
|
1
ba
|
888
sqft
|
built
1935
11 Fillmore St, Wareham, MA 02571
$-434
Cash flow
-5.8%
Cash-on-Cash Return
4.3%
Cap rate
0.6%
Rent to Value Ratio
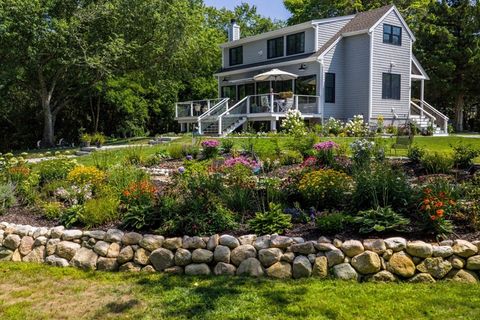
Active
$749,900
3
bds
|
3
ba
|
1,712
sqft
|
built
1930
26 Washington Dr, Wareham, MA 02571
$-1,218
Cash flow
-8.5%
Cash-on-Cash Return
3.7%
Cap rate
0.5%
Rent to Value Ratio
Active
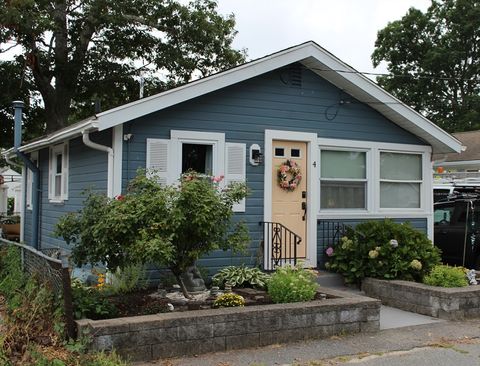
$299,999
2
bds
|
1
ba
|
480
sqft
|
built
1938
4 Greenwood Ave, Wareham, MA 02571
$-262
Cash flow
-4.6%
Cash-on-Cash Return
4.6%
Cap rate
0.7%
Rent to Value Ratio
Active
$1,100,000
4
bds
|
4
ba
|
2,463
sqft
|
built
1950
5 Franks Way, Wareham, MA 02571
$-3,649
Cash flow
-17.3%
Cash-on-Cash Return
1.7%
Cap rate
0.3%
Rent to Value Ratio
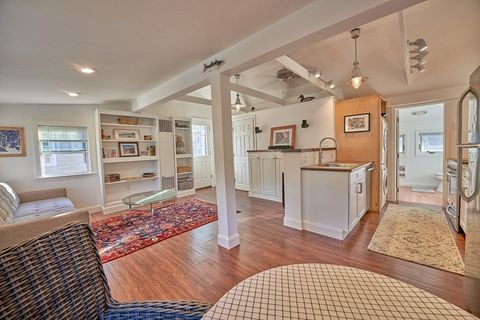
Active
$399,900
1
bds
|
1
ba
|
520
sqft
|
built
1920
5 Gardonia St, Wareham, MA 02571
$-932
Cash flow
-12.2%
Cash-on-Cash Return
2.9%
Cap rate
0.4%
Rent to Value Ratio
Active
$399,900
2
bds
|
2
ba
|
560
sqft
|
built
1925
2 Edward St, Wareham, MA 02571
$-775
Cash flow
-10.1%
Cash-on-Cash Return
3.4%
Cap rate
0.5%
Rent to Value Ratio
Active
$775,000
5
bds
|
3
ba
|
2,611
sqft
|
built
1972
10 Dowd Ave, Wareham, MA 02571
$-1,376
Cash flow
-9.3%
Cash-on-Cash Return
3.5%
Cap rate
0.5%
Rent to Value Ratio
Active
$620,000
5
bds
|
3
ba
|
2,960
sqft
|
built
1810
687 Main St, Wareham, MA 02571
$-383
Cash flow
-3.2%
Cash-on-Cash Return
4.9%
Cap rate
0.7%
Rent to Value Ratio
Active
$459,900
2
bds
|
1
ba
|
1,042
sqft
|
built
1900
45 Main St, Wareham, MA 02571
$-1,573
Cash flow
-17.8%
Cash-on-Cash Return
1.6%
Cap rate
0.5%
Rent to Value Ratio
Active
$399,000
2
bds
|
3
ba
|
1,387
sqft
|
built
1921
26 Highland Bay Dr, Wareham, MA 02571
$-282
Cash flow
-3.7%
Cash-on-Cash Return
4.8%
Cap rate
0.7%
Rent to Value Ratio
Active
$399,000
2
bds
|
1
ba
|
716
sqft
|
built
1945
8 Woodland Cir, Wareham, MA 02571
$-616
Cash flow
-8.1%
Cash-on-Cash Return
3.8%
Cap rate
0.6%
Rent to Value Ratio
Active
$729,900
3
bds
|
3
ba
|
3,202
sqft
|
built
1960
110 Mayflower Ridge Dr, Wareham, MA 02571
$-1,077
Cash flow
-7.7%
Cash-on-Cash Return
3.9%
Cap rate
0.6%
Rent to Value Ratio
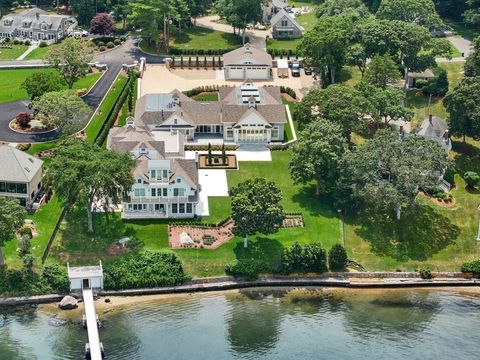
Active
$6,500,000
7
bds
|
6
ba
|
13,800
sqft
|
built
1900
46 Winship Ave, Wareham, MA 02571
$-27,958
Cash flow
-22.4%
Cash-on-Cash Return
0.5%
Cap rate
0.2%
Rent to Value Ratio
Active
$675,000
3
bds
|
2
ba
|
1,040
sqft
|
built
1993
192 Swifts Beach Rd, Wareham, MA 02571
$-1,602
Cash flow
-12.4%
Cash-on-Cash Return
2.8%
Cap rate
0.4%
Rent to Value Ratio
Active
$1,874,000
6
bds
|
4
ba
|
5,376
sqft
|
built
2016
5 Oak St, Wareham, MA 02571
$-8,481
Cash flow
-23.6%
Cash-on-Cash Return
0.2%
Cap rate
0.2%
Rent to Value Ratio
Active
$1,195,000
4
bds
|
2
ba
|
3,044
sqft
|
built
1940
57 Oak St, Wareham, MA 02571
$-3,484
Cash flow
-15.2%
Cash-on-Cash Return
2.2%
Cap rate
0.3%
Rent to Value Ratio