West Olive, MI Investment Properties for Sale
Browse homes for sale and investment properties in West Olive, MI. Refine your search by price, property type, or more.
Best cash flowing properties in West Olive, MI

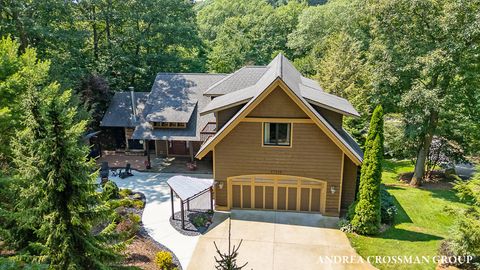
Active
$410,000
3
bds
|
3
ba
|
1,680
sqft
|
built
2019
14571 Bigleaf Dr, West Olive, MI 49460
$-500
Cash flow
-6.4%
Cash-on-Cash Return
4.7%
Cap rate
0.7%
Rent to Value Ratio

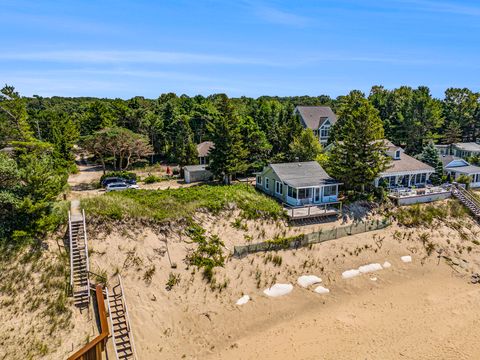
Active
$424,900
4
bds
|
3
ba
|
1,773
sqft
|
built
1977
15991 Croswell St, West Olive, MI 49460
$-603
Cash flow
-7.4%
Cash-on-Cash Return
4.4%
Cap rate
0.6%
Rent to Value Ratio
15 out of 17 properties for sale in West Olive, MI
Limited Results Shown
Create a free account, or log in to reveal all property listings and enjoy the complete experience.

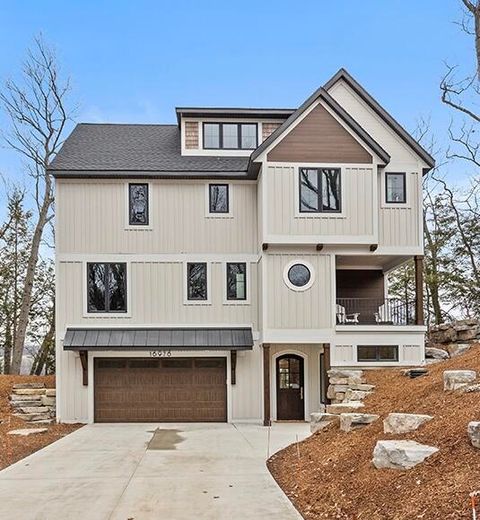
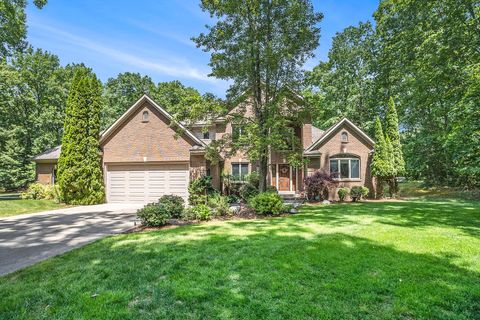
Active
$899,000
4
bds
|
3
ba
|
2,118
sqft
|
built
1977
9410 Whispering Sands Dr, West Olive, MI 49460
$-2,597
Cash flow
-15.1%
Cash-on-Cash Return
2.7%
Cap rate
0.5%
Rent to Value Ratio
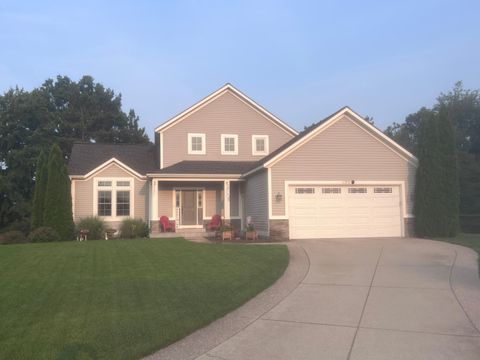
Active
$950,000
3
bds
|
3
ba
|
3,234
sqft
|
built
2007
17110 Pimento Hl, West Olive, MI 49460
$-2,788
Cash flow
-15.3%
Cash-on-Cash Return
2.6%
Cap rate
0.4%
Rent to Value Ratio

Active
$799,000
4
bds
|
3
ba
|
3,126
sqft
|
built
2018
16964 Fillmore St, West Olive, MI 49460
$-2,786
Cash flow
-18.2%
Cash-on-Cash Return
2.0%
Cap rate
0.3%
Rent to Value Ratio
Active
$995,000
2
bds
|
1
ba
|
864
sqft
|
built
1935
10589 Lakeshore Dr, West Olive, MI 49460
$-3,797
Cash flow
-19.9%
Cash-on-Cash Return
1.6%
Cap rate
0.3%
Rent to Value Ratio
Active
$2,375,000
5
bds
|
6
ba
|
3,629
sqft
|
built
2023
16976 Lake Ave, West Olive, MI 49460
$-9,109
Cash flow
-20.0%
Cash-on-Cash Return
1.5%
Cap rate
0.3%
Rent to Value Ratio
Active
$624,900
5
bds
|
4
ba
|
3,086
sqft
|
built
2007
9355 Windward Dr, West Olive, MI 49460
$-1,300
Cash flow
-10.9%
Cash-on-Cash Return
3.7%
Cap rate
0.6%
Rent to Value Ratio
Active
$1,397,500
6
bds
|
5
ba
|
5,494
sqft
|
built
2002
17055 Forest Lake Dr, West Olive, MI 49460
$-4,806
Cash flow
-17.9%
Cash-on-Cash Return
2.0%
Cap rate
0.3%
Rent to Value Ratio
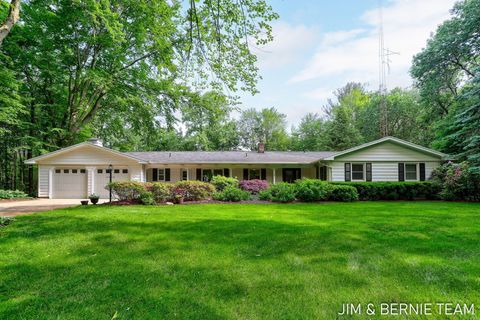
Active
$629,900
5
bds
|
4
ba
|
3,688
sqft
|
built
1969
8518 146th Ave, West Olive, MI 49460
$-1,450
Cash flow
-12.0%
Cash-on-Cash Return
3.4%
Cap rate
0.5%
Rent to Value Ratio
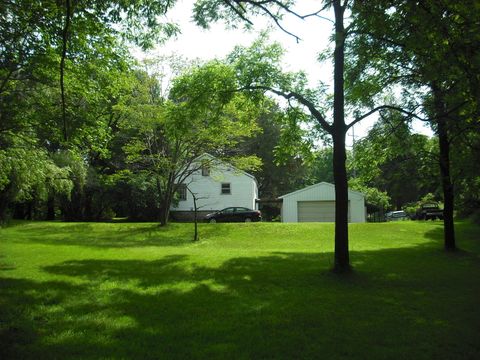
Active
$1,099,000
1
bds
|
1
ba
|
676
sqft
|
built
1945
17078 Lake Michigan Dr, West Olive, MI 49460
$-4,375
Cash flow
-20.8%
Cash-on-Cash Return
1.4%
Cap rate
0.2%
Rent to Value Ratio
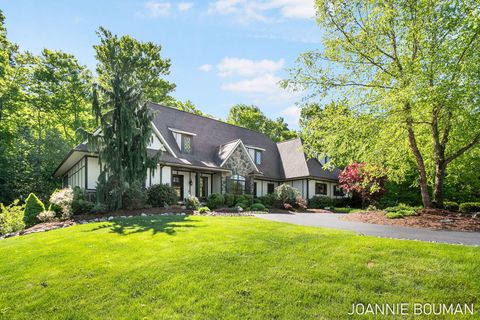
Active
$949,900
5
bds
|
5
ba
|
4,113
sqft
|
built
2010
15611 River Woods, West Olive, MI 49460
$-3,196
Cash flow
-17.6%
Cash-on-Cash Return
2.1%
Cap rate
0.4%
Rent to Value Ratio
Active
$1,355,000
5
bds
|
6
ba
|
6,732
sqft
|
built
2006
10543 Lakeshore Dr, West Olive, MI 49460
$-4,816
Cash flow
-18.5%
Cash-on-Cash Return
1.9%
Cap rate
0.3%
Rent to Value Ratio

Active
$774,499
4
bds
|
4
ba
|
3,027
sqft
|
built
1995
8894 Lakeshore Dr, West Olive, MI 49460
$-1,879
Cash flow
-12.7%
Cash-on-Cash Return
3.2%
Cap rate
0.5%
Rent to Value Ratio
Active
$809,900
4
bds
|
4
ba
|
4,331
sqft
|
built
1993
6340 Butternut Dr, West Olive, MI 49460
$-2,230
Cash flow
-14.4%
Cash-on-Cash Return
2.8%
Cap rate
0.6%
Rent to Value Ratio