West Palm Beach, FL Investment Properties for Sale
Browse homes for sale and investment properties in West Palm Beach, FL. Refine your search by price, property type, or more.
Best cash flowing properties in West Palm Beach, FL
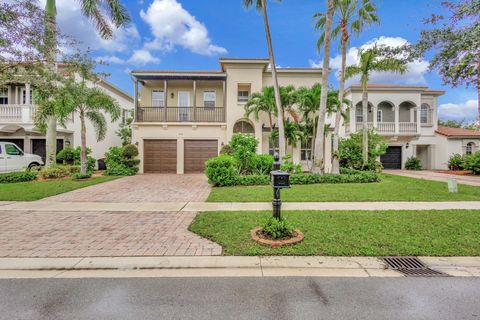
Active
$289,000
3
bds
|
1
ba
|
852
sqft
|
built
1953
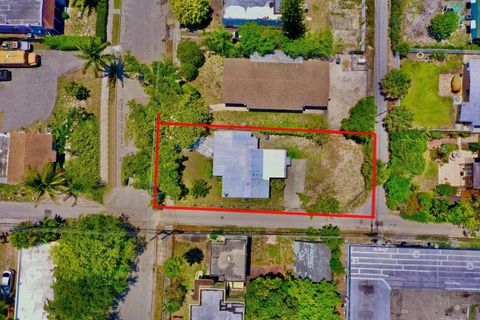
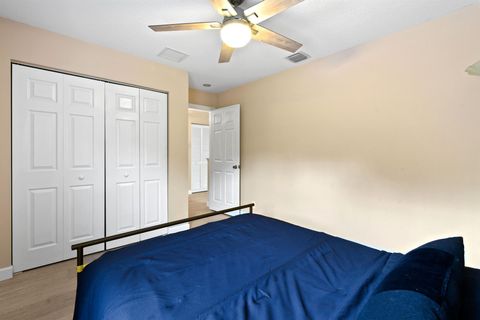
611 35th St, West Palm Beach, FL 33407
$17
Cash flow
0.3%
Cash-on-Cash Return
6.2%
Cap rate
0.9%
Rent to Value Ratio
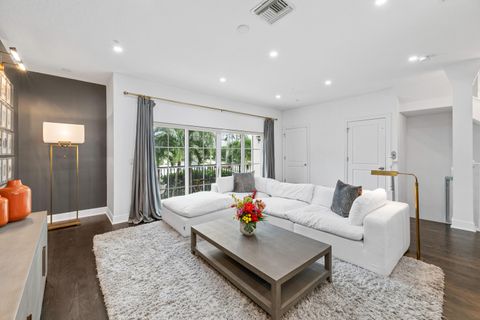
Active
$175,000
2
bds
|
2
ba
|
798
sqft
|
built
1969
205 Salisbury I, West Palm Beach, FL 33417
$-93
Cash flow
-2.8%
Cash-on-Cash Return
5.5%
Cap rate
1.0%
Rent to Value Ratio
1,297 out of 1,543 properties for sale in West Palm Beach, FL
Limited Results Shown
Create a free account, or log in to reveal all property listings and enjoy the complete experience.

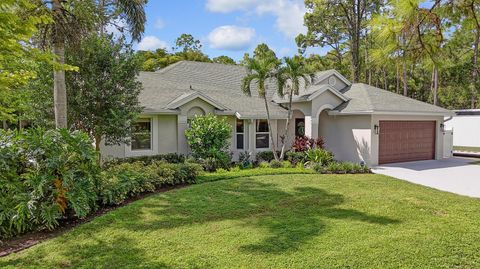
Active
$685,000
5
bds
|
4
ba
|
2,280
sqft
|
built
1959
1943 Iris Rd, West Palm Beach, FL 33415
$-863
Cash flow
-6.6%
Cash-on-Cash Return
4.6%
Cap rate
0.6%
Rent to Value Ratio
Active
$5,998,000
4
bds
|
5
ba
|
3,698
sqft
|
built
1928
112 Roosevelt Pl, West Palm Beach, FL 33405
$-30,932
Cash flow
-26.9%
Cash-on-Cash Return
0.0%
Cap rate
0.2%
Rent to Value Ratio

Active
$335,000
3
bds
|
3
ba
|
1,326
sqft
|
built
2006
833 Millbrae Ct, West Palm Beach, FL 33401
$-812
Cash flow
-12.6%
Cash-on-Cash Return
3.2%
Cap rate
0.8%
Rent to Value Ratio
Active
$1,950,000
4
bds
|
4
ba
|
3,693
sqft
|
built
1988
2388 Palm Harbor Dr, West Palm Beach, FL 33410
$-4,412
Cash flow
-11.8%
Cash-on-Cash Return
3.4%
Cap rate
0.5%
Rent to Value Ratio
Active
$449,000
2
bds
|
2
ba
|
1,250
sqft
|
built
1974
5200 N Flagler Dr, West Palm Beach, FL 33407
$-1,975
Cash flow
-22.9%
Cash-on-Cash Return
0.9%
Cap rate
0.8%
Rent to Value Ratio
Active
$175,000
2
bds
|
2
ba
|
798
sqft
|
built
1969
205 Salisbury I, West Palm Beach, FL 33417
$-93
Cash flow
-2.8%
Cash-on-Cash Return
5.5%
Cap rate
1.0%
Rent to Value Ratio
Active
$450,000
2
bds
|
1
ba
|
990
sqft
|
built
2001
651 Okeechobee Blvd, West Palm Beach, FL 33401
$-1,371
Cash flow
-15.9%
Cash-on-Cash Return
2.5%
Cap rate
0.8%
Rent to Value Ratio
Active
$164,999
2
bds
|
2
ba
|
1,064
sqft
|
built
1984
1009 Green Pine Blvd, West Palm Beach, FL 33409
$-458
Cash flow
-14.5%
Cash-on-Cash Return
2.8%
Cap rate
1.1%
Rent to Value Ratio

Active
$7,500,000
5
bds
|
5
ba
|
3,781
sqft
|
built
1988
2389 King Ter, West Palm Beach, FL 33414
$-35,865
Cash flow
-24.9%
Cash-on-Cash Return
0.4%
Cap rate
0.1%
Rent to Value Ratio

Active
$699,000
2
bds
|
2
ba
|
1,067
sqft
|
built
1950
1310 Worthington St, West Palm Beach, FL 33401
$-1,357
Cash flow
-10.1%
Cash-on-Cash Return
3.8%
Cap rate
0.5%
Rent to Value Ratio

Active
$4,995,000
5
bds
|
4
ba
|
3,325
sqft
|
built
1931
3109 Washington Rd, West Palm Beach, FL 33405
$-25,772
Cash flow
-26.9%
Cash-on-Cash Return
0.0%
Cap rate
0.2%
Rent to Value Ratio
Active
$660,000
3
bds
|
3
ba
|
2,084
sqft
|
built
1996
7064 Elkhorn Dr, West Palm Beach, FL 33411
$-1,704
Cash flow
-13.5%
Cash-on-Cash Return
3.0%
Cap rate
0.7%
Rent to Value Ratio
Active
$4,950,000
3
bds
|
4
ba
|
3,158
sqft
|
built
2023
200 Arkona Ct, West Palm Beach, FL 33401
$-29,680
Cash flow
-31.3%
Cash-on-Cash Return
-1.0%
Cap rate
0.2%
Rent to Value Ratio

Active
$510,000
3
bds
|
2
ba
|
1,525
sqft
|
built
2023
166 Neva Dr, West Palm Beach, FL 33415
$-644
Cash flow
-6.6%
Cash-on-Cash Return
4.6%
Cap rate
0.7%
Rent to Value Ratio
Active
$565,000
1
bds
|
2
ba
|
1,071
sqft
|
built
2006
801 S Olive Ave, West Palm Beach, FL 33401
$-1,510
Cash flow
-13.9%
Cash-on-Cash Return
2.9%
Cap rate
0.8%
Rent to Value Ratio

Active
$509,000
1
bds
|
1
ba
|
755
sqft
|
built
2008
550 Okeechobee Blvd, West Palm Beach, FL 33401
$-1,864
Cash flow
-19.1%
Cash-on-Cash Return
1.8%
Cap rate
0.6%
Rent to Value Ratio
Active
$665,000
2
bds
|
2
ba
|
1,245
sqft
|
built
2007
300 S Australian Ave, West Palm Beach, FL 33401
$-819
Cash flow
-6.4%
Cash-on-Cash Return
4.7%
Cap rate
0.9%
Rent to Value Ratio
Active
$275,000
2
bds
|
2
ba
|
1,236
sqft
|
built
1980
1530 Forest Lakes Cir, West Palm Beach, FL 33406
$-371
Cash flow
-7.0%
Cash-on-Cash Return
4.5%
Cap rate
0.9%
Rent to Value Ratio

Active
$599,900
bds
|
0
ba
|
1,509
sqft
|
built
1945
702 Fernwood Dr, West Palm Beach, FL 33405
$-1,484
Cash flow
-12.9%
Cash-on-Cash Return
3.2%
Cap rate
0.5%
Rent to Value Ratio

Active
$4,750,000
4
bds
|
4
ba
|
4,292
sqft
|
built
2006
12901 Marsh Lndg, West Palm Beach, FL 33418
$-20,880
Cash flow
-22.9%
Cash-on-Cash Return
0.9%
Cap rate
0.2%
Rent to Value Ratio

Active
$190,000
2
bds
|
2
ba
|
1,385
sqft
|
built
1987
2811 Village Blvd, West Palm Beach, FL 33409
$-524
Cash flow
-14.4%
Cash-on-Cash Return
2.8%
Cap rate
1.1%
Rent to Value Ratio

Active
$999,000
5
bds
|
3
ba
|
3,697
sqft
|
built
2002
9863 Royal Cardigan Way, West Palm Beach, FL 33411
$-1,921
Cash flow
-10.0%
Cash-on-Cash Return
3.8%
Cap rate
0.6%
Rent to Value Ratio

Active
$899,000
4
bds
|
3
ba
|
2,316
sqft
|
built
1960
8045 W Lake Dr, West Palm Beach, FL 33406
$-524
Cash flow
-3.0%
Cash-on-Cash Return
5.4%
Cap rate
0.8%
Rent to Value Ratio
Active
$1,300,000
5
bds
|
5
ba
|
4,345
sqft
|
built
2005
9232 Nugent Trl, West Palm Beach, FL 33411
$-2,160
Cash flow
-8.7%
Cash-on-Cash Return
4.2%
Cap rate
0.6%
Rent to Value Ratio
Active
$579,000
3
bds
|
4
ba
|
1,743
sqft
|
built
2006
1950 Presidential Way, West Palm Beach, FL 33401
$-2,352
Cash flow
-21.2%
Cash-on-Cash Return
1.3%
Cap rate
0.6%
Rent to Value Ratio

Active
$169,999
2
bds
|
1
ba
|
708
sqft
|
built
1991
1129 Lake Victoria Dr, West Palm Beach, FL 33411
$-193
Cash flow
-5.9%
Cash-on-Cash Return
4.8%
Cap rate
1.0%
Rent to Value Ratio

Active
$600,000
3
bds
|
2
ba
|
1,352
sqft
|
built
2020
1369 Rainbow Ave, West Palm Beach, FL 33406
$-784
Cash flow
-6.8%
Cash-on-Cash Return
4.6%
Cap rate
0.7%
Rent to Value Ratio
Active
$739,000
4
bds
|
3
ba
|
1,966
sqft
|
built
1993
13298 82nd Ln N, West Palm Beach, FL 33412
$-973
Cash flow
-6.9%
Cash-on-Cash Return
4.6%
Cap rate
0.6%
Rent to Value Ratio
Active
$305,900
2
bds
|
2
ba
|
1,168
sqft
|
built
1988
4345 Woodstock Dr, West Palm Beach, FL 33409
$-574
Cash flow
-9.8%
Cash-on-Cash Return
3.9%
Cap rate
0.8%
Rent to Value Ratio
Active
$710,000
4
bds
|
3
ba
|
2,084
sqft
|
built
2005
4576 Thornwood Cir, West Palm Beach, FL 33418
$-1,349
Cash flow
-9.9%
Cash-on-Cash Return
3.9%
Cap rate
0.6%
Rent to Value Ratio
Active
$349,000
2
bds
|
2
ba
|
1,170
sqft
|
built
1978
5600 N Flagler Dr, West Palm Beach, FL 33407
$-1,621
Cash flow
-24.2%
Cash-on-Cash Return
0.6%
Cap rate
0.8%
Rent to Value Ratio

Active
$299,000
3
bds
|
3
ba
|
1,510
sqft
|
built
1989
3204 Glenmoor Dr, West Palm Beach, FL 33409
$-862
Cash flow
-15.0%
Cash-on-Cash Return
2.7%
Cap rate
0.8%
Rent to Value Ratio
Active
$349,000
1
bds
|
1
ba
|
762
sqft
|
built
2006
600 S Dixie Hwy, West Palm Beach, FL 33401
$-1,499
Cash flow
-22.4%
Cash-on-Cash Return
1.0%
Cap rate
0.6%
Rent to Value Ratio
Active
$289,000
3
bds
|
1
ba
|
852
sqft
|
built
1953
611 35th St, West Palm Beach, FL 33407
$17
Cash flow
0.3%
Cash-on-Cash Return
6.2%
Cap rate
0.9%
Rent to Value Ratio
Active
$847,000
2
bds
|
2
ba
|
1,170
sqft
|
built
2008
701 S Olive Ave, West Palm Beach, FL 33401
$-2,836
Cash flow
-17.5%
Cash-on-Cash Return
2.1%
Cap rate
0.6%
Rent to Value Ratio
Active
$435,000
2
bds
|
2
ba
|
1,171
sqft
|
built
2006
403 S Sapodilla Ave, West Palm Beach, FL 33401
$-2,167
Cash flow
-26.0%
Cash-on-Cash Return
0.2%
Cap rate
0.7%
Rent to Value Ratio
Active
$365,000
2
bds
|
3
ba
|
1,322
sqft
|
built
2002
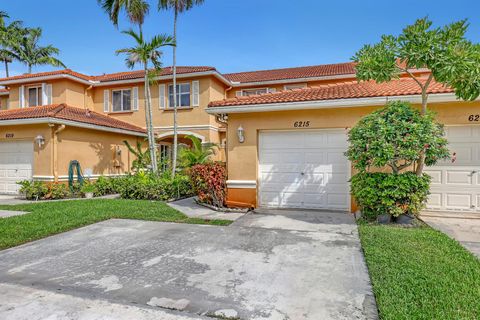
6215 Eaton St, West Palm Beach, FL 33411
$-598
Cash flow
-8.5%
Cash-on-Cash Return
4.2%
Cap rate
0.8%
Rent to Value Ratio

Active
$420,000
4
bds
|
4
ba
|
2,285
sqft
|
built
2006
430 Amador Ln, West Palm Beach, FL 33401
$-733
Cash flow
-9.1%
Cash-on-Cash Return
4.1%
Cap rate
1.0%
Rent to Value Ratio
Active
$620,000
4
bds
|
2
ba
|
1,799
sqft
|
built
1968
2301 Edgewater Dr, West Palm Beach, FL 33406
$-342
Cash flow
-2.9%
Cash-on-Cash Return
5.5%
Cap rate
0.8%
Rent to Value Ratio

Active
$575,000
3
bds
|
2
ba
|
2,124
sqft
|
built
1954
2322 S Haverhill Rd, West Palm Beach, FL 33415
$-1,289
Cash flow
-11.7%
Cash-on-Cash Return
3.5%
Cap rate
0.5%
Rent to Value Ratio