West Palm Beach, FL Investment Properties for Sale
Browse homes for sale and investment properties in West Palm Beach, FL. Refine your search by price, property type, or more.
Best cash flowing properties in West Palm Beach, FL

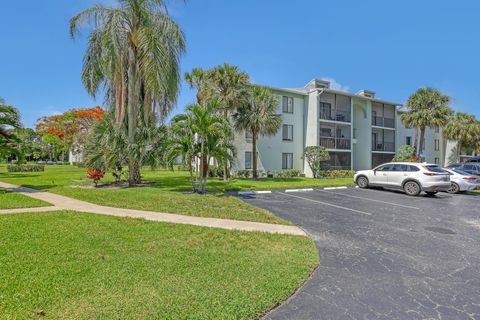
Active
$199,000
2
bds
|
2
ba
|
1,985
sqft
|
built
1985
3521 Village Blvd, West Palm Beach, FL 33409
$-54
Cash flow
-1.4%
Cash-on-Cash Return
5.8%
Cap rate
1.3%
Rent to Value Ratio

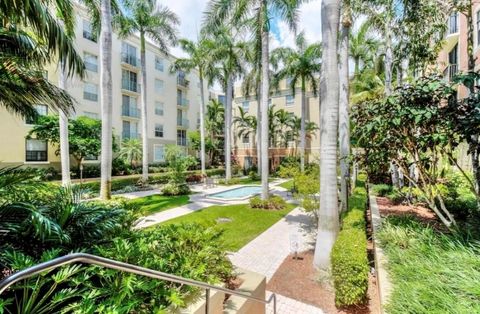
Active
$244,900
2
bds
|
2
ba
|
1,026
sqft
|
built
1978
5957 Forest Hill Blvd, West Palm Beach, FL 33415
$-220
Cash flow
-4.7%
Cash-on-Cash Return
5.1%
Cap rate
0.9%
Rent to Value Ratio
1,297 out of 1,543 properties for sale in West Palm Beach, FL
Limited Results Shown
Create a free account, or log in to reveal all property listings and enjoy the complete experience.
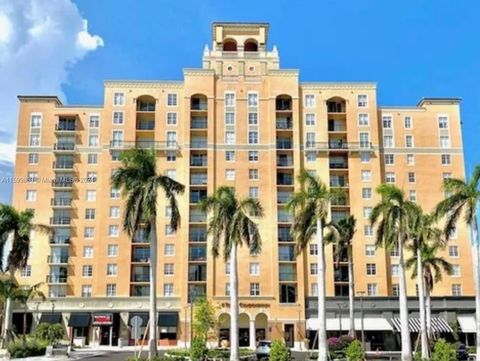
Active
$620,000
4
bds
|
0
ba
|
1,664
sqft
|
built
1967
9209 Sun Ct, West Palm Beach, FL 33403
$-2,487
Cash flow
-20.9%
Cash-on-Cash Return
1.3%
Cap rate
0.3%
Rent to Value Ratio
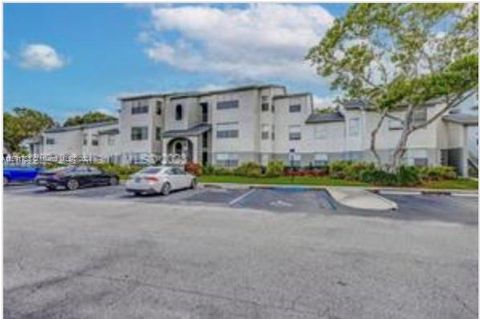
Active
$335,000
3
bds
|
2
ba
|
1,268
sqft
|
built
1989
4560 Grand Cypress Rd, West Palm Beach, FL 33417
$-512
Cash flow
-8.0%
Cash-on-Cash Return
4.3%
Cap rate
0.9%
Rent to Value Ratio
Active
$244,900
2
bds
|
2
ba
|
1,026
sqft
|
built
1978
5957 Forest Hill Blvd, West Palm Beach, FL 33415
$-220
Cash flow
-4.7%
Cash-on-Cash Return
5.1%
Cap rate
0.9%
Rent to Value Ratio
Active
$352,999
3
bds
|
3
ba
|
1,683
sqft
|
built
1986
4371 Willow Pond Rd, West Palm Beach, FL 33417
$-651
Cash flow
-9.6%
Cash-on-Cash Return
3.9%
Cap rate
0.8%
Rent to Value Ratio

Active
$495,000
3
bds
|
2
ba
|
1,314
sqft
|
built
1958
2315 Summit Blvd, West Palm Beach, FL 33406
$-744
Cash flow
-7.8%
Cash-on-Cash Return
4.3%
Cap rate
0.6%
Rent to Value Ratio

Active
$409,000
2
bds
|
2
ba
|
1,250
sqft
|
built
1974
5200 N Flagler Dr, West Palm Beach, FL 33407
$-2,570
Cash flow
-32.8%
Cash-on-Cash Return
-1.4%
Cap rate
0.5%
Rent to Value Ratio

Active
$1,739,000
4
bds
|
4
ba
|
3,932
sqft
|
built
2011
13418 Sand Ridge Rd, West Palm Beach, FL 33418
$-3,596
Cash flow
-10.8%
Cash-on-Cash Return
3.7%
Cap rate
0.6%
Rent to Value Ratio

Active
$649,000
1
bds
|
2
ba
|
895
sqft
|
built
2008
701 S Olive Ave, West Palm Beach, FL 33401
$-2,396
Cash flow
-19.3%
Cash-on-Cash Return
1.7%
Cap rate
0.5%
Rent to Value Ratio
Active
$379,000
1
bds
|
1
ba
|
765
sqft
|
built
2001
630 S Sapodilla Ave, West Palm Beach, FL 33401
$-1,311
Cash flow
-18.0%
Cash-on-Cash Return
2.0%
Cap rate
0.6%
Rent to Value Ratio

Active
$183,000
2
bds
|
2
ba
|
900
sqft
|
built
1986
1482 Lake Crystal Dr, West Palm Beach, FL 33411
$-325
Cash flow
-9.3%
Cash-on-Cash Return
4.0%
Cap rate
1.0%
Rent to Value Ratio

Active
$255,000
1
bds
|
1
ba
|
740
sqft
|
built
2006
6492 Emerald Dunes Dr, West Palm Beach, FL 33411
$-502
Cash flow
-10.3%
Cash-on-Cash Return
3.8%
Cap rate
0.8%
Rent to Value Ratio

Active
$220,000
2
bds
|
1
ba
|
909
sqft
|
built
1990
1401 Village Blvd, West Palm Beach, FL 33409
$-695
Cash flow
-16.5%
Cash-on-Cash Return
2.4%
Cap rate
0.8%
Rent to Value Ratio
Active
$199,000
2
bds
|
2
ba
|
1,985
sqft
|
built
1985
3521 Village Blvd, West Palm Beach, FL 33409
$-54
Cash flow
-1.4%
Cash-on-Cash Return
5.8%
Cap rate
1.3%
Rent to Value Ratio
Active
$235,000
2
bds
|
2
ba
|
1,064
sqft
|
built
1985
3612 Alder Dr, West Palm Beach, FL 33417
$-474
Cash flow
-10.5%
Cash-on-Cash Return
3.7%
Cap rate
0.9%
Rent to Value Ratio

Active
$4,450,000
4
bds
|
5
ba
|
2,785
sqft
|
built
1924
231 Sunset Rd, West Palm Beach, FL 33401
$-21,460
Cash flow
-25.2%
Cash-on-Cash Return
0.4%
Cap rate
0.2%
Rent to Value Ratio

Active
$549,000
3
bds
|
2
ba
|
1,471
sqft
|
built
1988
9358 Heathridge Dr, West Palm Beach, FL 33411
$-1,293
Cash flow
-12.3%
Cash-on-Cash Return
3.3%
Cap rate
0.7%
Rent to Value Ratio

Active
$2,490,000
2
bds
|
3
ba
|
2,411
sqft
|
built
2004
201 S Narcissus Ave, West Palm Beach, FL 33401
$-10,913
Cash flow
-22.9%
Cash-on-Cash Return
0.9%
Cap rate
0.3%
Rent to Value Ratio

Active
$449,000
2
bds
|
2
ba
|
2,347
sqft
|
built
2004
7575 Orchid Hammock Dr, West Palm Beach, FL 33412
$-939
Cash flow
-10.9%
Cash-on-Cash Return
3.6%
Cap rate
1.0%
Rent to Value Ratio

Active
$825,000
2
bds
|
2
ba
|
1,086
sqft
|
built
1973
1801 S Flagler Dr, West Palm Beach, FL 33401
$-3,320
Cash flow
-21.0%
Cash-on-Cash Return
1.3%
Cap rate
0.5%
Rent to Value Ratio
Active
$460,000
2
bds
|
2
ba
|
1,120
sqft
|
built
2001
630 S Sapodilla Ave, West Palm Beach, FL 33401
$-1,534
Cash flow
-17.4%
Cash-on-Cash Return
2.1%
Cap rate
0.7%
Rent to Value Ratio

Active
$360,000
1
bds
|
1
ba
|
756
sqft
|
built
2001
630 S Sapodilla Ave, West Palm Beach, FL 33401
$-1,064
Cash flow
-15.4%
Cash-on-Cash Return
2.6%
Cap rate
0.7%
Rent to Value Ratio
Active
$300,000
1
bds
|
1
ba
|
705
sqft
|
built
2001
651 Okeechobee Blvd, West Palm Beach, FL 33401
$-1,044
Cash flow
-18.2%
Cash-on-Cash Return
2.0%
Cap rate
0.8%
Rent to Value Ratio

Active
$8,875,000
5
bds
|
6
ba
|
0
sqft
|
built
2024
7905 S Flagler Dr, West Palm Beach, FL 33405
$-39,684
Cash flow
-23.3%
Cash-on-Cash Return
0.8%
Cap rate
0.1%
Rent to Value Ratio
Active
$217,900
2
bds
|
1
ba
|
909
sqft
|
built
1990
1401 Village Blvd, West Palm Beach, FL 33409
$-585
Cash flow
-14.0%
Cash-on-Cash Return
2.9%
Cap rate
0.8%
Rent to Value Ratio
Active
$2,350,000
5
bds
|
5
ba
|
4,228
sqft
|
built
2005
7030 Isla Vista Dr, West Palm Beach, FL 33412
$-7,564
Cash flow
-16.8%
Cash-on-Cash Return
2.3%
Cap rate
0.4%
Rent to Value Ratio
Active
$2,060,000
3
bds
|
3
ba
|
3,019
sqft
|
built
1999
15314 70th Trl N, West Palm Beach, FL 33418
$-4,546
Cash flow
-11.5%
Cash-on-Cash Return
3.5%
Cap rate
0.5%
Rent to Value Ratio

Active
$22,900,000
4
bds
|
6
ba
|
4,986
sqft
|
built
2020
1100 S Flagler Dr, West Palm Beach, FL 33401
$-142,382
Cash flow
-32.4%
Cash-on-Cash Return
-1.3%
Cap rate
0.0%
Rent to Value Ratio

Active
$1,099,999
4
bds
|
5
ba
|
2,700
sqft
|
built
1994
15857 87th Trl N, West Palm Beach, FL 33418
$-2,368
Cash flow
-11.2%
Cash-on-Cash Return
3.6%
Cap rate
0.5%
Rent to Value Ratio
Active
$799,000
2
bds
|
2
ba
|
1,373
sqft
|
built
2008
701 S Olive Ave, West Palm Beach, FL 33401
$-1,899
Cash flow
-12.4%
Cash-on-Cash Return
3.3%
Cap rate
0.7%
Rent to Value Ratio
Active
$599,000
2
bds
|
2
ba
|
1,926
sqft
|
built
1981
13257 Touchstone Pl, West Palm Beach, FL 33418
$-1,390
Cash flow
-12.1%
Cash-on-Cash Return
3.4%
Cap rate
0.7%
Rent to Value Ratio
Active
$1,150,000
3
bds
|
2
ba
|
1,728
sqft
|
built
1973
1801 S Flagler Dr, West Palm Beach, FL 33401
$-4,083
Cash flow
-18.5%
Cash-on-Cash Return
1.9%
Cap rate
0.6%
Rent to Value Ratio
Active
$395,000
2
bds
|
2
ba
|
1,206
sqft
|
built
1972
2000 Presidential Way, West Palm Beach, FL 33401
$-1,240
Cash flow
-16.4%
Cash-on-Cash Return
2.4%
Cap rate
0.8%
Rent to Value Ratio

Active
$559,900
2
bds
|
2
ba
|
1,299
sqft
|
built
2001
630 S Sapodilla Ave, West Palm Beach, FL 33401
$-1,482
Cash flow
-13.8%
Cash-on-Cash Return
3.0%
Cap rate
0.8%
Rent to Value Ratio

Active
$247,500
2
bds
|
2
ba
|
1,111
sqft
|
built
1984
1010 Green Pine Blvd, West Palm Beach, FL 33409
$-608
Cash flow
-12.8%
Cash-on-Cash Return
3.2%
Cap rate
0.9%
Rent to Value Ratio
Active
$4,595,000
2
bds
|
3
ba
|
1,516
sqft
|
built
2023
200 Arkona Ct, West Palm Beach, FL 33401
$-21,119
Cash flow
-24.0%
Cash-on-Cash Return
0.6%
Cap rate
0.2%
Rent to Value Ratio

Active
$309,900
2
bds
|
3
ba
|
1,326
sqft
|
built
2006
660 Amador Ln, West Palm Beach, FL 33401
$-898
Cash flow
-15.1%
Cash-on-Cash Return
2.7%
Cap rate
0.9%
Rent to Value Ratio

Active
$205,000
2
bds
|
2
ba
|
986
sqft
|
built
1976
2106 Sherwood Forest Blvd, West Palm Beach, FL 33415
$-331
Cash flow
-8.4%
Cash-on-Cash Return
4.2%
Cap rate
1.0%
Rent to Value Ratio

Active
$1,299,000
4
bds
|
4
ba
|
3,683
sqft
|
built
2006
13172 88th Pl N, West Palm Beach, FL 33412
$-1,611
Cash flow
-6.5%
Cash-on-Cash Return
4.7%
Cap rate
0.6%
Rent to Value Ratio

Active
$12,850,000
4
bds
|
5
ba
|
3,933
sqft
|
built
1950
250 Essex Ln, West Palm Beach, FL 33405
$-61,553
Cash flow
-25.0%
Cash-on-Cash Return
0.4%
Cap rate
0.1%
Rent to Value Ratio

Active
$1,300,000
2
bds
|
1
ba
|
800
sqft
|
built
1962
5133 Pine Grove Dr, West Palm Beach, FL 33417
$-5,092
Cash flow
-20.4%
Cash-on-Cash Return
1.4%
Cap rate
0.2%
Rent to Value Ratio