Whittier, CA Investment Properties for Sale
Browse homes for sale and investment properties in Whittier, CA. Refine your search by price, property type, or more.
Best cash flowing properties in Whittier, CA
Active
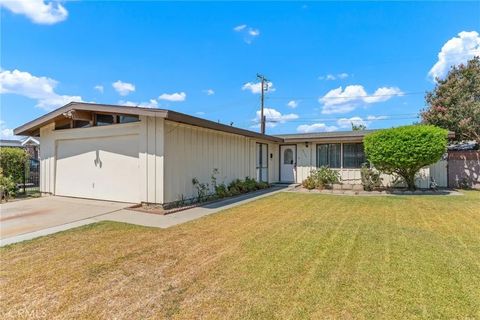
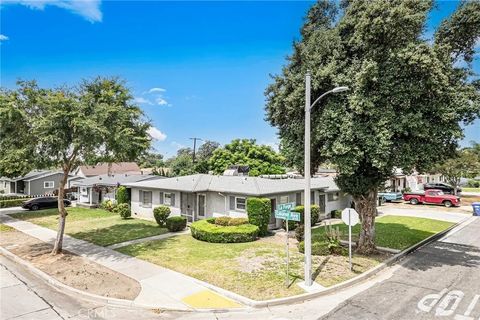
$670,000
4
bds
|
2
ba
|
1,269
sqft
|
built
1954
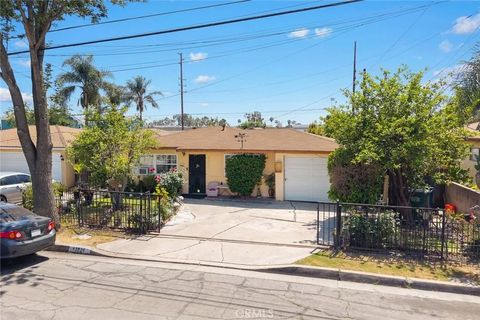
8429 Decosta Ave, Whittier, CA 90606
$-973
Cash flow
-7.6%
Cash-on-Cash Return
4.3%
Cap rate
0.5%
Rent to Value Ratio
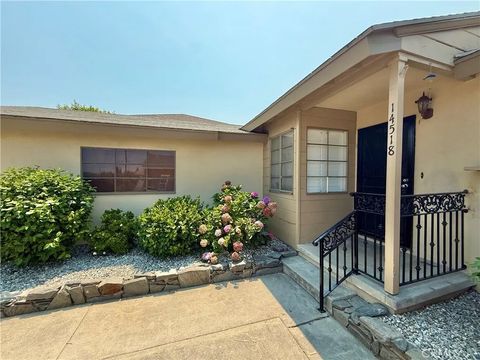
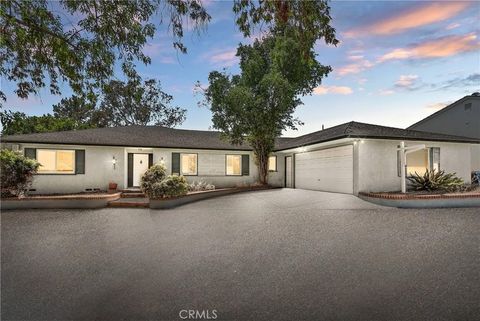
Active
$788,888
3
bds
|
2
ba
|
1,270
sqft
|
built
1956
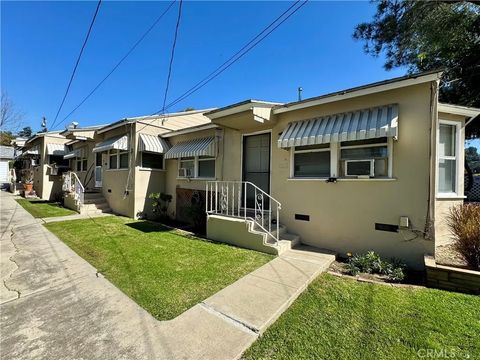
14518 Rimgate Dr, Whittier, CA 90604
$-1,505
Cash flow
-10.0%
Cash-on-Cash Return
3.8%
Cap rate
0.5%
Rent to Value Ratio
20 out of 118 properties for sale in Whittier, CA
Limited Results Shown
Create a free account, or log in to reveal all property listings and enjoy the complete experience.
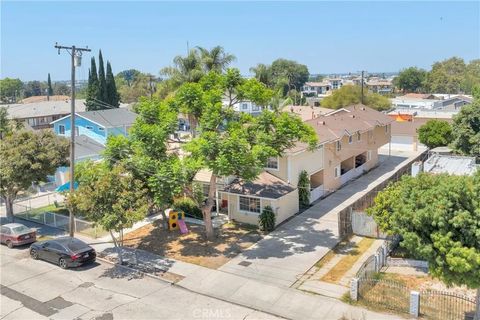
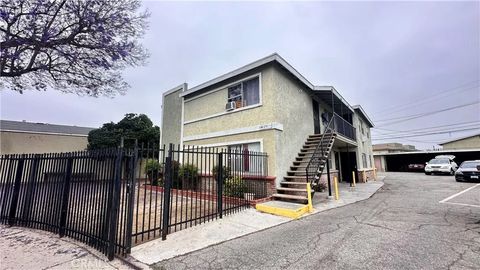
Active
$1,300,000
9
bds
|
7
ba
|
0
sqft
|
built
1995
8011 Comstock Ave, Whittier, CA 90602
$-4,849
Cash flow
-19.5%
Cash-on-Cash Return
1.6%
Cap rate
0.2%
Rent to Value Ratio
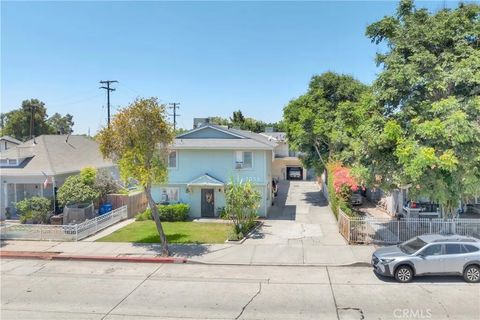
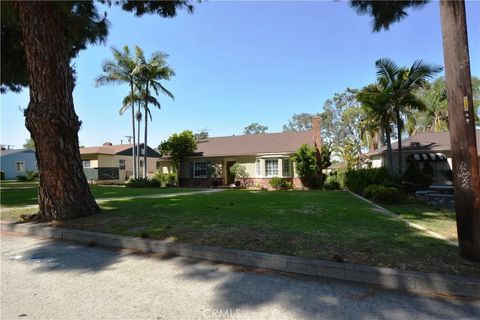
Active
$1,200,000
4
bds
|
3
ba
|
0
sqft
|
built
1986
7053 Pickering Ave, Whittier, CA 90602
$-4,136
Cash flow
-18.0%
Cash-on-Cash Return
1.9%
Cap rate
0.2%
Rent to Value Ratio
Active
$1,000,000
6
bds
|
0
ba
|
0
sqft
|
built
1923
7944 Comstock Ave, Whittier, CA 90602
$-3,539
Cash flow
-18.5%
Cash-on-Cash Return
1.8%
Cap rate
0.2%
Rent to Value Ratio
Active
$1,699,000
7
bds
|
6
ba
|
0
sqft
|
built
1936
8146 Bright Ave, Whittier, CA 90602
$-6,107
Cash flow
-18.8%
Cash-on-Cash Return
1.8%
Cap rate
0.2%
Rent to Value Ratio
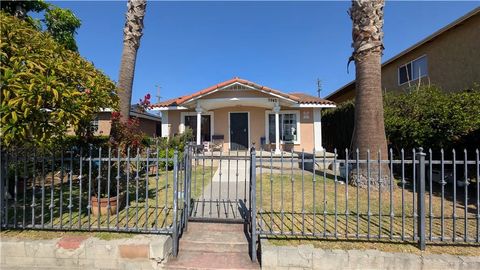
Active
$1,425,000
6
bds
|
4
ba
|
0
sqft
|
built
1910
7251 Painter Ave, Whittier, CA 90602
$-5,067
Cash flow
-18.6%
Cash-on-Cash Return
1.8%
Cap rate
0.2%
Rent to Value Ratio
Active
$875,000
3
bds
|
2
ba
|
1,740
sqft
|
built
1950
8603 Laurel Ave, Whittier, CA 90605
$-1,871
Cash flow
-11.2%
Cash-on-Cash Return
3.5%
Cap rate
0.4%
Rent to Value Ratio
Active
$1,249,000
6
bds
|
2
ba
|
0
sqft
|
built
1956
10849 Inez St, Whittier, CA 90605
$-4,177
Cash flow
-17.4%
Cash-on-Cash Return
2.1%
Cap rate
0.2%
Rent to Value Ratio
Active
$879,000
2
bds
|
2
ba
|
0
sqft
|
built
1941
7932 Rhea Vista Dr, Whittier, CA 90602
$-2,444
Cash flow
-14.5%
Cash-on-Cash Return
2.7%
Cap rate
0.3%
Rent to Value Ratio
Active
$1,250,000
4
bds
|
4
ba
|
0
sqft
|
built
1923
6233 Haviland Ave, Whittier, CA 90601
$-4,458
Cash flow
-18.6%
Cash-on-Cash Return
1.8%
Cap rate
0.2%
Rent to Value Ratio
Active
$1,250,000
4
bds
|
3
ba
|
0
sqft
|
built
1954
13833 Ramona Dr, Whittier, CA 90605
$-4,182
Cash flow
-17.5%
Cash-on-Cash Return
2.1%
Cap rate
0.2%
Rent to Value Ratio
Active
$849,900
4
bds
|
2
ba
|
1,798
sqft
|
built
1950
8723 Laurel Ave, Whittier, CA 90605
$-1,607
Cash flow
-9.9%
Cash-on-Cash Return
3.8%
Cap rate
0.5%
Rent to Value Ratio
Active
$975,000
4
bds
|
3
ba
|
2,472
sqft
|
built
1953
6285 Hill Ave, Whittier, CA 90601
$-1,756
Cash flow
-9.4%
Cash-on-Cash Return
3.9%
Cap rate
0.5%
Rent to Value Ratio
Active
$1,250,000
8
bds
|
4
ba
|
0
sqft
|
built
1959
10241 Ruoff Ave, Whittier, CA 90604
$-4,320
Cash flow
-18.0%
Cash-on-Cash Return
1.9%
Cap rate
0.2%
Rent to Value Ratio
Active
$925,000
4
bds
|
2
ba
|
1,884
sqft
|
built
1941
11514 Beverly Blvd, Whittier, CA 90601
$-2,262
Cash flow
-12.8%
Cash-on-Cash Return
3.1%
Cap rate
0.4%
Rent to Value Ratio
Active
$2,400,000
8
bds
|
8
ba
|
0
sqft
|
built
1961
5655 Pickering Ave, Whittier, CA 90601
$-10,618
Cash flow
-23.1%
Cash-on-Cash Return
0.8%
Cap rate
0.1%
Rent to Value Ratio
Active
$1,200,000
8
bds
|
4
ba
|
0
sqft
|
built
1960
12718 Shreve Rd, Whittier, CA 90602
$-4,067
Cash flow
-17.7%
Cash-on-Cash Return
2.0%
Cap rate
0.2%
Rent to Value Ratio
Active
$849,999
4
bds
|
2
ba
|
0
sqft
|
built
1923
7949 Washington Ave, Whittier, CA 90602
$-2,297
Cash flow
-14.1%
Cash-on-Cash Return
2.8%
Cap rate
0.3%
Rent to Value Ratio
Active
$975,000
4
bds
|
3
ba
|
0
sqft
|
built
1949
13751 Penn St, Whittier, CA 90602
$-2,722
Cash flow
-14.6%
Cash-on-Cash Return
2.7%
Cap rate
0.3%
Rent to Value Ratio