Ozaukee County Investment Properties for Sale
Browse homes for sale and investment properties in Ozaukee County. Refine your search by price, property type, or more.
Best cash flowing properties in Ozaukee County
Active
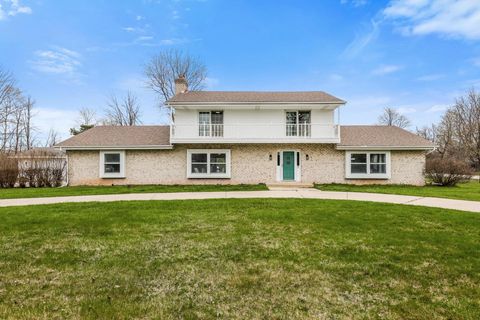
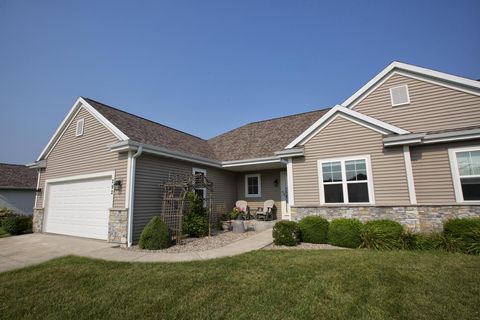
$224,900
2
bds
|
2
ba
|
1,120
sqft
|
built
1998
628 W Hillcrest Rd, Saukville, WI 53080
$-692
Cash flow
-16.1%
Cash-on-Cash Return
2.5%
Cap rate
0.6%
Rent to Value Ratio
Active
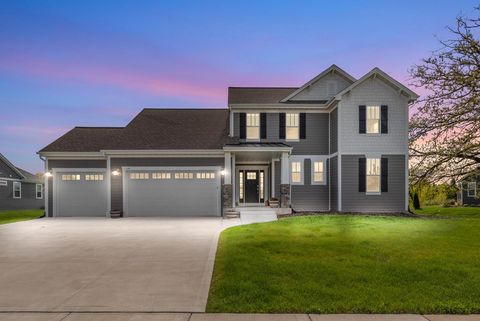
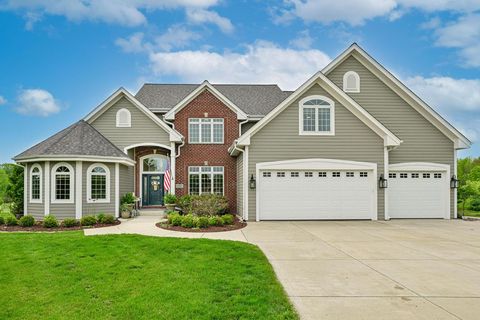
$360,900
3
bds
|
2
ba
|
1,509
sqft
|
built
1997
937 Iyla Ave, Belgium, WI 53004
$-824
Cash flow
-11.9%
Cash-on-Cash Return
3.4%
Cap rate
0.6%
Rent to Value Ratio
28 out of 87 properties for sale in Ozaukee County
Limited Results Shown
Create a free account, or log in to reveal all property listings and enjoy the complete experience.
Active
$1,425,000
4
bds
|
3
ba
|
4,624
sqft
|
built
1995
889 Horns Corners Rd, Cedarburg, WI 53012
$-5,620
Cash flow
-20.6%
Cash-on-Cash Return
1.4%
Cap rate
0.3%
Rent to Value Ratio

Active
$750,000
2
bds
|
2
ba
|
2,411
sqft
|
built
2020
307 E Pier St, Port Washington, WI 53074
$-2,421
Cash flow
-16.8%
Cash-on-Cash Return
2.3%
Cap rate
0.5%
Rent to Value Ratio

Active
$668,500
4
bds
|
2
ba
|
2,350
sqft
|
built
2021
1946 N Cora Dr, Grafton, WI 53024
$-1,670
Cash flow
-13.0%
Cash-on-Cash Return
3.1%
Cap rate
0.5%
Rent to Value Ratio
Active
$1,595,000
5
bds
|
3
ba
|
5,175
sqft
|
built
1973
8704 W Bonniwell Rd, Mequon, WI 53097
$-7,208
Cash flow
-23.6%
Cash-on-Cash Return
0.7%
Cap rate
0.2%
Rent to Value Ratio

Active
$1,050,000
3
bds
|
2
ba
|
3,240
sqft
|
built
1968
1104 Noridge Trl, Port Washington, WI 53074
$-3,679
Cash flow
-18.3%
Cash-on-Cash Return
1.9%
Cap rate
0.3%
Rent to Value Ratio

Active
$759,000
2
bds
|
2
ba
|
1,384
sqft
|
built
2021
324 N Lake St, Port Washington, WI 53074
$-3,180
Cash flow
-21.9%
Cash-on-Cash Return
1.1%
Cap rate
0.4%
Rent to Value Ratio
Active
$599,900
3
bds
|
2
ba
|
3,294
sqft
|
built
1978
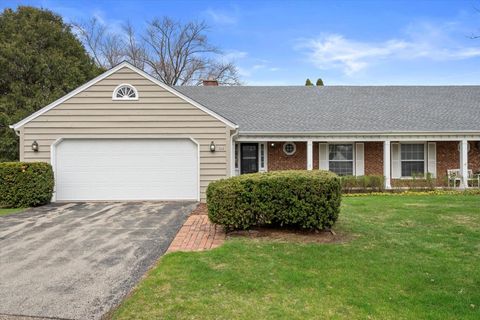
812 W Glen Oaks Ln, Mequon, WI 53092
$-1,770
Cash flow
-15.4%
Cash-on-Cash Return
2.6%
Cap rate
0.4%
Rent to Value Ratio
Active
$649,900
3
bds
|
2
ba
|
2,347
sqft
|
built
2022
160 Candleberry Ln, Grafton, WI 53024
$-2,167
Cash flow
-17.4%
Cash-on-Cash Return
2.1%
Cap rate
0.4%
Rent to Value Ratio

Active
$380,000
2
bds
|
2
ba
|
1,552
sqft
|
built
2002
1910 Cedar Dr, Grafton, WI 53024
$-1,618
Cash flow
-22.2%
Cash-on-Cash Return
1.0%
Cap rate
0.4%
Rent to Value Ratio

Active
$525,000
2
bds
|
2
ba
|
2,139
sqft
|
built
1984
10109 N Charter Mall, Mequon, WI 53092
$-2,165
Cash flow
-21.5%
Cash-on-Cash Return
1.2%
Cap rate
0.3%
Rent to Value Ratio

Active
$745,000
2
bds
|
0
ba
|
2,357
sqft
|
built
2020
303 E Pier St, Port Washington, WI 53074
$-2,274
Cash flow
-15.9%
Cash-on-Cash Return
2.5%
Cap rate
0.4%
Rent to Value Ratio
Active
$659,000
4
bds
|
2
ba
|
3,289
sqft
|
built
1991
1521 W Eastbrook Dr, Mequon, WI 53092
$-2,845
Cash flow
-22.5%
Cash-on-Cash Return
1.0%
Cap rate
0.3%
Rent to Value Ratio
Active
$345,000
4
bds
|
1
ba
|
1,525
sqft
|
built
1966
248 E Norport Dr, Port Washington, WI 53074
$-848
Cash flow
-12.8%
Cash-on-Cash Return
3.2%
Cap rate
0.5%
Rent to Value Ratio

Active
$1,650,000
4
bds
|
4
ba
|
7,600
sqft
|
built
1991
10113 N Vintage Ct, Mequon, WI 53092
$-6,326
Cash flow
-20.0%
Cash-on-Cash Return
1.5%
Cap rate
0.3%
Rent to Value Ratio
Active
$399,000
4
bds
|
3
ba
|
2,442
sqft
|
built
2017
292 E Redding Cir, Belgium, WI 53004
$-1,436
Cash flow
-18.8%
Cash-on-Cash Return
1.8%
Cap rate
0.5%
Rent to Value Ratio
Active
$1,099,000
4
bds
|
3
ba
|
4,584
sqft
|
built
2006
13345 N Laurel Ln, Mequon, WI 53097
$-3,217
Cash flow
-15.3%
Cash-on-Cash Return
2.6%
Cap rate
0.4%
Rent to Value Ratio
Active
$799,900
5
bds
|
4
ba
|
4,724
sqft
|
built
1998
8024 W Poplar Dr, Mequon, WI 53097
$-3,267
Cash flow
-21.3%
Cash-on-Cash Return
1.2%
Cap rate
0.3%
Rent to Value Ratio
Active
$730,000
3
bds
|
2
ba
|
1,974
sqft
|
built
2022
10588 N Coneflower Ct, Mequon, WI 53097
$-1,964
Cash flow
-14.0%
Cash-on-Cash Return
2.9%
Cap rate
0.5%
Rent to Value Ratio
Active
$549,900
4
bds
|
2
ba
|
3,086
sqft
|
built
1965
1074 Ulao Pkwy, Grafton, WI 53024
$-2,003
Cash flow
-19.0%
Cash-on-Cash Return
1.8%
Cap rate
0.3%
Rent to Value Ratio
Active
$549,000
3
bds
|
2
ba
|
2,800
sqft
|
built
1981
10734 N Magnolia Dr, Mequon, WI 53092
$-2,151
Cash flow
-20.4%
Cash-on-Cash Return
1.4%
Cap rate
0.3%
Rent to Value Ratio
Active
$599,000
4
bds
|
2
ba
|
1,867
sqft
|
built
1974
1111 Wauwatosa Rd, Cedarburg, WI 53012
$-2,465
Cash flow
-21.5%
Cash-on-Cash Return
1.2%
Cap rate
0.2%
Rent to Value Ratio
Active
$1,500,000
3
bds
|
2
ba
|
2,500
sqft
|
built
2024
13480 N Lakewood Dr, Mequon, WI 53097
$-4,874
Cash flow
-17.0%
Cash-on-Cash Return
2.2%
Cap rate
0.3%
Rent to Value Ratio
Active
$449,000
3
bds
|
2
ba
|
2,291
sqft
|
built
1974
934 W Shaker Cir, Mequon, WI 53092
$-1,560
Cash flow
-18.1%
Cash-on-Cash Return
2.0%
Cap rate
0.4%
Rent to Value Ratio

Active
$1,199,900
5
bds
|
5
ba
|
6,949
sqft
|
built
2004
1626 Fox Hollow Ln, Cedarburg, WI 53012
$-5,270
Cash flow
-22.9%
Cash-on-Cash Return
0.9%
Cap rate
0.2%
Rent to Value Ratio
Active
$2,700,000
5
bds
|
3
ba
|
6,687
sqft
|
built
2020
10122 W Farmdale Estates Ct, Mequon, WI 53097
$-11,439
Cash flow
-22.1%
Cash-on-Cash Return
1.1%
Cap rate
0.2%
Rent to Value Ratio
Active
$1,395,000
5
bds
|
5
ba
|
6,480
sqft
|
built
1999
10625 N Pine Ridge Dr, Mequon, WI 53092
$-5,443
Cash flow
-20.4%
Cash-on-Cash Return
1.5%
Cap rate
0.3%
Rent to Value Ratio