Washington County Investment Properties for Sale
Browse homes for sale and investment properties in Washington County. Refine your search by price, property type, or more.
Best cash flowing properties in Washington County
Active
$99,900
1
bds
|
1
ba
|
678
sqft
|
built
1982
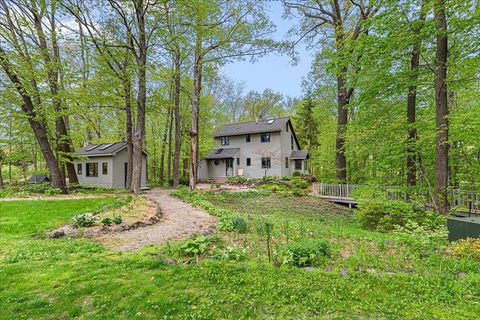
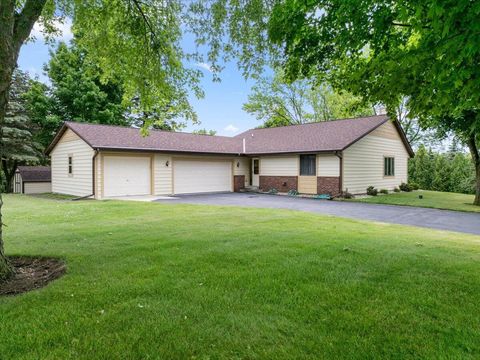
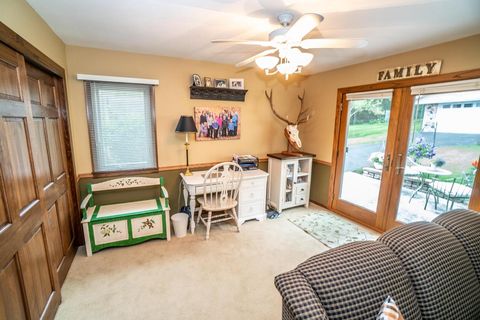
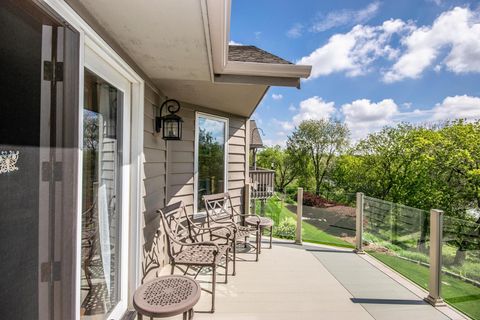
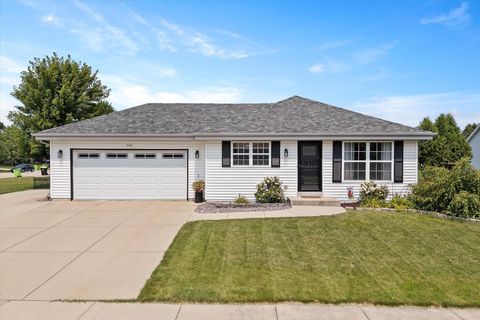
1700 Creek Rd, West Bend, WI 53090
$-137
Cash flow
-7.2%
Cash-on-Cash Return
4.5%
Cap rate
0.9%
Rent to Value Ratio
Active
$139,900
2
bds
|
1
ba
|
875
sqft
|
built
1976
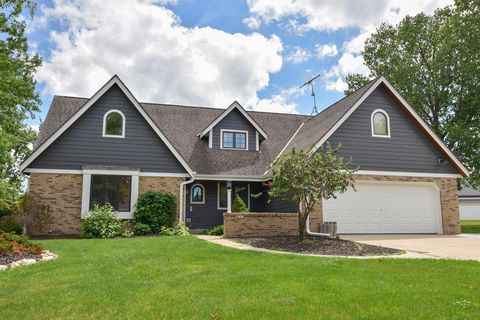
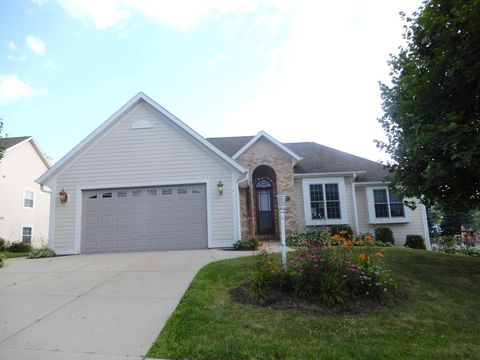
N114W15680 Sylvan Cir, Germantown, WI 53022
$-222
Cash flow
-8.3%
Cash-on-Cash Return
4.2%
Cap rate
0.9%
Rent to Value Ratio
109 out of 142 properties for sale in Washington County
Limited Results Shown
Create a free account, or log in to reveal all property listings and enjoy the complete experience.
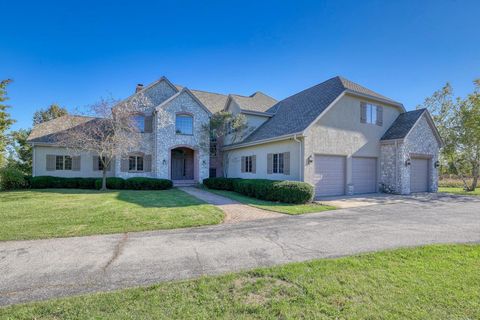
Active
$850,000
4
bds
|
3
ba
|
3,222
sqft
|
built
1983
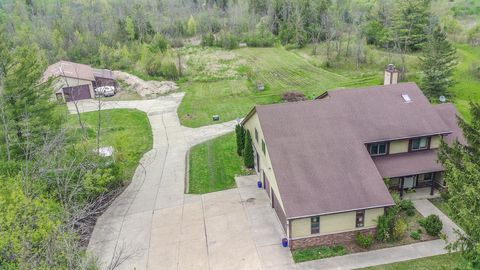
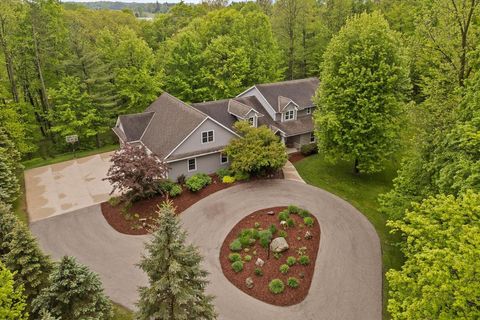
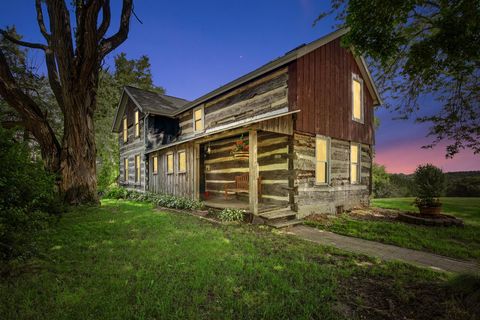
3076 Red Fox Cir, Colgate, WI 53017
$-3,631
Cash flow
-22.3%
Cash-on-Cash Return
1.0%
Cap rate
0.2%
Rent to Value Ratio
Active
$399,900
4
bds
|
1
ba
|
1,846
sqft
|
built
1976
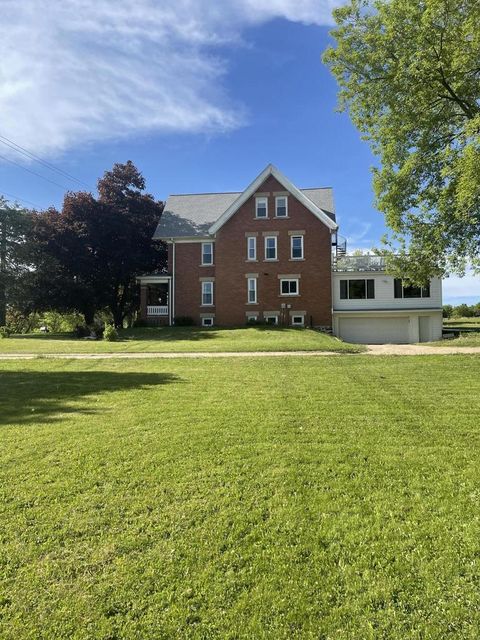
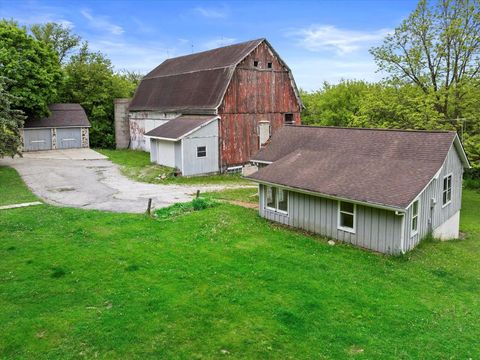
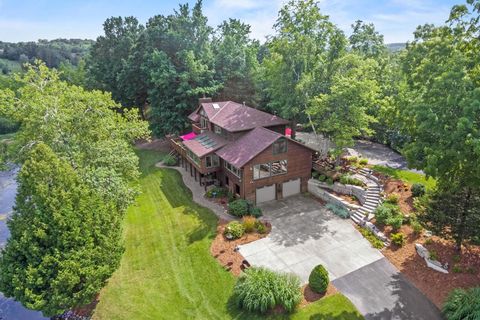
179 Second St, Allenton, WI 53002
$-715
Cash flow
-9.3%
Cash-on-Cash Return
4.0%
Cap rate
0.6%
Rent to Value Ratio
Active
$549,000
3
bds
|
2
ba
|
1,838
sqft
|
built
1976
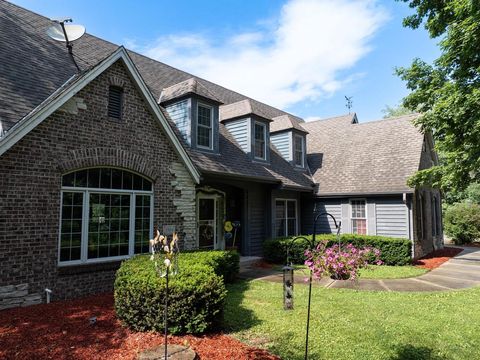
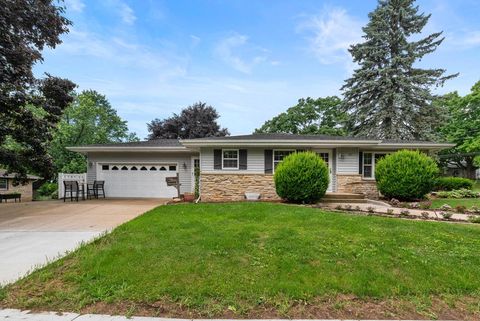
9561 Maple Tree Rd, Kewaskum, WI 53040
$-1,999
Cash flow
-19.0%
Cash-on-Cash Return
1.8%
Cap rate
0.3%
Rent to Value Ratio
Active
$690,000
4
bds
|
3
ba
|
4,099
sqft
|
built
1913
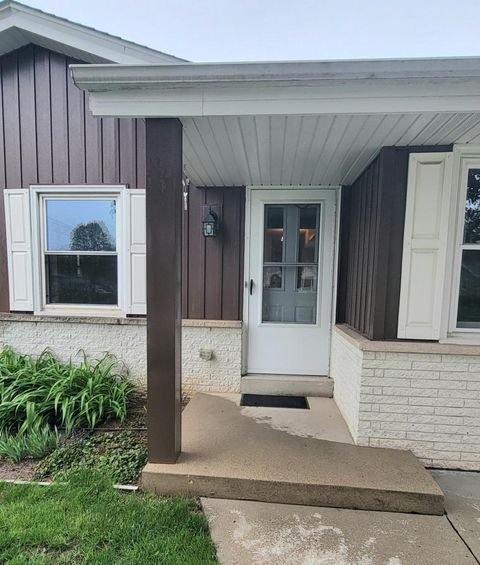
4310 Jackson Dr, Jackson, WI 53037
$-1,326
Cash flow
-10.0%
Cash-on-Cash Return
3.8%
Cap rate
0.5%
Rent to Value Ratio
Active
$649,900
7
bds
|
3
ba
|
3,600
sqft
|
built
1995
N124W13900 Lovers Ln, Germantown, WI 53022
$-1,651
Cash flow
-13.3%
Cash-on-Cash Return
3.1%
Cap rate
0.6%
Rent to Value Ratio
Active
$279,900
1
bds
|
1
ba
|
867
sqft
|
built
1930
3524 S Shore Dr, Hubertus, WI 53033
$-930
Cash flow
-17.3%
Cash-on-Cash Return
2.2%
Cap rate
0.4%
Rent to Value Ratio

Active
$379,500
3
bds
|
2
ba
|
2,297
sqft
|
built
1950
222 W Prospect St, Hartford, WI 53027
$-670
Cash flow
-9.2%
Cash-on-Cash Return
4.0%
Cap rate
0.6%
Rent to Value Ratio
Active
$864,900
4
bds
|
3.5
ba
|
3,324
sqft
|
built
1999
2804 Shagbark Dr, Kewaskum, WI 53040
$-2,388
Cash flow
-14.4%
Cash-on-Cash Return
2.8%
Cap rate
0.4%
Rent to Value Ratio
Active
$269,900
2
bds
|
2
ba
|
1,839
sqft
|
built
1987
1925 Hilltop Dr, West Bend, WI 53095
$-650
Cash flow
-12.6%
Cash-on-Cash Return
3.3%
Cap rate
0.6%
Rent to Value Ratio
Active
$2,590,000
7
bds
|
5.5
ba
|
10,066
sqft
|
built
2007
2269 Powder Hill Rd, Hartford, WI 53027
$-11,698
Cash flow
-23.6%
Cash-on-Cash Return
0.7%
Cap rate
0.2%
Rent to Value Ratio
Active
$479,000
3
bds
|
2
ba
|
1,960
sqft
|
built
1979
5591 Jacqueline Dr, West Bend, WI 53095
$-1,631
Cash flow
-17.8%
Cash-on-Cash Return
2.1%
Cap rate
0.3%
Rent to Value Ratio
Active
$275,000
2
bds
|
2
ba
|
1,693
sqft
|
built
2001
727 Wood River Ct, West Bend, WI 53095
$-641
Cash flow
-12.2%
Cash-on-Cash Return
3.4%
Cap rate
0.7%
Rent to Value Ratio
Active
$600,000
5
bds
|
3
ba
|
3,529
sqft
|
built
2003
N109W14760 Preserve Pkwy, Germantown, WI 53022
$-1,454
Cash flow
-12.6%
Cash-on-Cash Return
3.2%
Cap rate
0.5%
Rent to Value Ratio
Active
$1,875,000
5
bds
|
0
ba
|
2,266
sqft
|
built
1900
794 Emerald Dr, Hartford, WI 53027
$-8,304
Cash flow
-23.1%
Cash-on-Cash Return
0.8%
Cap rate
0.1%
Rent to Value Ratio
Active
$1,250,000
4
bds
|
3
ba
|
4,463
sqft
|
built
2008
2490 S River Rd, West Bend, WI 53095
$-4,450
Cash flow
-18.6%
Cash-on-Cash Return
1.9%
Cap rate
0.3%
Rent to Value Ratio
Active
$714,900
4
bds
|
2
ba
|
3,896
sqft
|
built
1998
3904 Northwoods Trl, Colgate, WI 53017
$-2,101
Cash flow
-15.3%
Cash-on-Cash Return
2.6%
Cap rate
0.4%
Rent to Value Ratio
Active
$390,000
4
bds
|
0
ba
|
2,802
sqft
|
built
1972
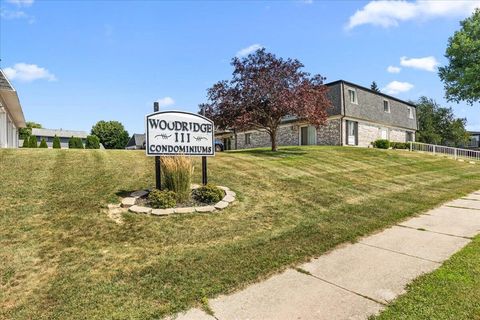
1818 Woodridge Rd, West Bend, WI 53095
$-901
Cash flow
-12.1%
Cash-on-Cash Return
3.4%
Cap rate
0.5%
Rent to Value Ratio
Active
$449,900
3
bds
|
2
ba
|
2,136
sqft
|
built
1985
4294 Bonmaur Ter, Slinger, WI 53086
$-1,148
Cash flow
-13.3%
Cash-on-Cash Return
3.1%
Cap rate
0.4%
Rent to Value Ratio
Active
$749,900
5
bds
|
3
ba
|
4,836
sqft
|
built
2005
N97W14613 Rimrock Rd, Germantown, WI 53022
$-1,843
Cash flow
-12.8%
Cash-on-Cash Return
3.2%
Cap rate
0.5%
Rent to Value Ratio
Active
$624,900
2
bds
|
1
ba
|
816
sqft
|
built
1930
1266 E Green Lake Dr, West Bend, WI 53090
$-2,079
Cash flow
-17.4%
Cash-on-Cash Return
2.2%
Cap rate
0.3%
Rent to Value Ratio
Active
$520,000
4
bds
|
3
ba
|
3,495
sqft
|
built
1988
831 Oak Ridge Cir, Hartford, WI 53027
$-1,075
Cash flow
-10.8%
Cash-on-Cash Return
3.7%
Cap rate
0.6%
Rent to Value Ratio
Active
$1,080,000
3
bds
|
1.5
ba
|
1,693
sqft
|
built
1900
4929 State Road 144, Hartford, WI 53027
$-4,703
Cash flow
-22.7%
Cash-on-Cash Return
0.9%
Cap rate
0.2%
Rent to Value Ratio
Active
$999,000
3
bds
|
1.5
ba
|
1,955
sqft
|
built
1906
6386 Alpine Dr, West Bend, WI 53095
$-4,174
Cash flow
-21.8%
Cash-on-Cash Return
1.1%
Cap rate
0.2%
Rent to Value Ratio
Active
$1,990,000
4
bds
|
4.5
ba
|
4,484
sqft
|
built
1980
6215 Riesch Rd, West Bend, WI 53095
$-7,420
Cash flow
-19.5%
Cash-on-Cash Return
1.7%
Cap rate
0.3%
Rent to Value Ratio
Active
$360,000
3
bds
|
2
ba
|
1,647
sqft
|
built
1962
307 Sixth St, Hartford, WI 53027
$-372
Cash flow
-5.4%
Cash-on-Cash Return
4.9%
Cap rate
0.7%
Rent to Value Ratio
Active
$475,000
3
bds
|
0
ba
|
2,826
sqft
|
built
1992
207 Deer Ridge Dr, West Bend, WI 53095
$-1,153
Cash flow
-12.7%
Cash-on-Cash Return
3.2%
Cap rate
0.5%
Rent to Value Ratio
Active
$395,000
4
bds
|
2
ba
|
2,127
sqft
|
built
1989
917 Wheelock Ave, Hartford, WI 53027
$-685
Cash flow
-9.0%
Cash-on-Cash Return
4.1%
Cap rate
0.6%
Rent to Value Ratio
Active
$499,000
4
bds
|
3
ba
|
3,082
sqft
|
built
2016
715 Willow Ln, Hartford, WI 53027
$-1,202
Cash flow
-12.6%
Cash-on-Cash Return
3.3%
Cap rate
0.5%
Rent to Value Ratio
Active
$459,900
4
bds
|
2
ba
|
2,227
sqft
|
built
2018
1504 Walnut Ct, Hartford, WI 53027
$-816
Cash flow
-9.3%
Cash-on-Cash Return
4.0%
Cap rate
0.6%
Rent to Value Ratio
Active
$2,750,000
4
bds
|
0
ba
|
7,500
sqft
|
built
2001
4333 Maple Rd, West Bend, WI 53095
$-12,253
Cash flow
-23.2%
Cash-on-Cash Return
0.8%
Cap rate
0.1%
Rent to Value Ratio
Active
$999,000
4
bds
|
3
ba
|
3,362
sqft
|
built
2002
7135 Mullaney Ct, Hartford, WI 53027
$-4,231
Cash flow
-22.1%
Cash-on-Cash Return
1.1%
Cap rate
0.2%
Rent to Value Ratio
Active
$750,000
5
bds
|
2
ba
|
3,478
sqft
|
built
1956
9080 Hickory Dr, Kewaskum, WI 53040
$-1,025
Cash flow
-7.1%
Cash-on-Cash Return
4.5%
Cap rate
0.6%
Rent to Value Ratio
Active
$479,900
4
bds
|
2.5
ba
|
2,583
sqft
|
built
2008
24 Rushmore Ln, Hartford, WI 53027
$-938
Cash flow
-10.2%
Cash-on-Cash Return
3.8%
Cap rate
0.6%
Rent to Value Ratio
Active
$349,900
3
bds
|
2
ba
|
1,288
sqft
|
built
2001
1072 Cleveland Ave, Hartford, WI 53027
$-667
Cash flow
-9.9%
Cash-on-Cash Return
3.9%
Cap rate
0.6%
Rent to Value Ratio
Active
$289,900
2
bds
|
2
ba
|
1,793
sqft
|
built
2001
723 Stoney Creek Ct, West Bend, WI 53095
$-607
Cash flow
-10.9%
Cash-on-Cash Return
3.6%
Cap rate
0.7%
Rent to Value Ratio
Active
$477,900
4
bds
|
3
ba
|
2,454
sqft
|
built
2003
805 Harrison St, Hartford, WI 53027
$-697
Cash flow
-7.6%
Cash-on-Cash Return
4.4%
Cap rate
0.6%
Rent to Value Ratio
Active
$499,900
3
bds
|
3
ba
|
2,950
sqft
|
built
2008
511 Acorn Pass, Hartford, WI 53027
$-904
Cash flow
-9.4%
Cash-on-Cash Return
4.0%
Cap rate
0.6%
Rent to Value Ratio
Active
$399,900
4
bds
|
1.5
ba
|
1,650
sqft
|
built
1962
3548 Lusan Dr, Cedarburg, WI 53012
$-713
Cash flow
-9.3%
Cash-on-Cash Return
4.0%
Cap rate
0.6%
Rent to Value Ratio