Wilmington, NC Investment Properties for Sale
Browse homes for sale and investment properties in Wilmington, NC. Refine your search by price, property type, or more.
Best cash flowing properties in Wilmington, NC
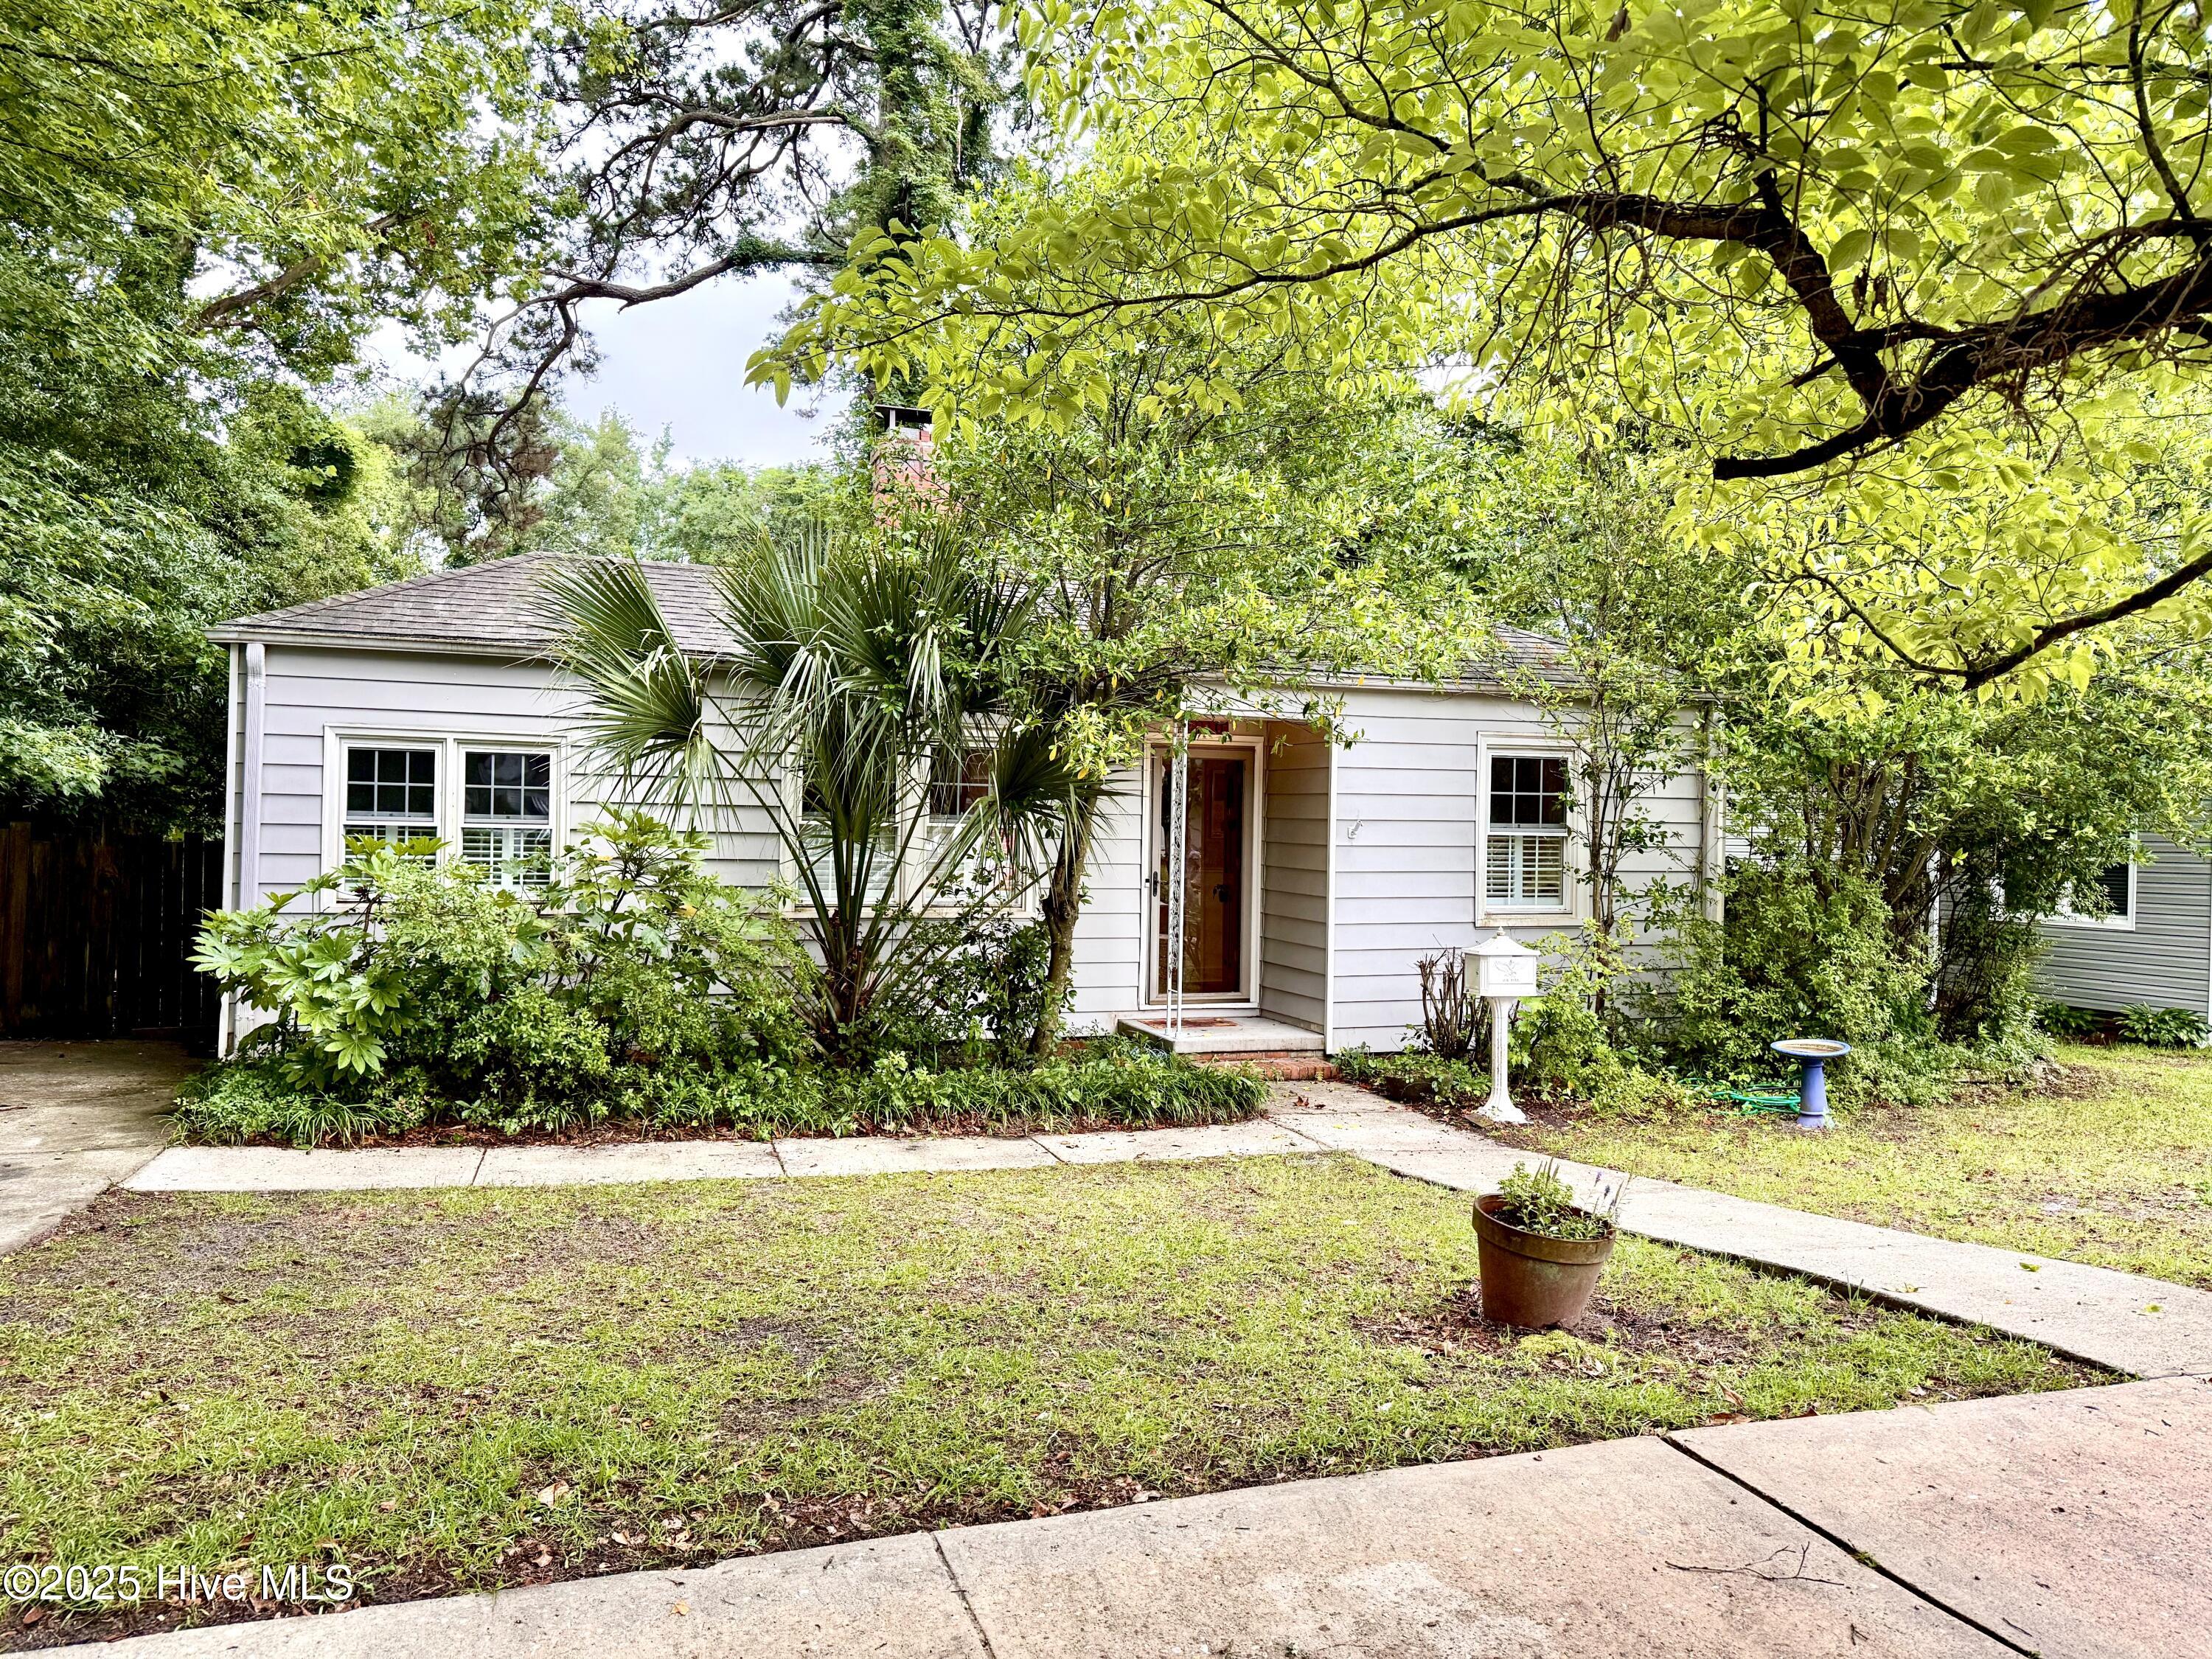
Pending
$119,000
2
bds
|
1
ba
|
799
sqft
|
built
1920
115 Wright St, Wilmington, NC 28401
$205
Cash flow
9.0%
Cash-on-Cash Return
8.3%
Cap rate
1.0%
Rent to Value Ratio
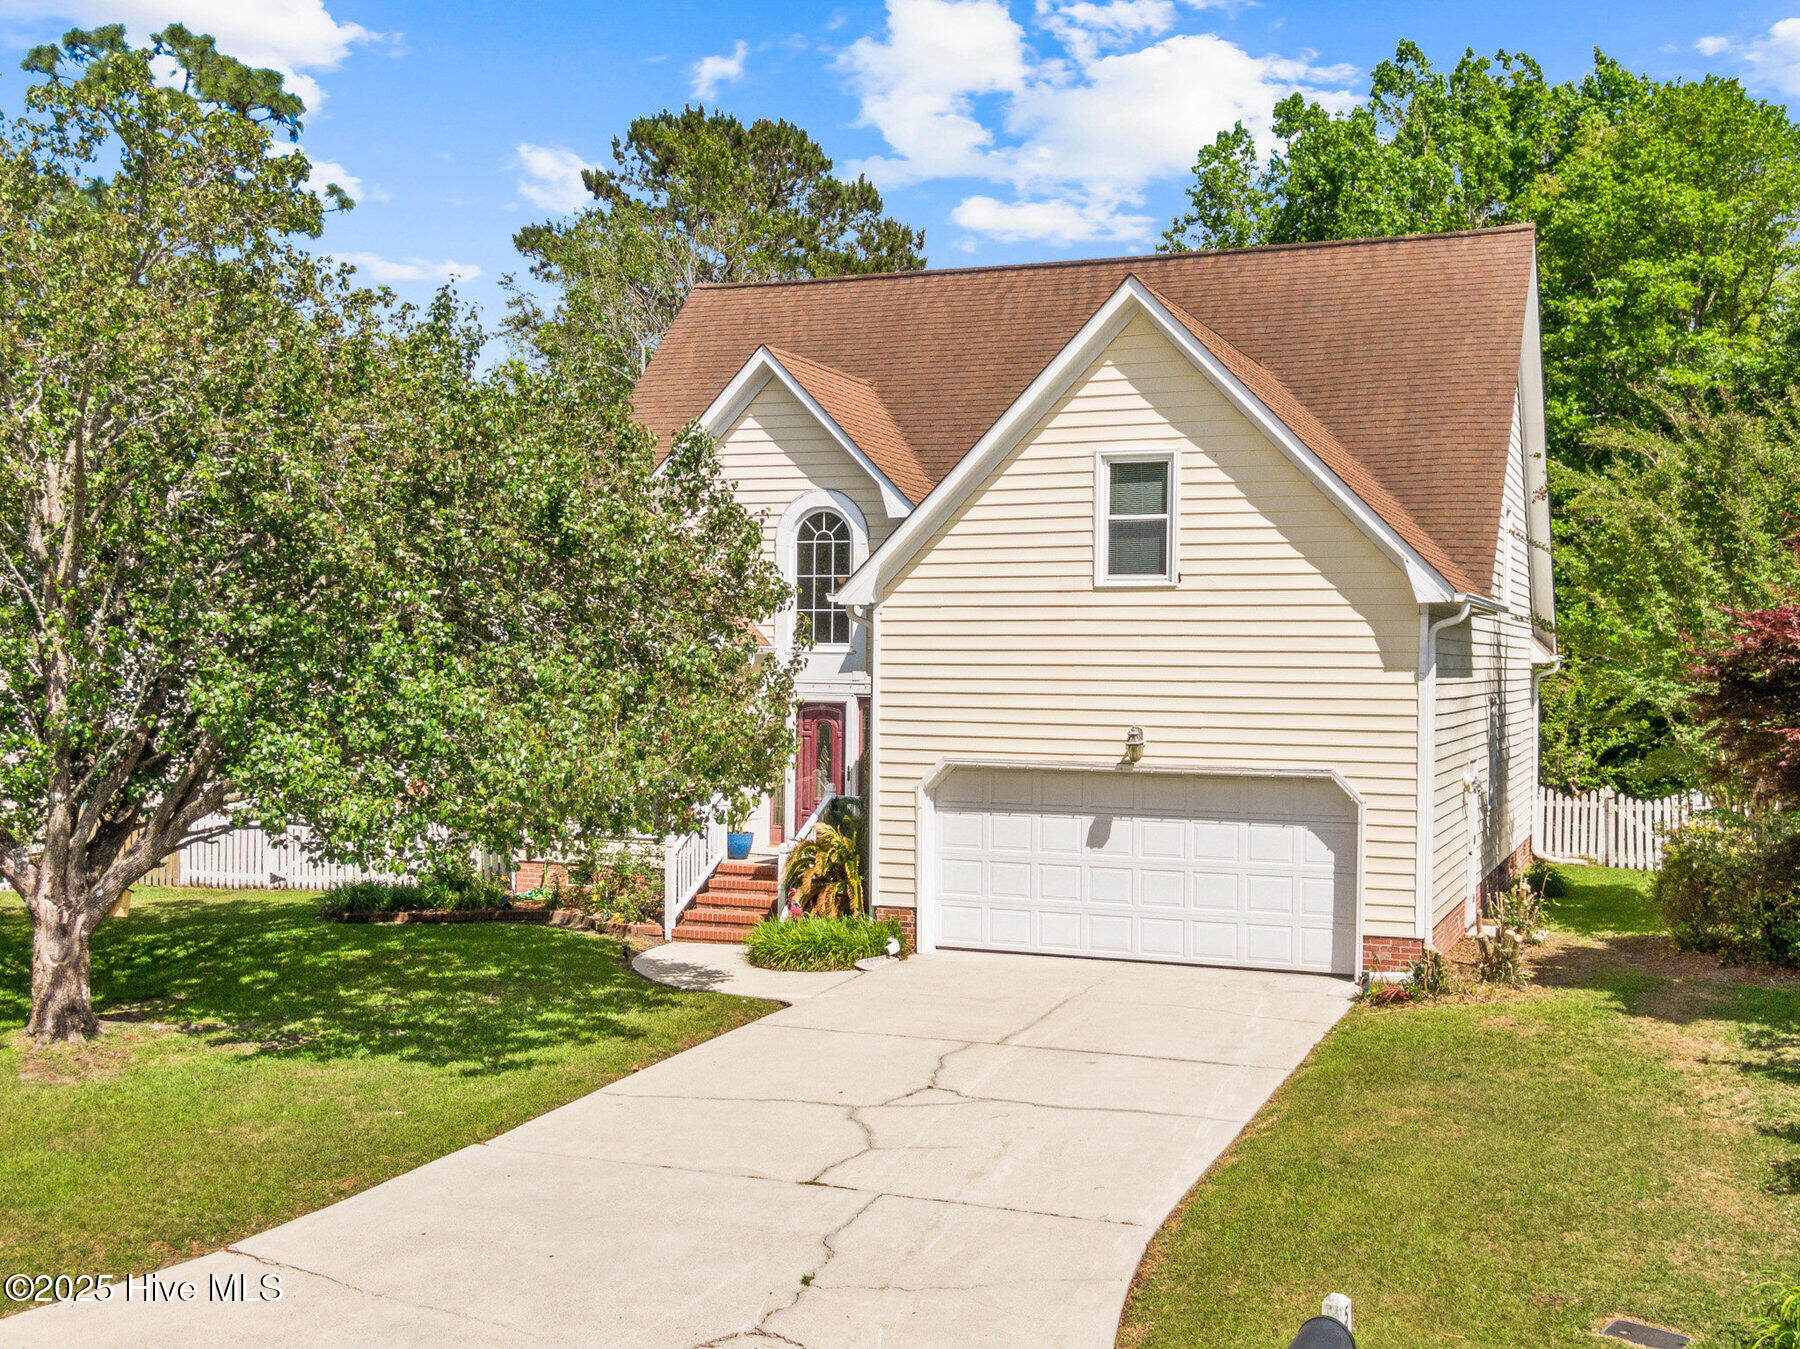
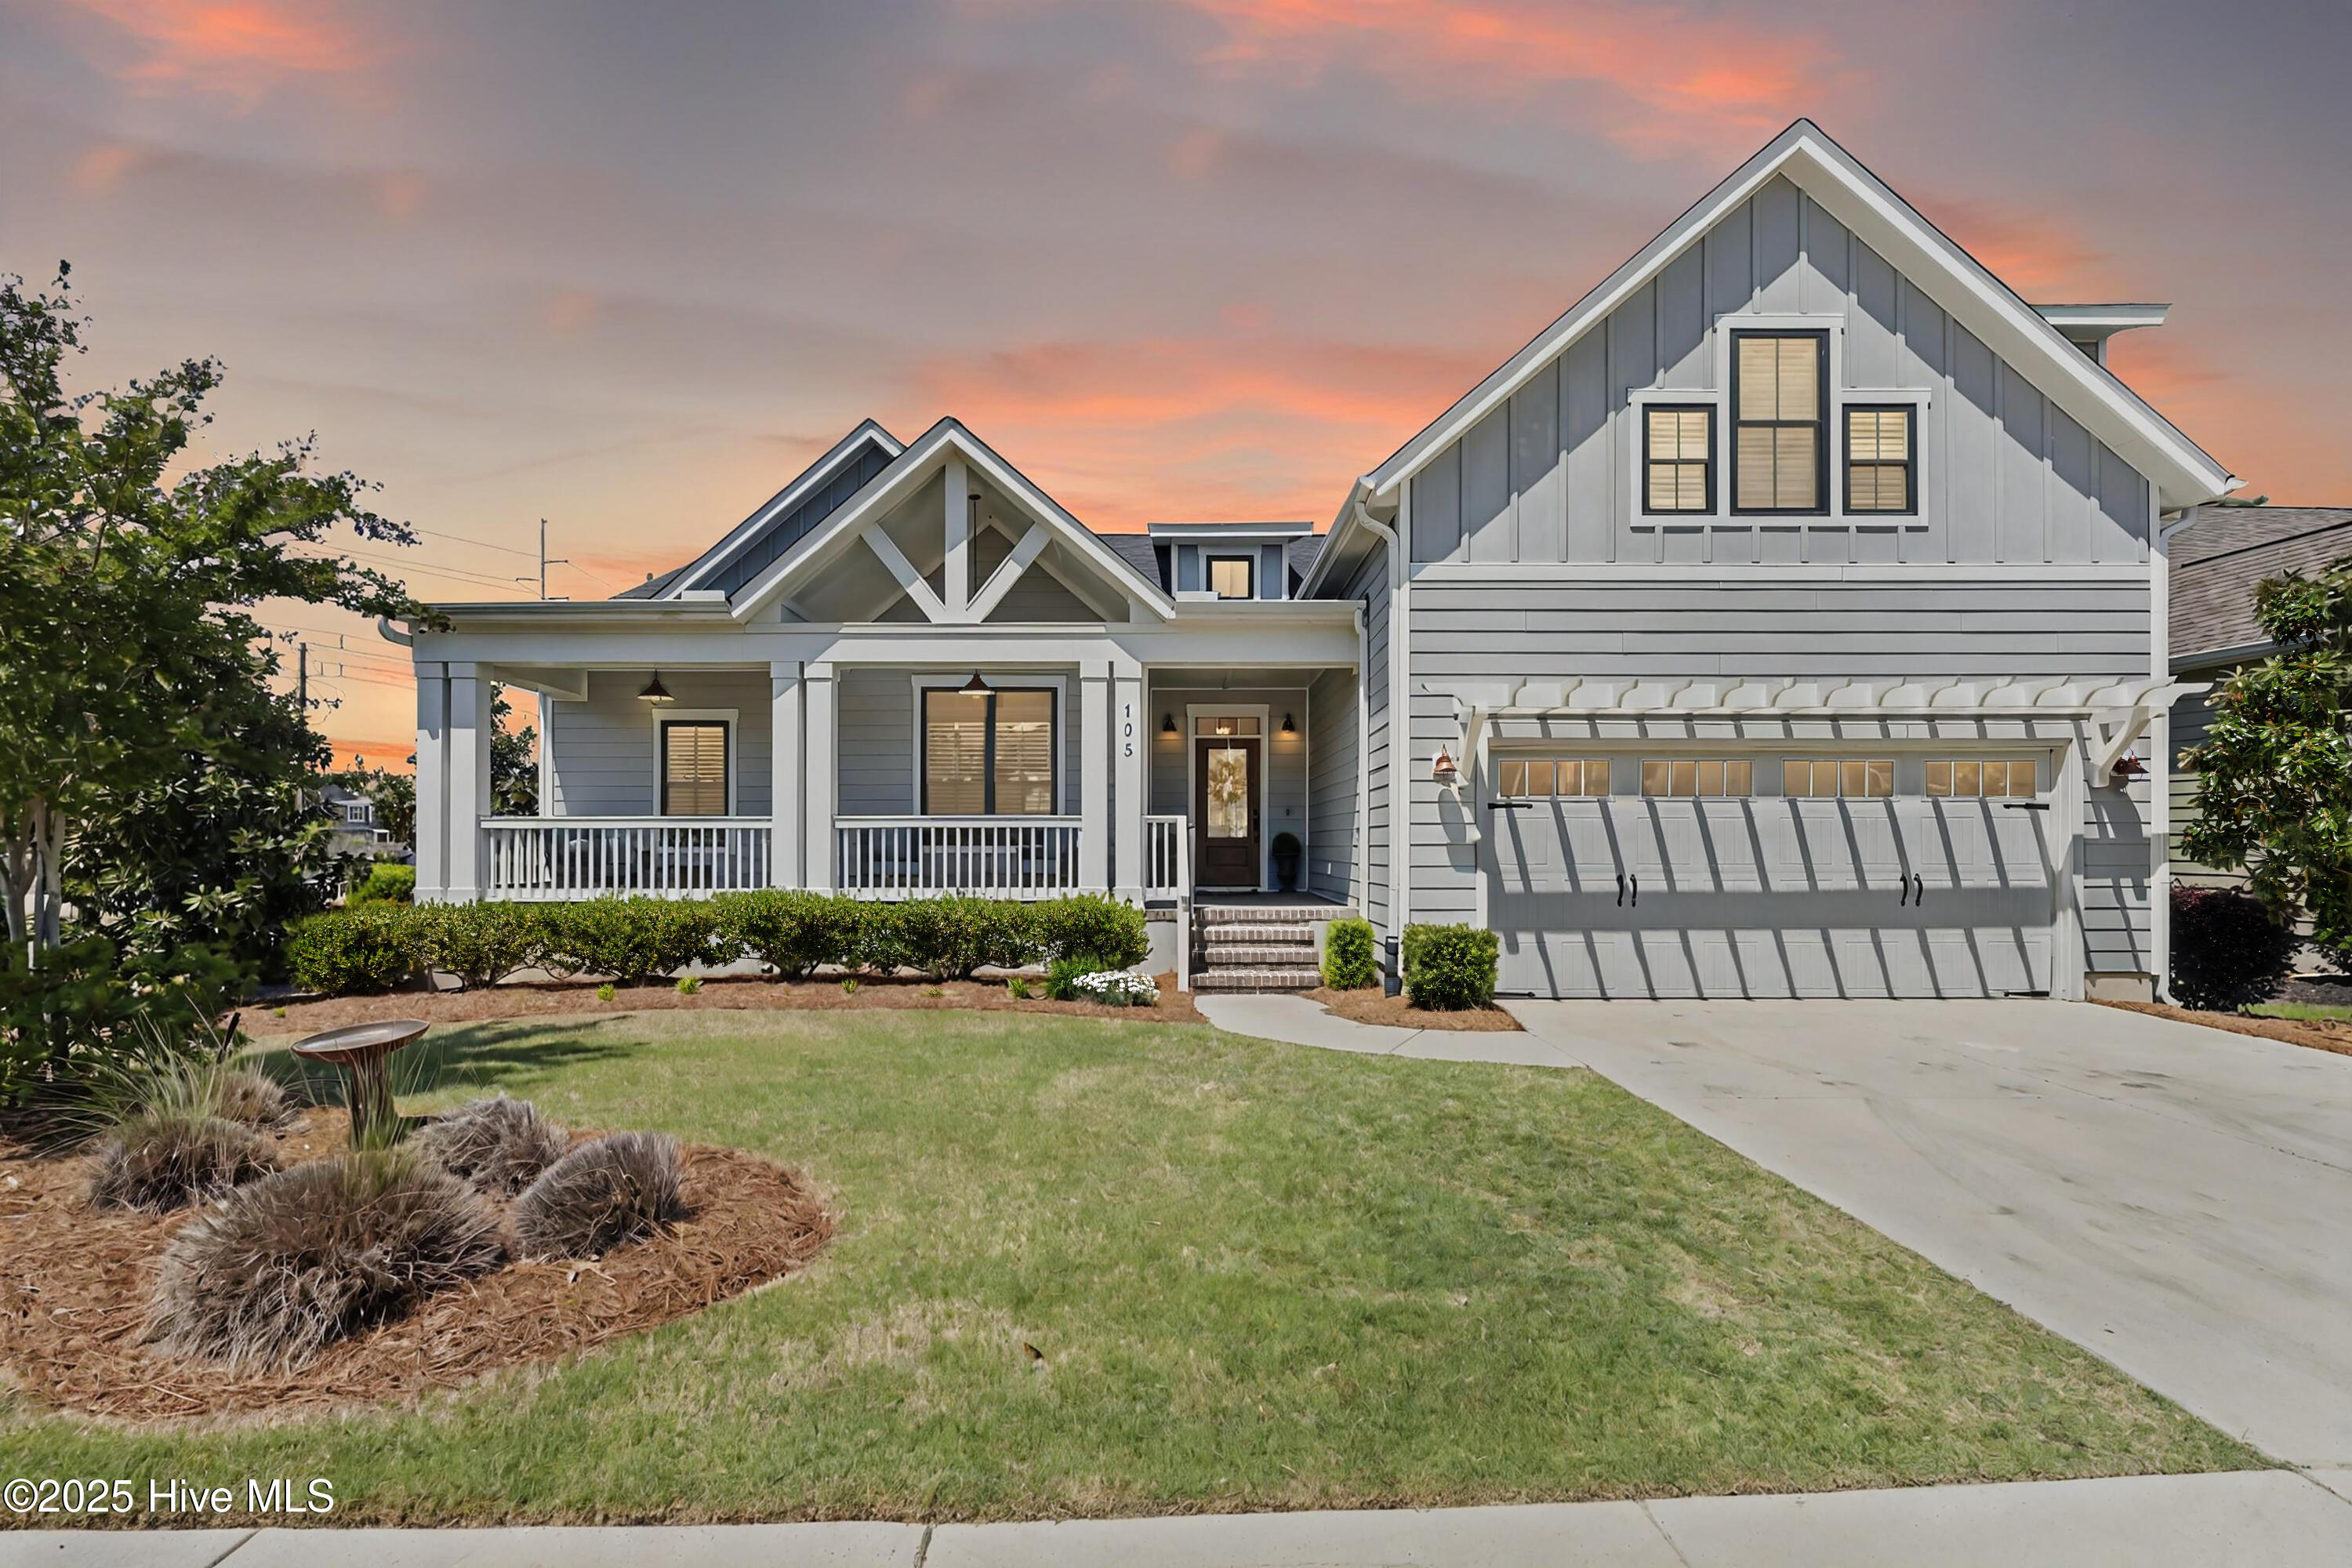
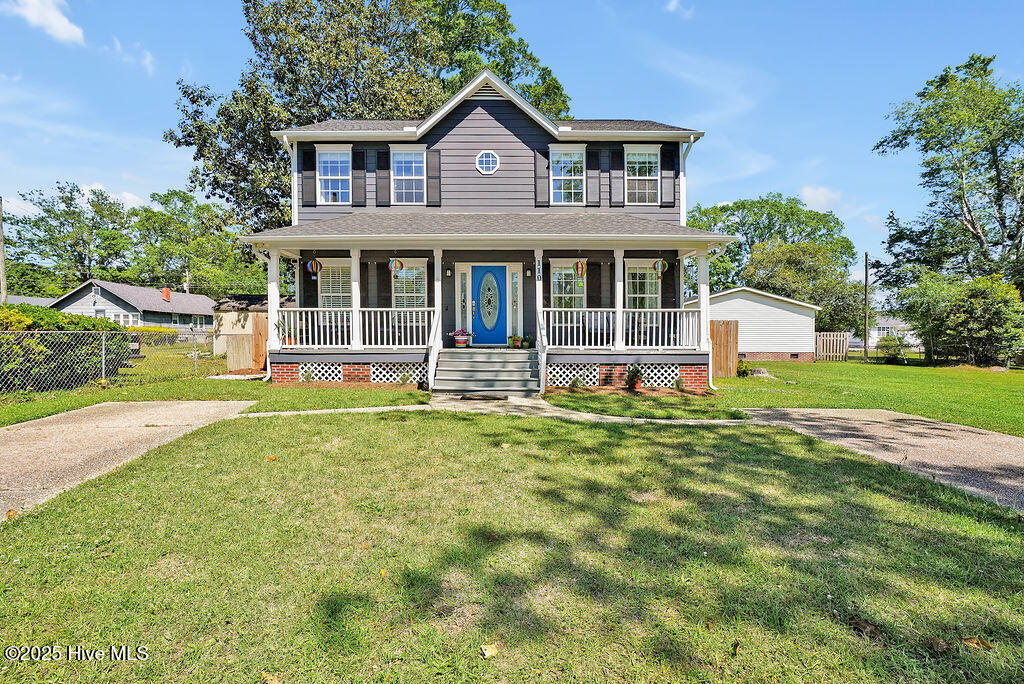
Pending
$279,900
3
bds
|
2
ba
|
2,088
sqft
|
built
2010
216 Creekwood Rd, Wilmington, NC 28411
$192
Cash flow
3.6%
Cash-on-Cash Return
7.1%
Cap rate
0.9%
Rent to Value Ratio
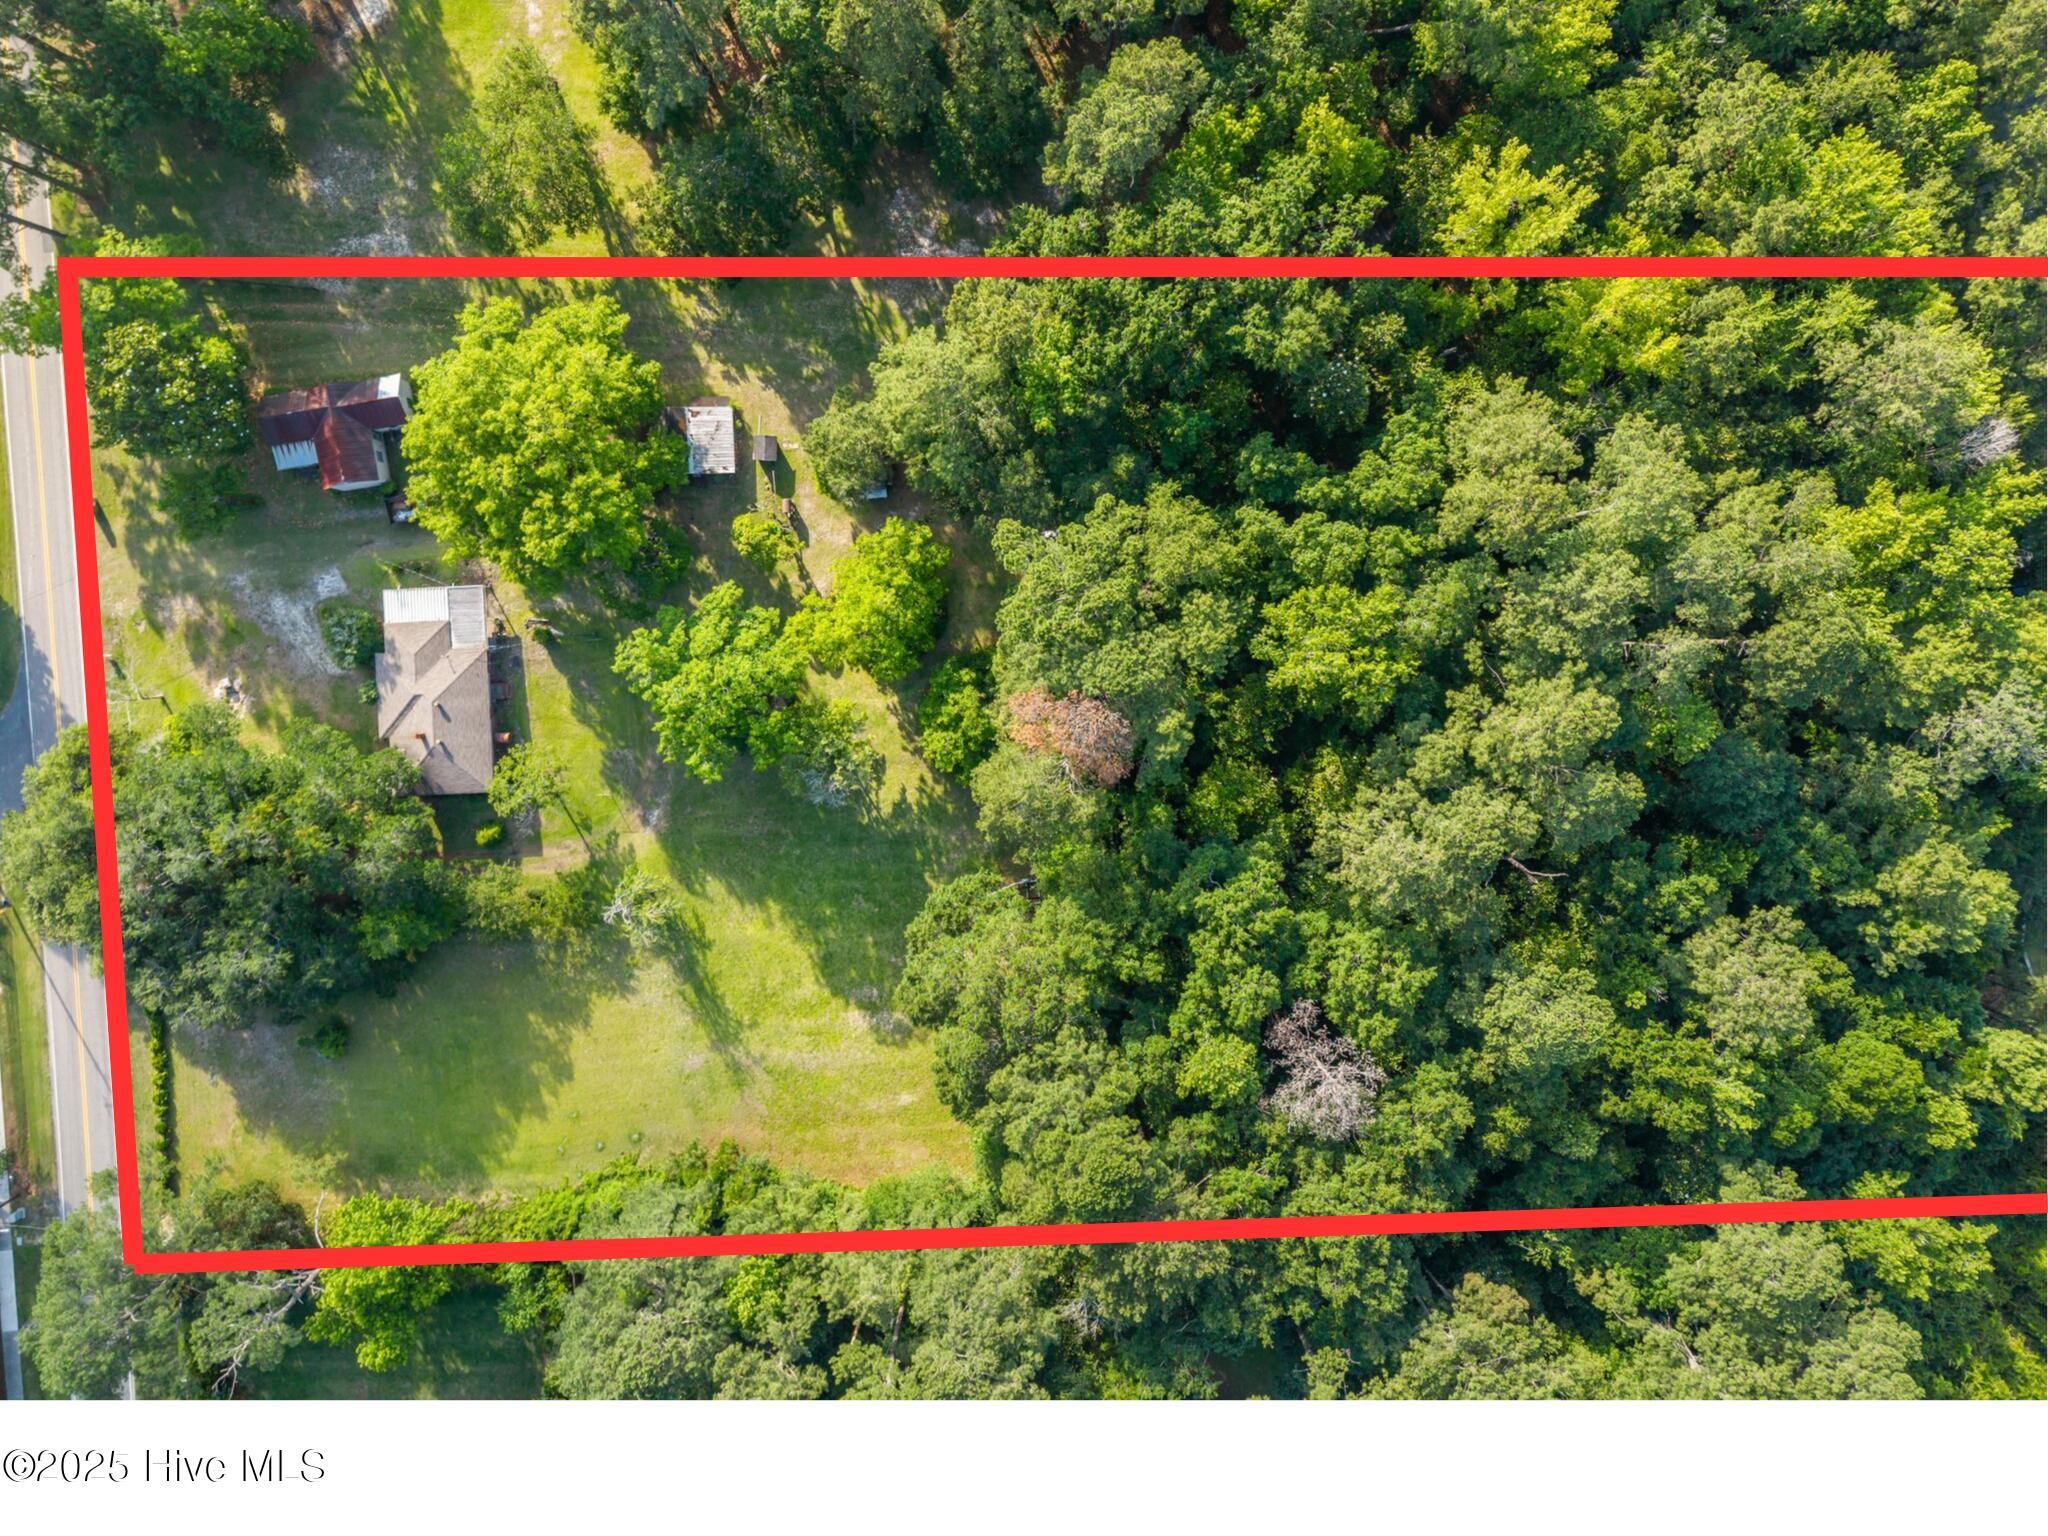
375 out of 695 properties for sale in Wilmington, NC
Limited Results Shown
Create a free account, or log in to reveal all property listings and enjoy the complete experience.
Pending
$119,000
2
bds
|
1
ba
|
799
sqft
|
built
1920
115 Wright St, Wilmington, NC 28401
$205
Cash flow
9.0%
Cash-on-Cash Return
8.3%
Cap rate
1.0%
Rent to Value Ratio
Active
$649,000
3
bds
|
4
ba
|
2,556
sqft
|
built
2001
113 Rockledge Rd, Wilmington, NC 28412
$-1,467
Cash flow
-11.8%
Cash-on-Cash Return
3.6%
Cap rate
0.4%
Rent to Value Ratio

Active
$465,000
3
bds
|
3
ba
|
1,911
sqft
|
built
1987
333 Scottsdale Dr, Wilmington, NC 28411
$-729
Cash flow
-8.2%
Cash-on-Cash Return
4.4%
Cap rate
0.6%
Rent to Value Ratio
Active
$1,374,900
3
bds
|
4
ba
|
2,292
sqft
|
built
1991
1652 Sand Bar Ln, Wilmington, NC 28409
$-4,386
Cash flow
-16.6%
Cash-on-Cash Return
2.5%
Cap rate
0.3%
Rent to Value Ratio
Active
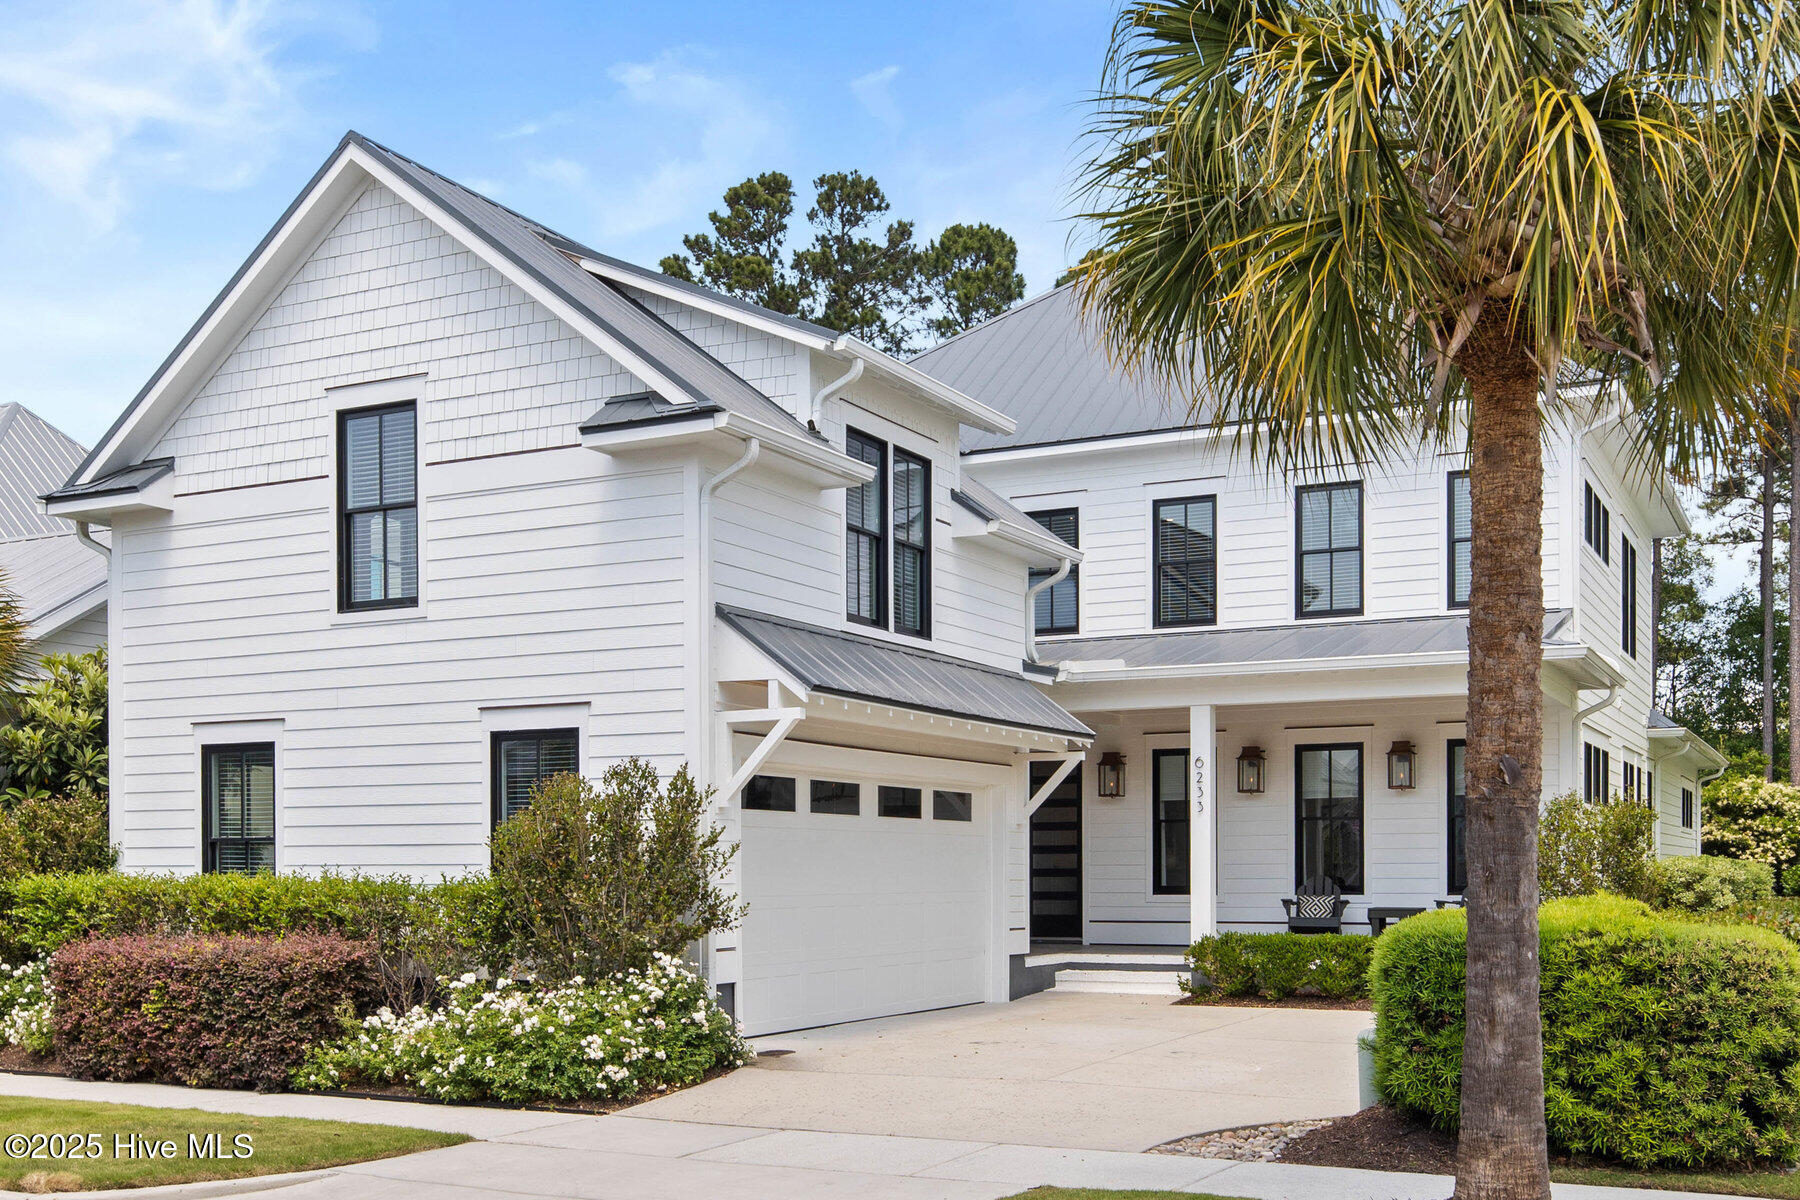
$1,430,000
4
bds
|
6
ba
|
4,081
sqft
|
built
2020
6233 Chalfont Cir, Wilmington, NC 28405
$-5,946
Cash flow
-21.7%
Cash-on-Cash Return
1.3%
Cap rate
0.2%
Rent to Value Ratio
Active
$1,825,000
4
bds
|
5
ba
|
5,050
sqft
|
built
2007
6424 River Vista Dr, Wilmington, NC 28412
$-5,595
Cash flow
-16.0%
Cash-on-Cash Return
2.6%
Cap rate
0.4%
Rent to Value Ratio
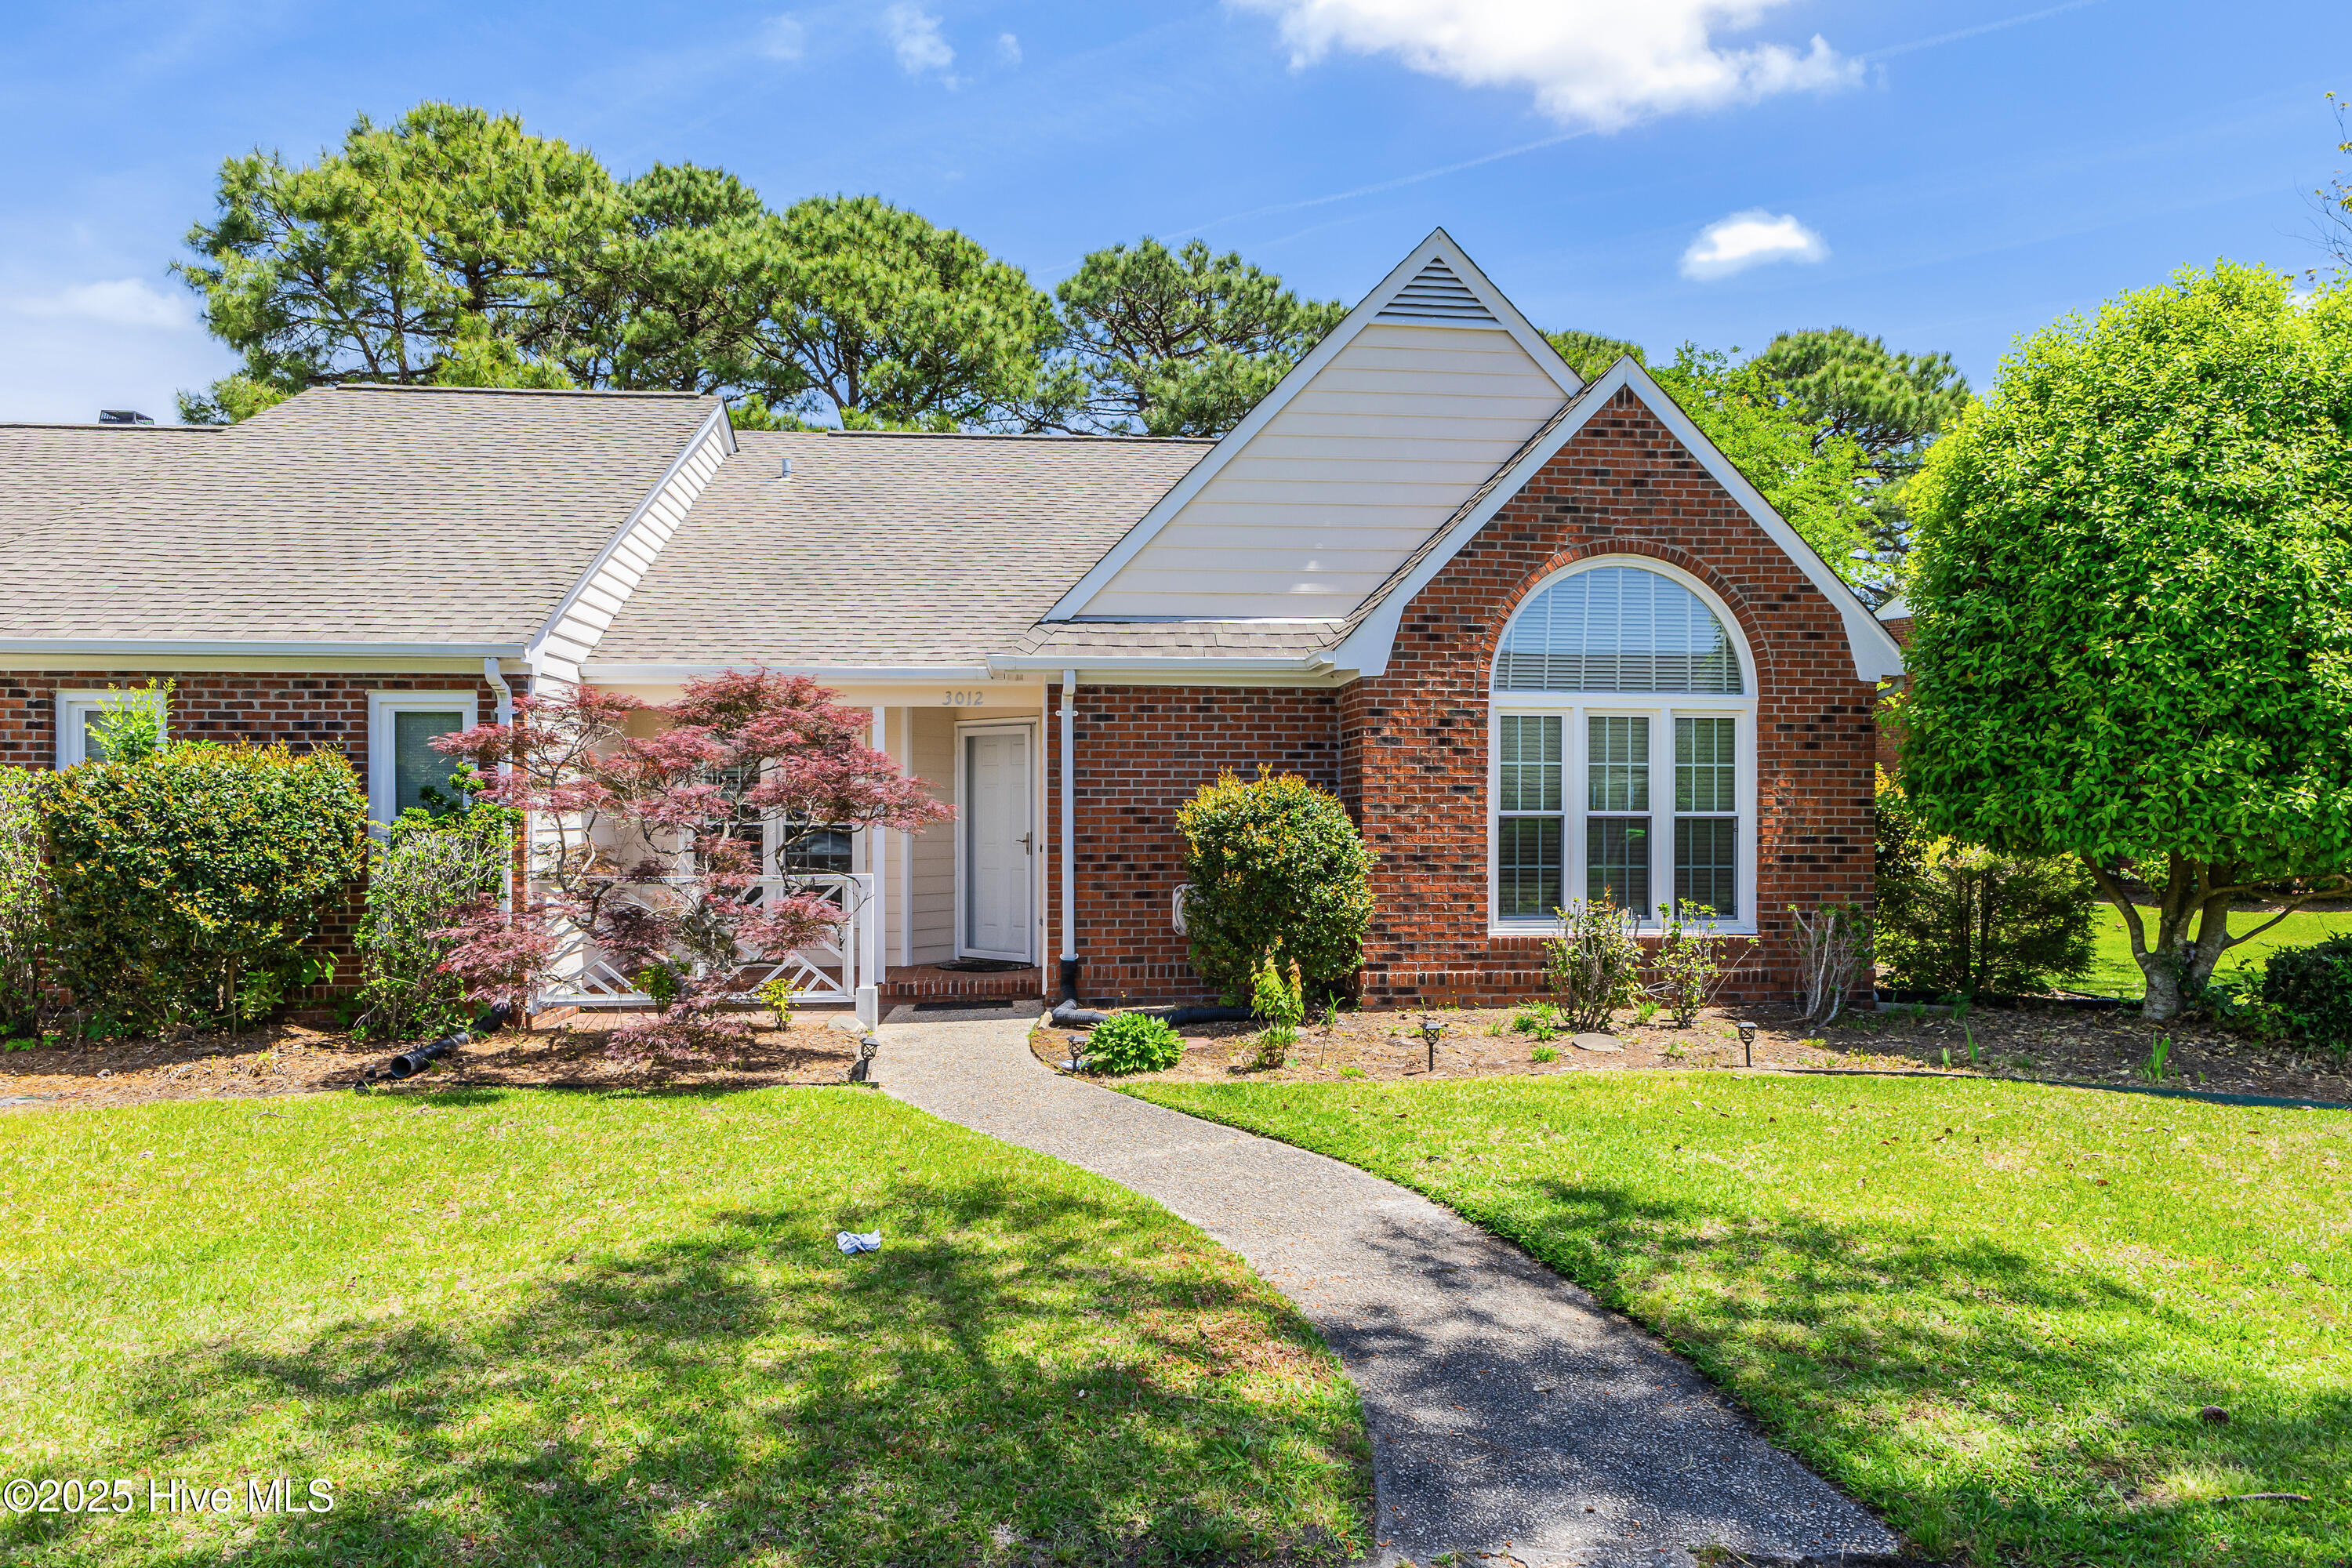
Active
$275,000
2
bds
|
2
ba
|
1,231
sqft
|
built
1991
3012 Remington Dr, Wilmington, NC 28405
$-673
Cash flow
-12.8%
Cash-on-Cash Return
3.3%
Cap rate
0.6%
Rent to Value Ratio
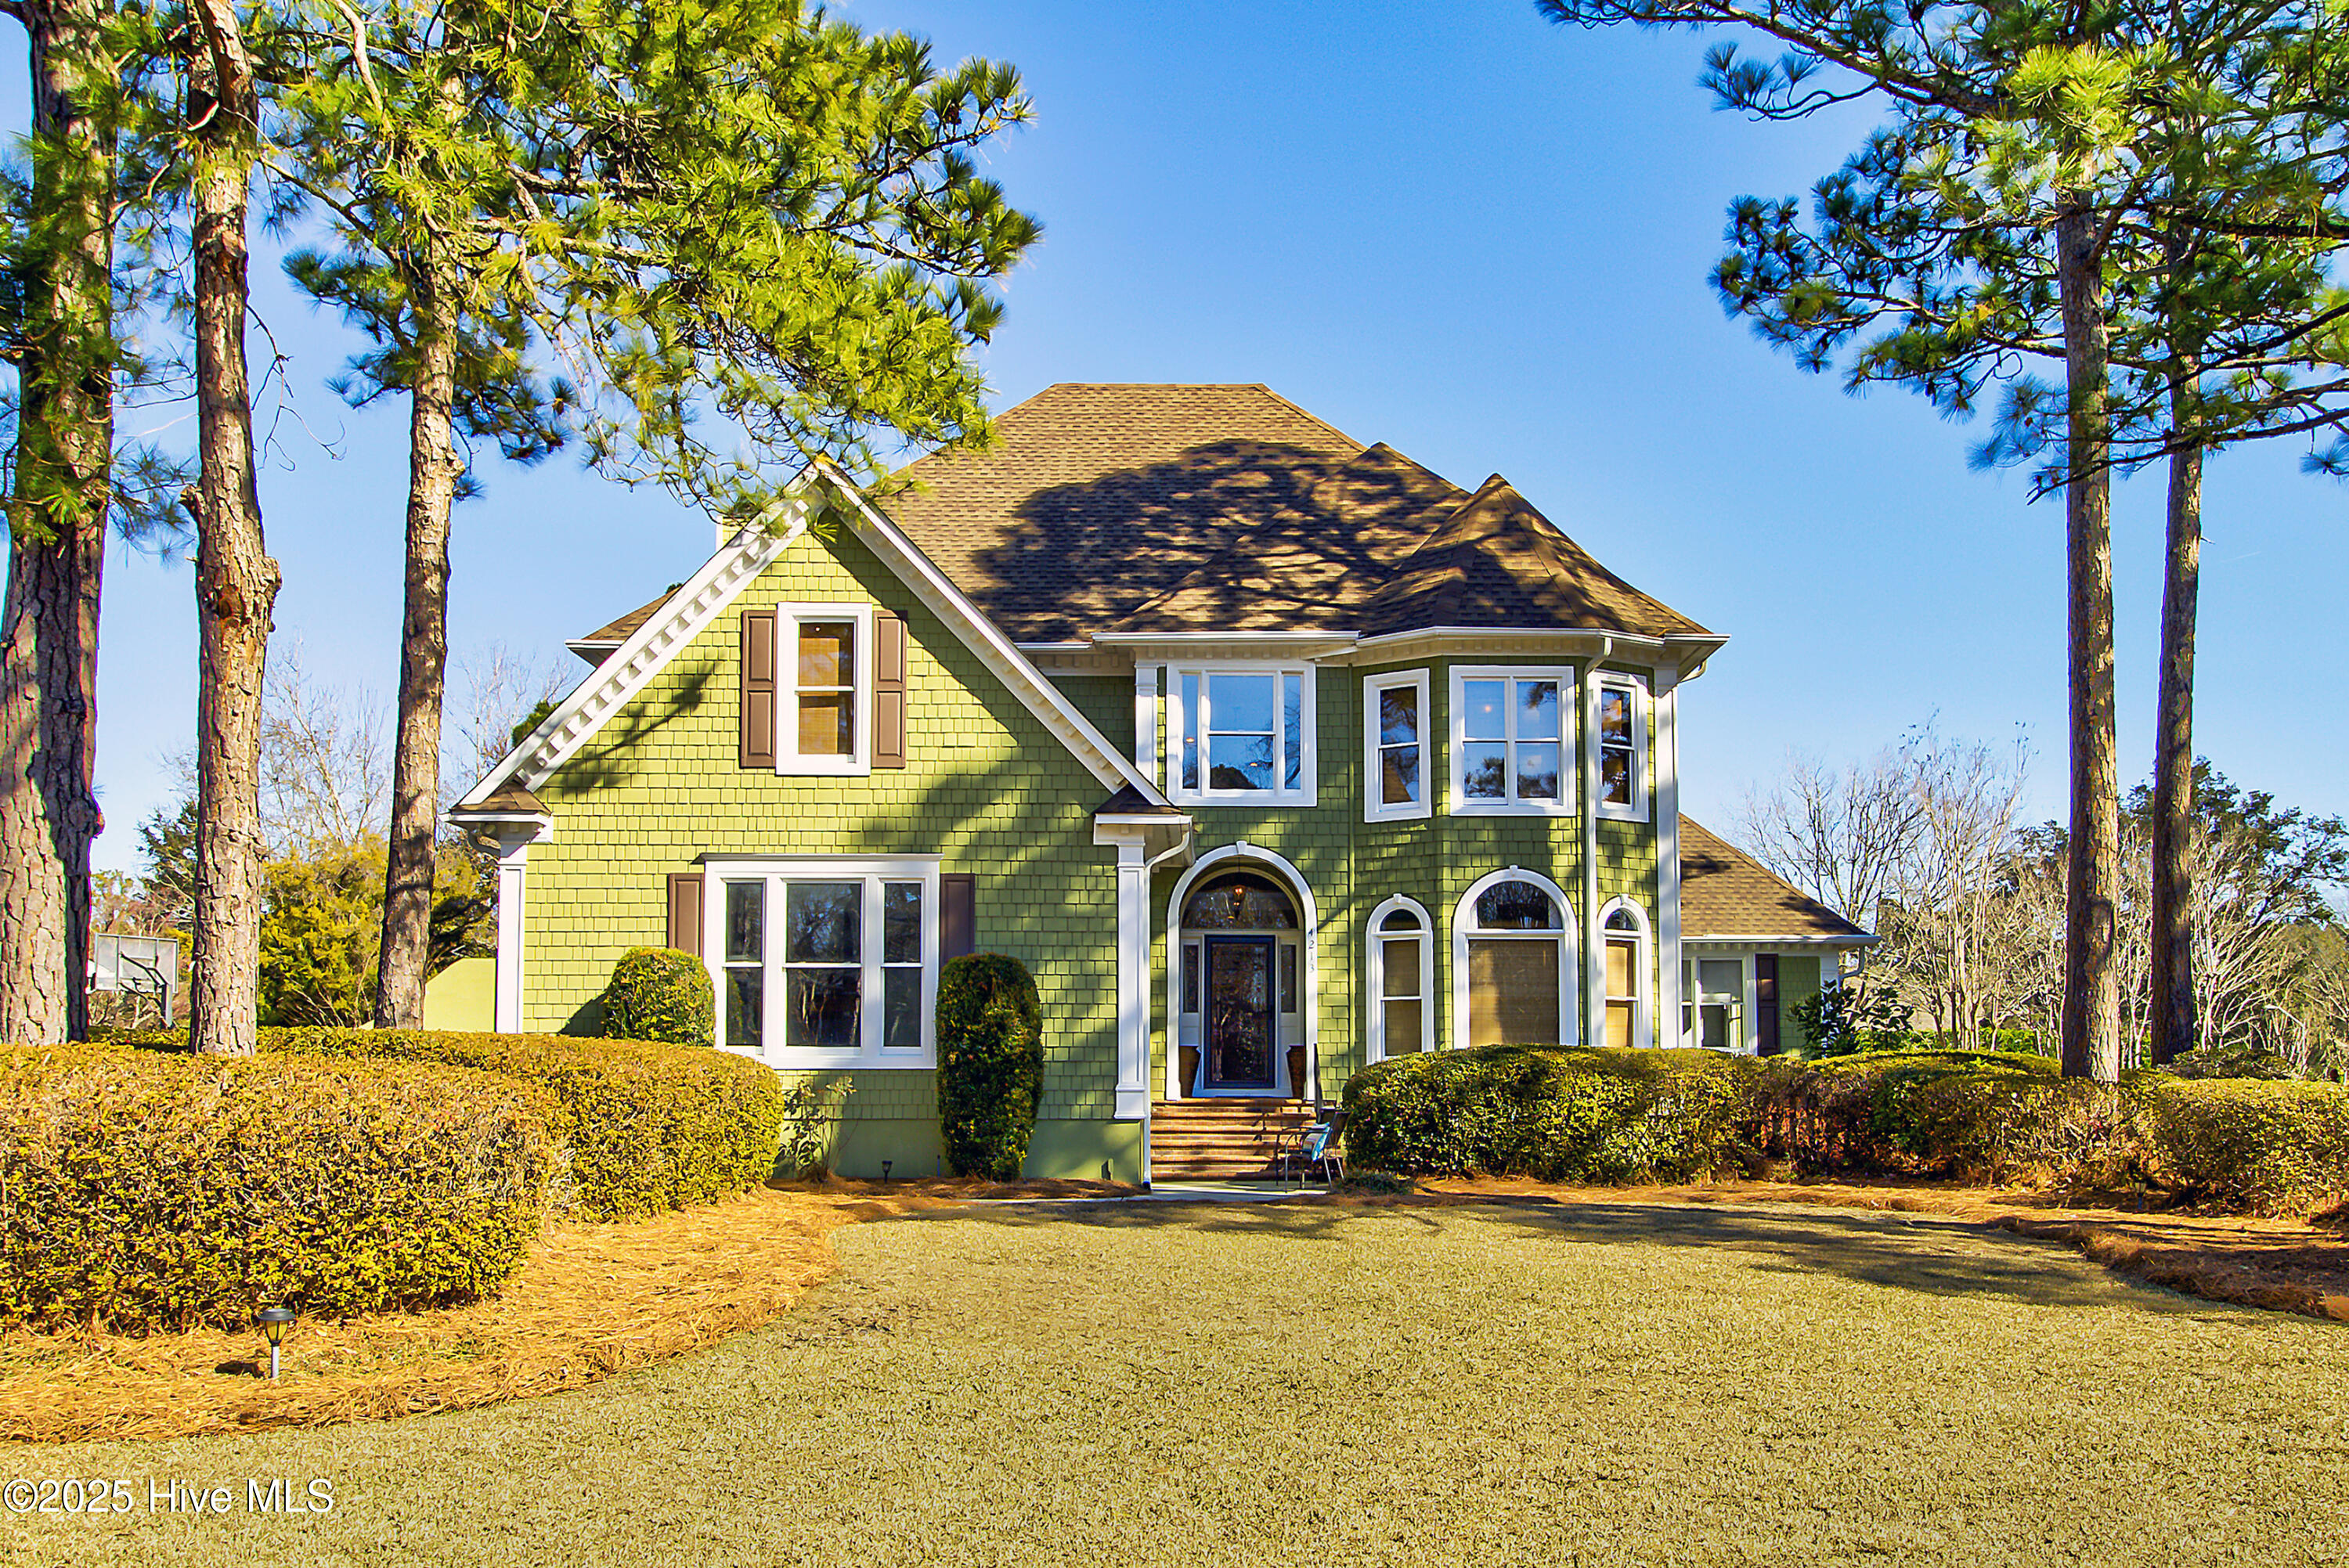
Pending
$829,999
4
bds
|
4
ba
|
4,050
sqft
|
built
1991
4213 Forwalt Pl, Wilmington, NC 28409
$-1,472
Cash flow
-9.3%
Cash-on-Cash Return
4.2%
Cap rate
0.5%
Rent to Value Ratio
Active
$424,800
4
bds
|
3
ba
|
2,050
sqft
|
built
1994
5705 Woodduck Cir, Wilmington, NC 28409
$-613
Cash flow
-7.5%
Cash-on-Cash Return
4.6%
Cap rate
0.6%
Rent to Value Ratio
Active
$2,000,000
3
bds
|
2
ba
|
1,014
sqft
|
built
1958
308 Hooker Rd, Wilmington, NC 28403
$-9,528
Cash flow
-24.9%
Cash-on-Cash Return
0.6%
Cap rate
0.1%
Rent to Value Ratio
Active
$609,000
3
bds
|
2
ba
|
2,291
sqft
|
built
1994
7100 Fiddler Cir, Wilmington, NC 28405
$-1,544
Cash flow
-13.2%
Cash-on-Cash Return
3.2%
Cap rate
0.5%
Rent to Value Ratio
Pending
$153,000
1
bds
|
1
ba
|
616
sqft
|
built
1983
2536 Flint Dr, Wilmington, NC 28401
$-377
Cash flow
-12.9%
Cash-on-Cash Return
3.3%
Cap rate
0.7%
Rent to Value Ratio
Pending
$370,000
3
bds
|
2
ba
|
1,260
sqft
|
built
1942
2210 Klein Rd, Wilmington, NC 28405
$-797
Cash flow
-11.2%
Cash-on-Cash Return
3.7%
Cap rate
0.5%
Rent to Value Ratio
Active
$645,000
4
bds
|
4
ba
|
2,776
sqft
|
built
2018
105 Helmsman Dr, Wilmington, NC 28412
$-1,443
Cash flow
-11.7%
Cash-on-Cash Return
3.6%
Cap rate
0.5%
Rent to Value Ratio
Active
$1,575,000
4
bds
|
3
ba
|
2,906
sqft
|
built
1994
8824 Shipwatch Dr, Wilmington, NC 28412
$-4,475
Cash flow
-14.8%
Cash-on-Cash Return
2.9%
Cap rate
0.4%
Rent to Value Ratio
Pending
$279,900
3
bds
|
2
ba
|
2,088
sqft
|
built
2010
216 Creekwood Rd, Wilmington, NC 28411
$192
Cash flow
3.6%
Cash-on-Cash Return
7.1%
Cap rate
0.9%
Rent to Value Ratio
Active
$485,000
3
bds
|
4
ba
|
2,178
sqft
|
built
2016
367 Hanover Lakes Dr, Wilmington, NC 28401
$-805
Cash flow
-8.7%
Cash-on-Cash Return
4.3%
Cap rate
0.6%
Rent to Value Ratio

Active
$624,000
5
bds
|
4
ba
|
2,827
sqft
|
built
2005
4029 Berberis Way, Wilmington, NC 28412
$-1,490
Cash flow
-12.5%
Cash-on-Cash Return
3.4%
Cap rate
0.4%
Rent to Value Ratio
Active
$364,900
3
bds
|
3
ba
|
1,968
sqft
|
built
1987
2801 Hobart Dr, Wilmington, NC 28405
$-410
Cash flow
-5.9%
Cash-on-Cash Return
4.9%
Cap rate
0.7%
Rent to Value Ratio
Pending
$280,000
2
bds
|
2
ba
|
1,063
sqft
|
built
1942
2090 Burnett Blvd, Wilmington, NC 28401
$-461
Cash flow
-8.6%
Cash-on-Cash Return
4.3%
Cap rate
0.6%
Rent to Value Ratio
Pending
$315,000
3
bds
|
2
ba
|
1,298
sqft
|
built
1992
4600 Weybridge Ln, Wilmington, NC 28409
$-407
Cash flow
-6.7%
Cash-on-Cash Return
4.7%
Cap rate
0.6%
Rent to Value Ratio

Active
$575,000
4
bds
|
3
ba
|
2,692
sqft
|
built
2019
3303 Oyster Tabby Dr, Wilmington, NC 28412
$-1,024
Cash flow
-9.3%
Cash-on-Cash Return
4.1%
Cap rate
0.6%
Rent to Value Ratio
Pending
$500,000
3
bds
|
3
ba
|
1,905
sqft
|
built
1979
831 Greenbriar Rd, Wilmington, NC 28409
$-795
Cash flow
-8.3%
Cash-on-Cash Return
4.4%
Cap rate
0.6%
Rent to Value Ratio
Active
$280,000
3
bds
|
2
ba
|
1,352
sqft
|
built
2005
9304 Long Putt Ct, Wilmington, NC 28412
$-382
Cash flow
-7.1%
Cash-on-Cash Return
4.6%
Cap rate
0.7%
Rent to Value Ratio

Active
$980,000
5
bds
|
5
ba
|
3,880
sqft
|
built
1984
2118 Gloucester Pl, Wilmington, NC 28403
$-3,317
Cash flow
-17.7%
Cash-on-Cash Return
2.2%
Cap rate
0.3%
Rent to Value Ratio
Active
$1,150,000
5
bds
|
4
ba
|
3,916
sqft
|
built
2016
821 Bedminister Ln, Wilmington, NC 28405
$-3,750
Cash flow
-17.0%
Cash-on-Cash Return
2.4%
Cap rate
0.4%
Rent to Value Ratio

Active
$315,000
3
bds
|
2
ba
|
1,118
sqft
|
built
1971
217 Cathay Rd, Wilmington, NC 28412
$-543
Cash flow
-9.0%
Cash-on-Cash Return
4.2%
Cap rate
0.5%
Rent to Value Ratio
Active
$798,000
4
bds
|
4
ba
|
3,242
sqft
|
built
2006
347 Lockerby Ln, Wilmington, NC 28411
$-2,216
Cash flow
-14.5%
Cash-on-Cash Return
3.0%
Cap rate
0.4%
Rent to Value Ratio
Pending
$439,900
3
bds
|
2
ba
|
1,623
sqft
|
built
1973
125 Hampton Rd N, Wilmington, NC 28409
$-556
Cash flow
-6.6%
Cash-on-Cash Return
4.8%
Cap rate
0.6%
Rent to Value Ratio
Active
$385,000
4
bds
|
3
ba
|
1,729
sqft
|
built
2005
110 Clay St, Wilmington, NC 28405
$-291
Cash flow
-3.9%
Cash-on-Cash Return
5.4%
Cap rate
0.6%
Rent to Value Ratio
Active
$435,000
4
bds
|
3
ba
|
1,813
sqft
|
built
1986
710 Cheryl Ln, Wilmington, NC 28405
$-596
Cash flow
-7.1%
Cash-on-Cash Return
4.6%
Cap rate
0.6%
Rent to Value Ratio
Pending
$459,500
3
bds
|
2
ba
|
1,538
sqft
|
built
1947
109 Barnard Dr, Wilmington, NC 28405
$-745
Cash flow
-8.5%
Cash-on-Cash Return
4.3%
Cap rate
0.6%
Rent to Value Ratio

Active
$239,000
4
bds
|
2
ba
|
1,400
sqft
|
built
1971
1502 N 26th St, Wilmington, NC 28405
$-255
Cash flow
-5.6%
Cash-on-Cash Return
5.0%
Cap rate
0.7%
Rent to Value Ratio

Active
$3,467,500
5
bds
|
4
ba
|
5,750
sqft
|
built
1999
1047 Ocean Ridge Dr, Wilmington, NC 28405
$-16,755
Cash flow
-25.2%
Cash-on-Cash Return
0.5%
Cap rate
0.1%
Rent to Value Ratio
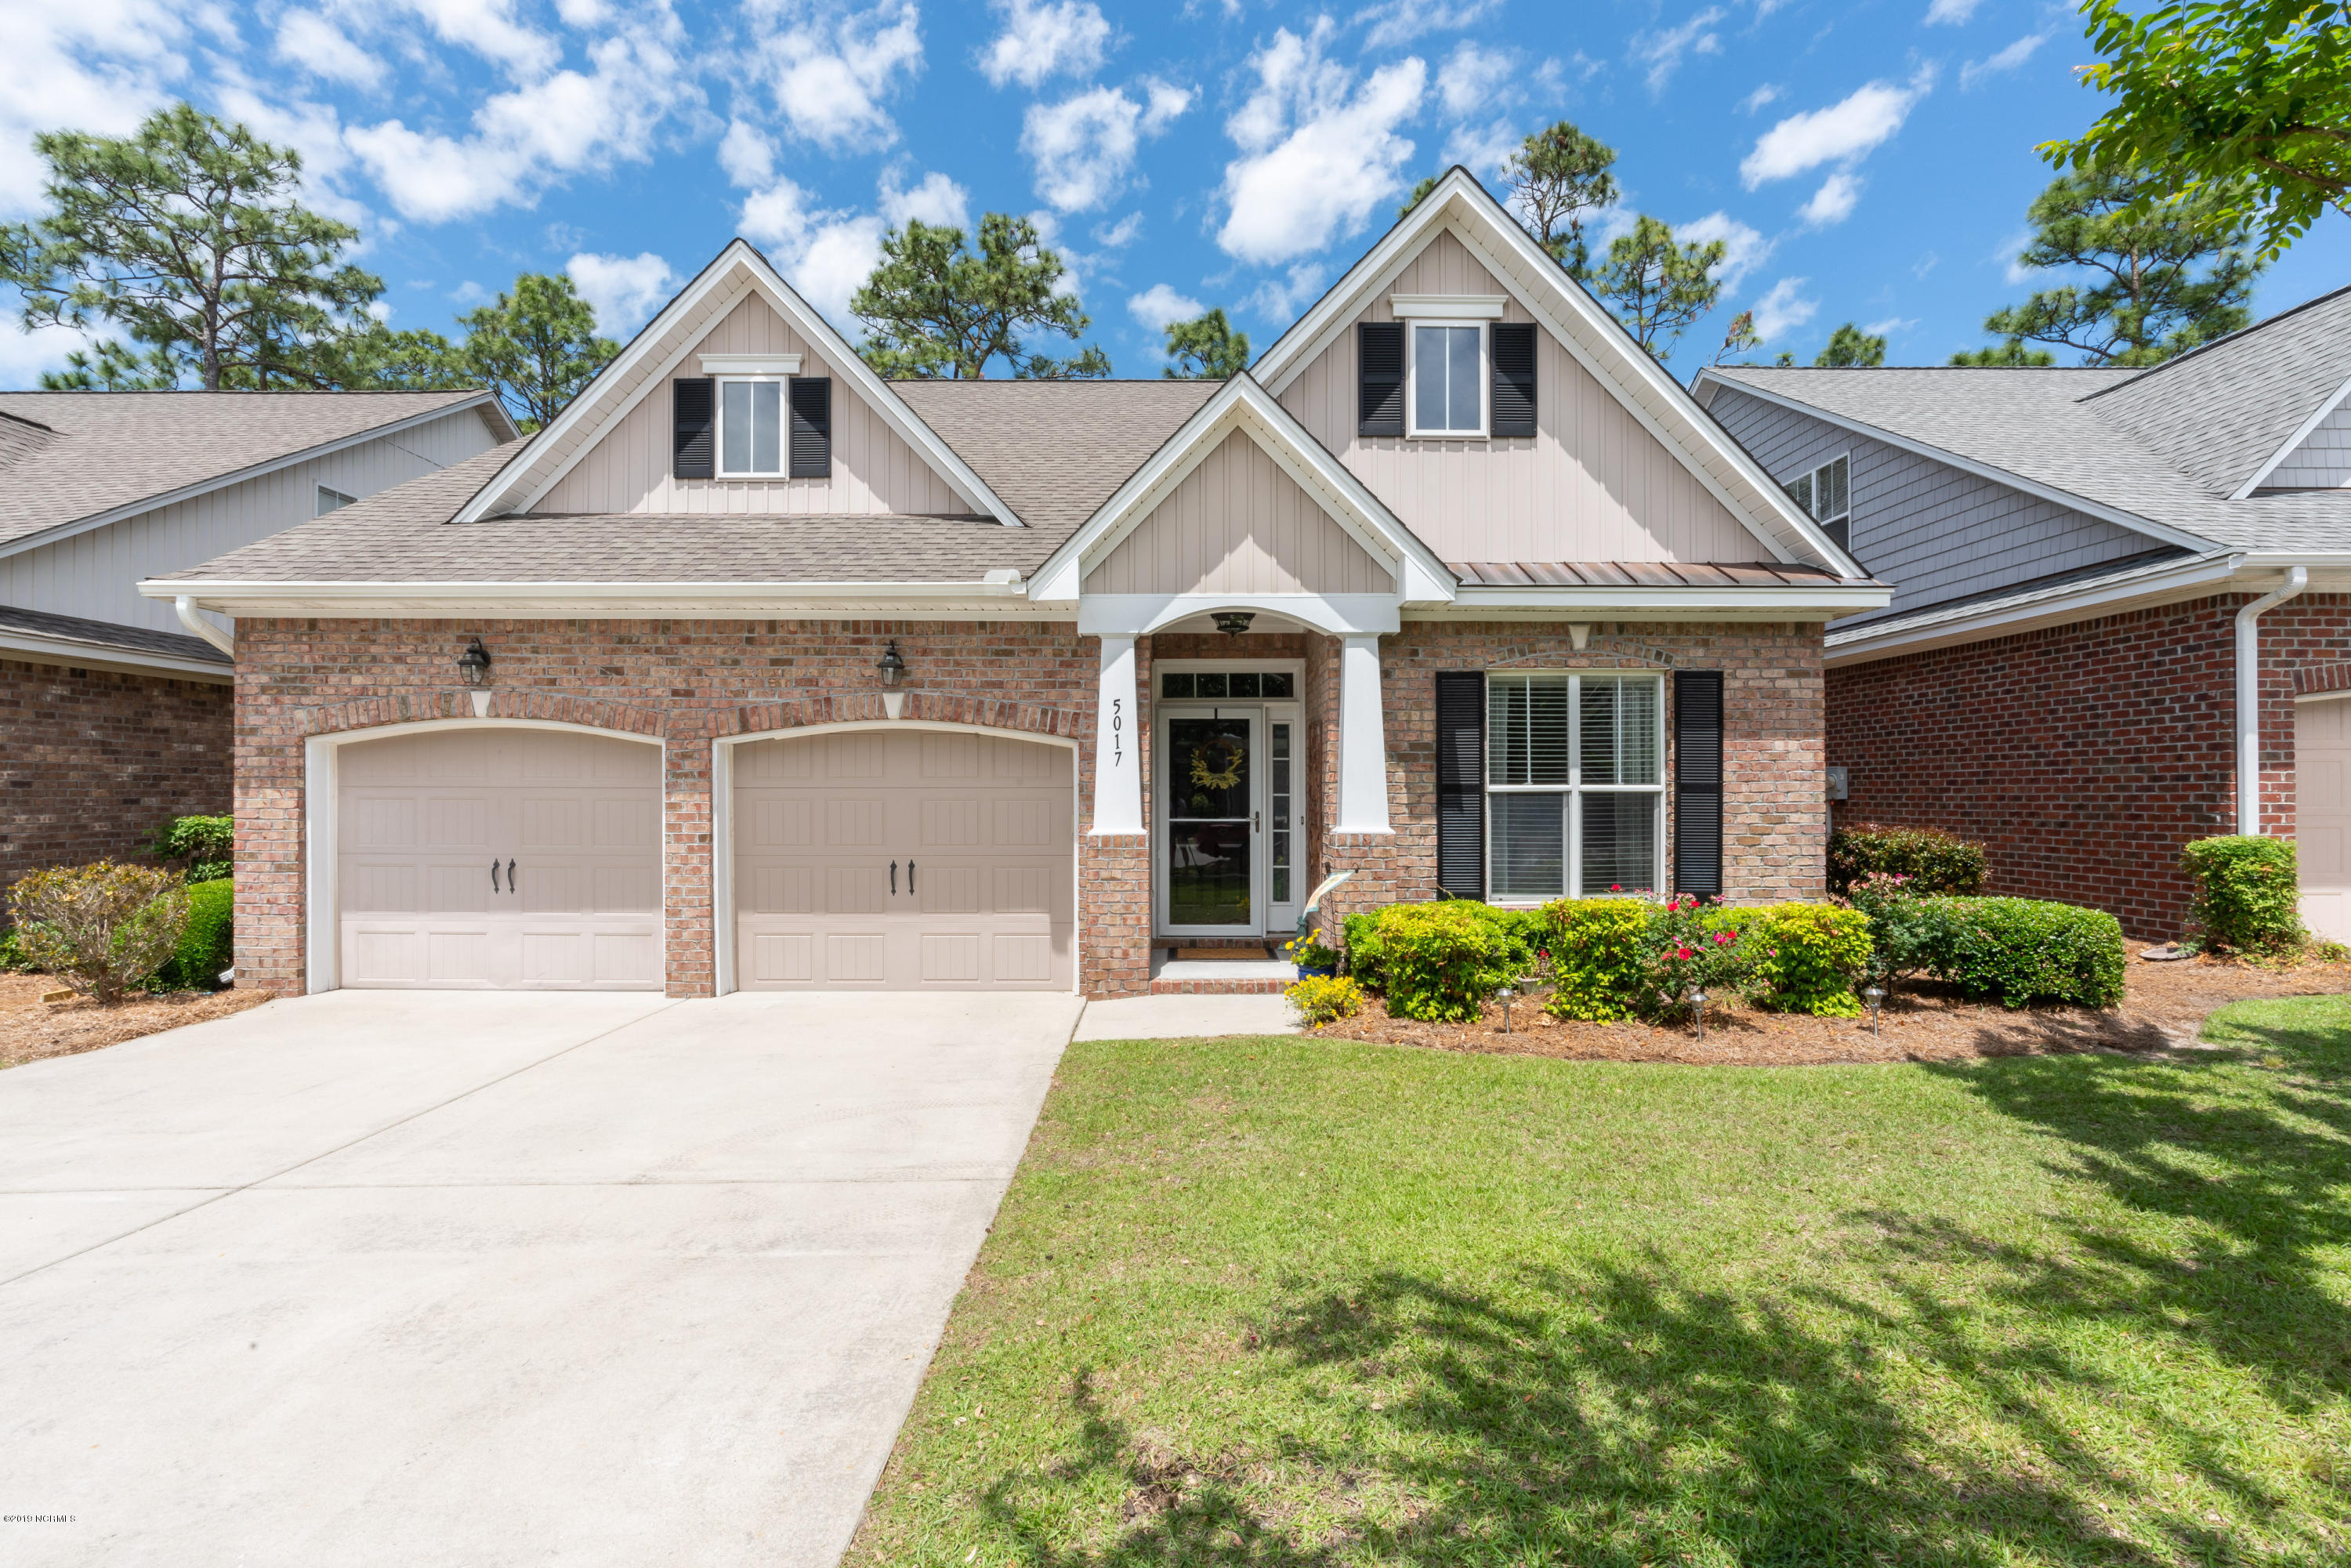
Closed
$344,500
4
bds
|
3
ba
|
2,215
sqft
|
built
2007
5017 Whitner Dr, Wilmington, NC 28409
$-122
Cash flow
-1.8%
Cash-on-Cash Return
5.9%
Cap rate
0.8%
Rent to Value Ratio

Active
$1,775,000
4
bds
|
5
ba
|
4,093
sqft
|
built
2005
1921 Sandwedge Pl, Wilmington, NC 28405
$-6,882
Cash flow
-20.2%
Cash-on-Cash Return
1.6%
Cap rate
0.2%
Rent to Value Ratio

Pending
$318,000
3
bds
|
2
ba
|
1,306
sqft
|
built
2005
2354 Adams St, Wilmington, NC 28401
$-458
Cash flow
-7.5%
Cash-on-Cash Return
4.6%
Cap rate
0.6%
Rent to Value Ratio
Pending
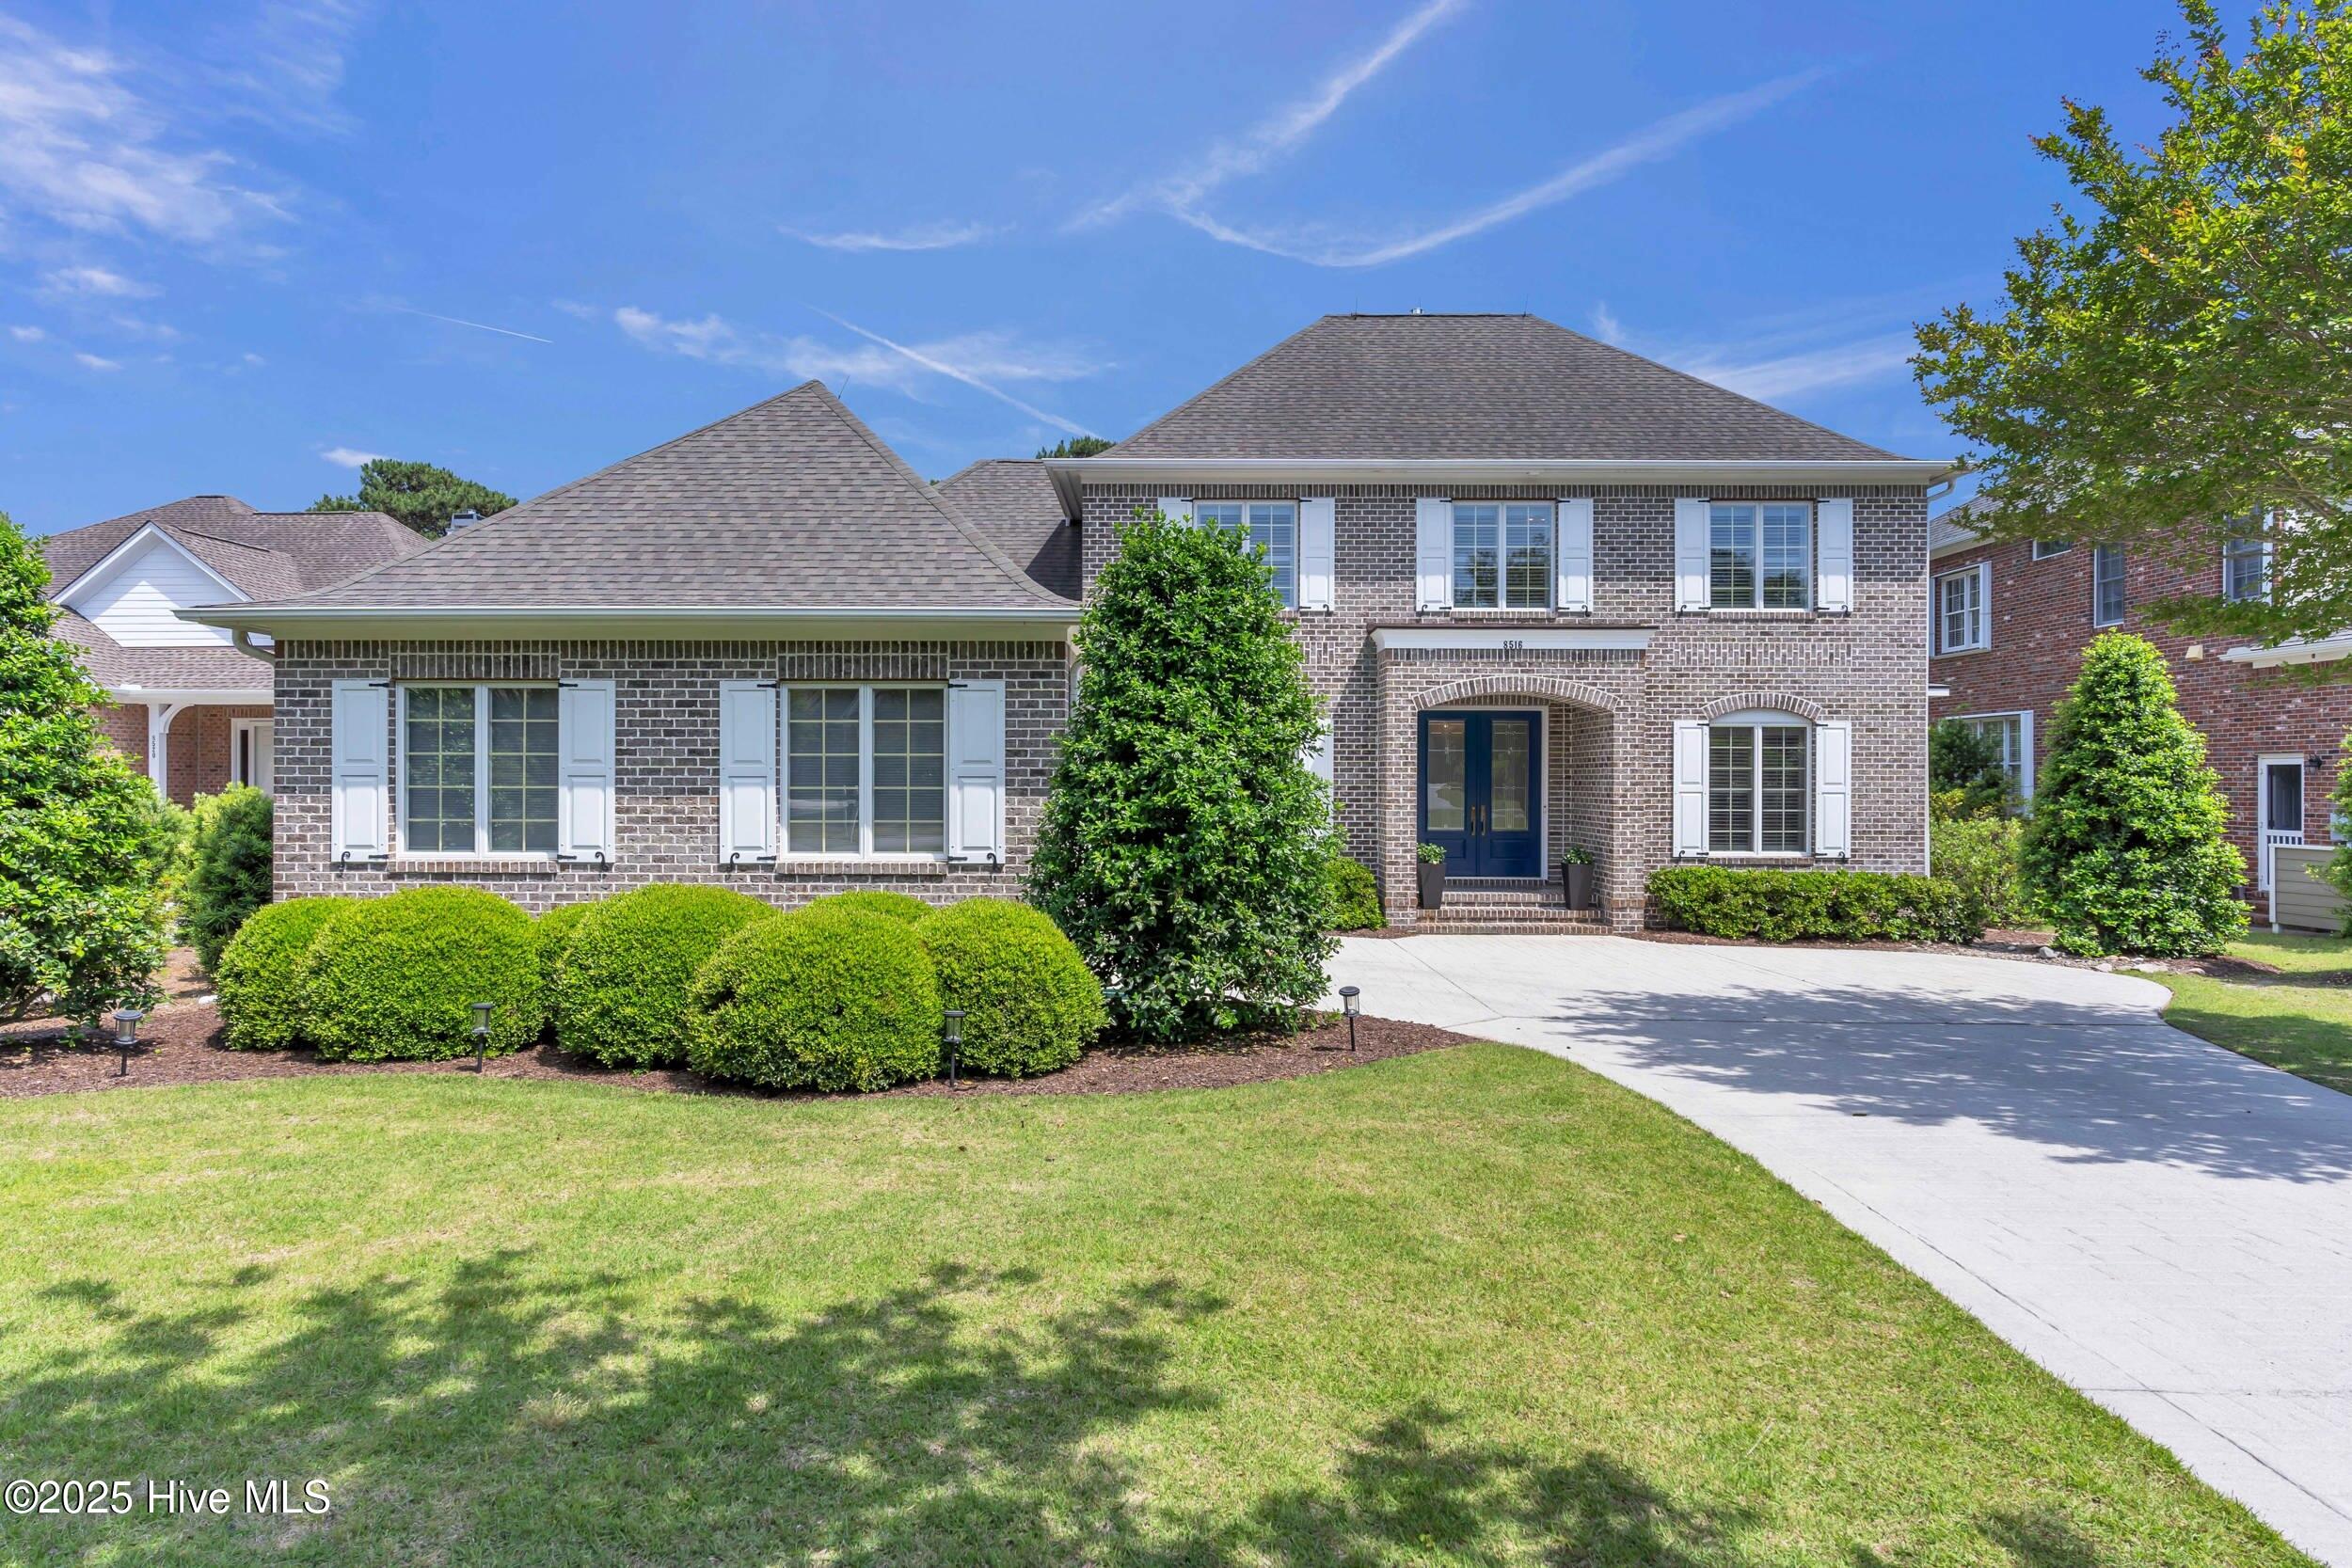
$925,000
4
bds
|
4
ba
|
3,358
sqft
|
built
2002
8516 Galloway National Dr, Wilmington, NC 28411
$-2,685
Cash flow
-15.1%
Cash-on-Cash Return
2.8%
Cap rate
0.4%
Rent to Value Ratio

Active
$425,000
3
bds
|
2
ba
|
1,934
sqft
|
built
1981
517 Kelly Rd, Wilmington, NC 28409
$-705
Cash flow
-8.7%
Cash-on-Cash Return
4.3%
Cap rate
0.6%
Rent to Value Ratio

Pending
$224,000
3
bds
|
2
ba
|
1,292
sqft
|
built
1996
719 Melba Ct, Wilmington, NC 28405
$-368
Cash flow
-8.6%
Cash-on-Cash Return
4.3%
Cap rate
0.8%
Rent to Value Ratio