Wilmington, NC Investment Properties for Sale
Browse homes for sale and investment properties in Wilmington, NC. Refine your search by price, property type, or more.
Best cash flowing properties in Wilmington, NC
Active
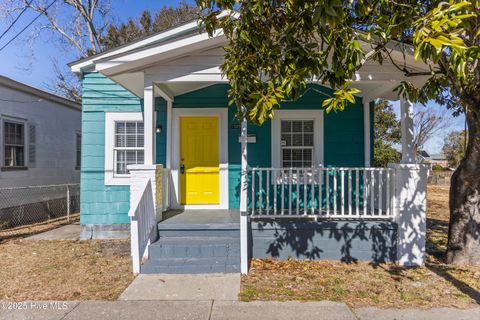
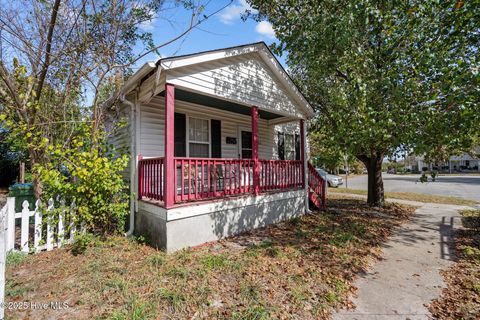
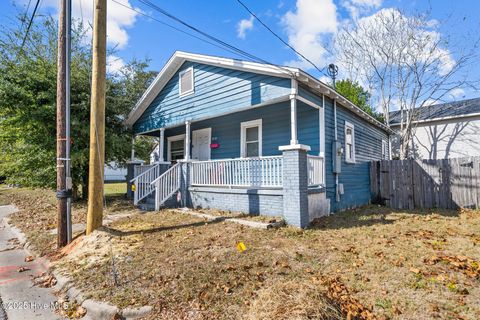
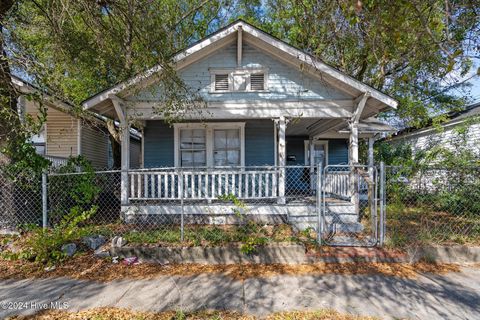
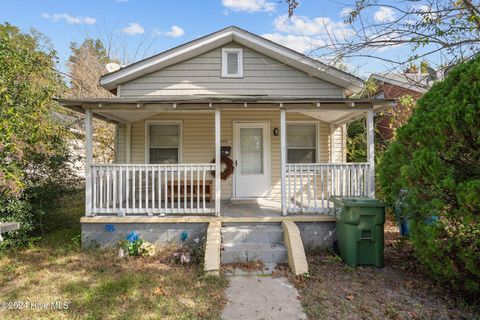
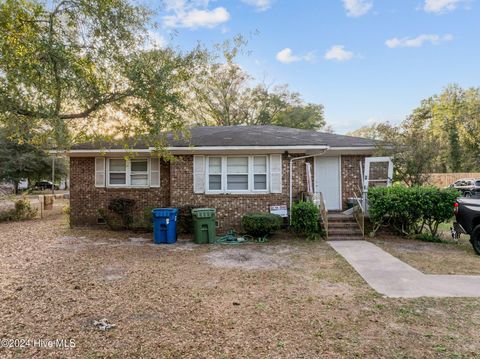
$200,000
3
bds
|
1
ba
|
880
sqft
|
built
1920
1009 Dawson St, Wilmington, NC 28401
$109
Cash flow
2.8%
Cash-on-Cash Return
6.3%
Cap rate
0.8%
Rent to Value Ratio
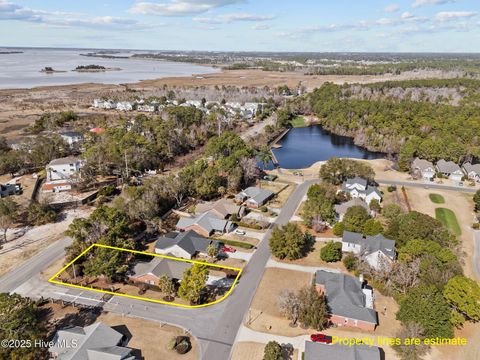
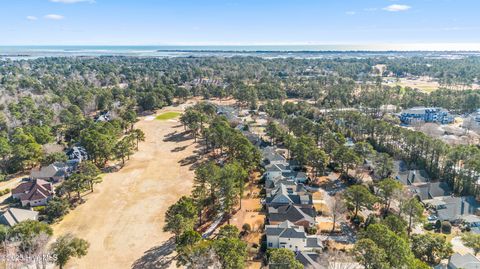
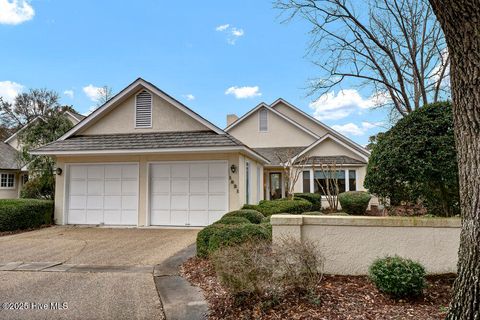
Active
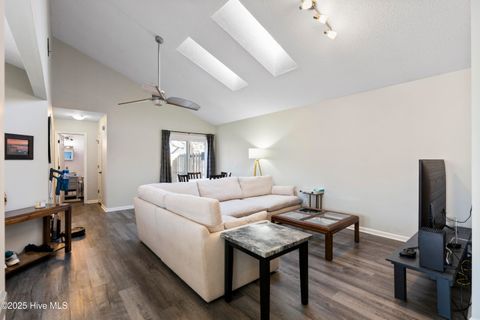
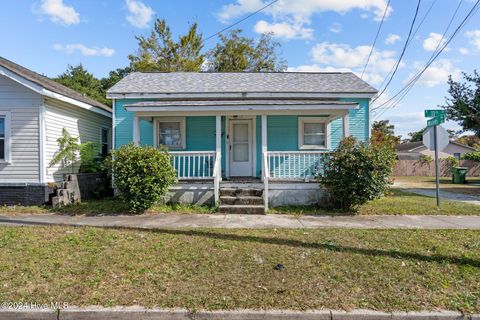
$315,000
3
bds
|
2
ba
|
1,145
sqft
|
built
1988
1234 Shipyard Blvd, Wilmington, NC 28412
$27
Cash flow
0.4%
Cash-on-Cash Return
5.8%
Cap rate
0.7%
Rent to Value Ratio
371 out of 689 properties for sale in Wilmington, NC
Limited Results Shown
Create a free account, or log in to reveal all property listings and enjoy the complete experience.
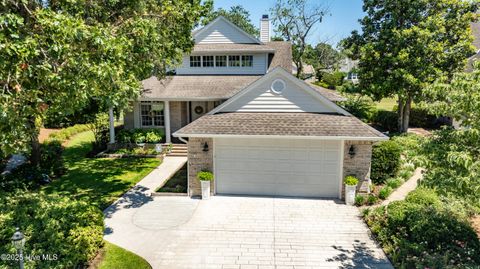
Active
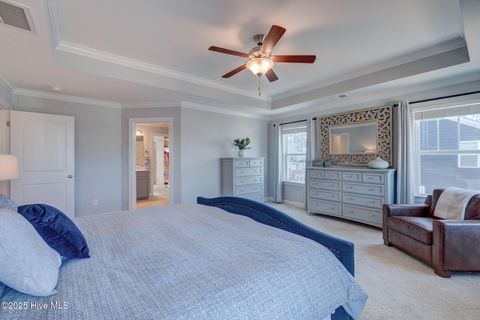
$585,000
4
bds
|
3
ba
|
2,535
sqft
|
built
2019
7219 Twin Ash Ct, Wilmington, NC 28411
$-540
Cash flow
-4.8%
Cash-on-Cash Return
4.6%
Cap rate
0.6%
Rent to Value Ratio
Active
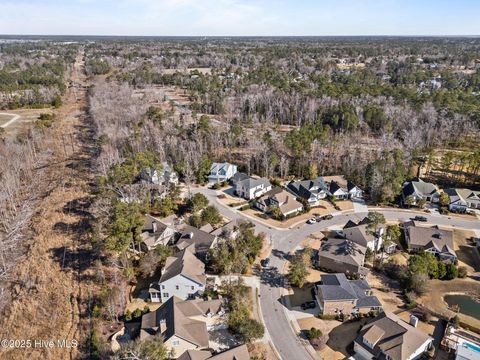
$980,000
5
bds
|
4
ba
|
3,548
sqft
|
built
2013
804 Bedminister Ln, Wilmington, NC 28405
$-2,503
Cash flow
-13.3%
Cash-on-Cash Return
2.6%
Cap rate
0.4%
Rent to Value Ratio

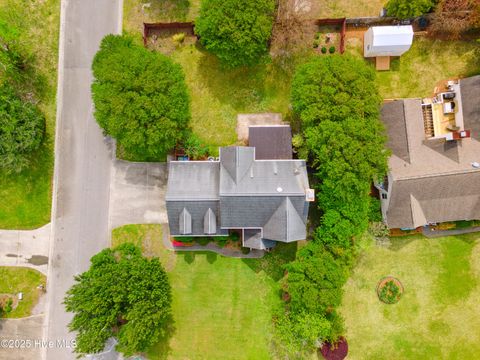
Active
$925,000
4
bds
|
3
ba
|
5,484
sqft
|
built
1913
416 Central Blvd, Wilmington, NC 28401
$-2,930
Cash flow
-16.5%
Cash-on-Cash Return
1.9%
Cap rate
0.3%
Rent to Value Ratio
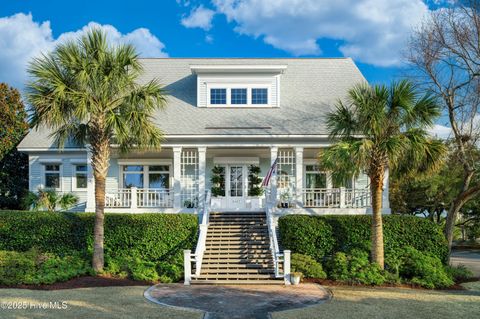
Active
$6,250,000
4
bds
|
3
ba
|
2,436
sqft
|
built
1978
138 Beach Rd S, Wilmington, NC 28411
$-27,402
Cash flow
-22.9%
Cash-on-Cash Return
0.4%
Cap rate
0.1%
Rent to Value Ratio
Pending
$279,900
3
bds
|
2
ba
|
988
sqft
|
built
1996
819 Grace St, Wilmington, NC 28401
$-299
Cash flow
-5.6%
Cash-on-Cash Return
4.4%
Cap rate
0.6%
Rent to Value Ratio
Active
$490,000
3
bds
|
3
ba
|
1,875
sqft
|
built
1998
6148 Sugar Pine Dr, Wilmington, NC 28412
$-645
Cash flow
-6.9%
Cash-on-Cash Return
4.1%
Cap rate
0.5%
Rent to Value Ratio
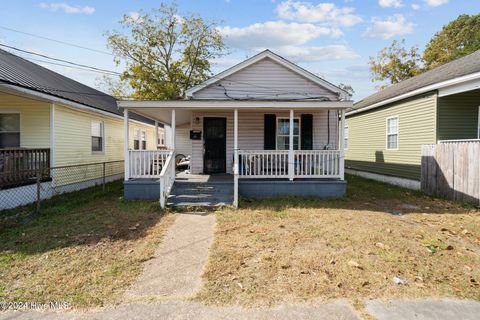
Pending
$229,900
3
bds
|
2
ba
|
1,144
sqft
|
built
1920
618 N 11th St, Wilmington, NC 28401
$16
Cash flow
0.4%
Cash-on-Cash Return
5.8%
Cap rate
0.7%
Rent to Value Ratio
Pending
$264,900
3
bds
|
1
ba
|
1,080
sqft
|
built
1930
922 Dock St, Wilmington, NC 28401
$-364
Cash flow
-7.2%
Cash-on-Cash Return
4.0%
Cap rate
0.5%
Rent to Value Ratio
Pending
$199,900
2
bds
|
1
ba
|
950
sqft
|
built
1938
819 Wooster St, Wilmington, NC 28401
$-98
Cash flow
-2.6%
Cash-on-Cash Return
5.1%
Cap rate
0.7%
Rent to Value Ratio
Pending
$179,900
2
bds
|
1
ba
|
996
sqft
|
built
1920
720 N 11th St, Wilmington, NC 28401
$-110
Cash flow
-3.2%
Cash-on-Cash Return
4.9%
Cap rate
0.7%
Rent to Value Ratio
Pending
$219,900
2
bds
|
1
ba
|
750
sqft
|
built
1930
513 Swann St, Wilmington, NC 28401
$-267
Cash flow
-6.3%
Cash-on-Cash Return
4.2%
Cap rate
0.5%
Rent to Value Ratio
Pending
$254,900
3
bds
|
2
ba
|
1,220
sqft
|
built
2002
626 Taylor St, Wilmington, NC 28401
$-378
Cash flow
-7.7%
Cash-on-Cash Return
3.9%
Cap rate
0.5%
Rent to Value Ratio
Pending
$179,900
3
bds
|
1
ba
|
1,000
sqft
|
built
1920
711 Dawson St, Wilmington, NC 28401
$-16
Cash flow
-0.5%
Cash-on-Cash Return
5.6%
Cap rate
0.7%
Rent to Value Ratio
Active
$395,000
4
bds
|
3
ba
|
1,863
sqft
|
built
2015
6507 Rustling Leaves Way, Wilmington, NC 28409
$-296
Cash flow
-3.9%
Cash-on-Cash Return
4.8%
Cap rate
0.6%
Rent to Value Ratio

Active
$385,000
3
bds
|
2
ba
|
1,598
sqft
|
built
2004
4538 Regent Dr, Wilmington, NC 28412
$-650
Cash flow
-8.8%
Cash-on-Cash Return
3.7%
Cap rate
0.6%
Rent to Value Ratio
Pending
$289,900
3
bds
|
2
ba
|
1,080
sqft
|
built
2009
123 S 10th St, Wilmington, NC 28401
$-292
Cash flow
-5.3%
Cash-on-Cash Return
4.5%
Cap rate
0.6%
Rent to Value Ratio
Pending
$199,900
2
bds
|
2
ba
|
999
sqft
|
built
1920
102 S 11th St, Wilmington, NC 28401
$-159
Cash flow
-4.1%
Cash-on-Cash Return
4.7%
Cap rate
0.7%
Rent to Value Ratio
Active
$1,375,000
3
bds
|
4
ba
|
3,026
sqft
|
built
2004
707 Airlie Rd, Wilmington, NC 28403
$-3,181
Cash flow
-12.1%
Cash-on-Cash Return
2.9%
Cap rate
0.4%
Rent to Value Ratio
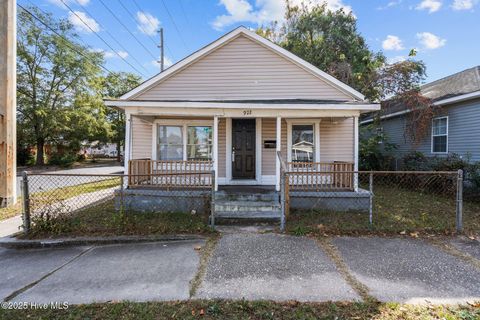
Pending
$194,900
3
bds
|
1
ba
|
901
sqft
|
built
1925
1115 S 6th St, Wilmington, NC 28401
$-94
Cash flow
-2.5%
Cash-on-Cash Return
5.1%
Cap rate
0.6%
Rent to Value Ratio
Pending
$229,900
3
bds
|
1
ba
|
1,229
sqft
|
built
1907
1110 S 8th St, Wilmington, NC 28401
$-222
Cash flow
-5.0%
Cash-on-Cash Return
4.5%
Cap rate
0.6%
Rent to Value Ratio
Active
$720,000
3
bds
|
2
ba
|
1,889
sqft
|
built
1993
1821 Glen Eagles Ln, Wilmington, NC 28405
$-1,780
Cash flow
-12.9%
Cash-on-Cash Return
2.7%
Cap rate
0.5%
Rent to Value Ratio
Pending
$269,900
3
bds
|
2
ba
|
1,196
sqft
|
built
1971
2728 Worth Dr, Wilmington, NC 28412
$-434
Cash flow
-8.4%
Cash-on-Cash Return
3.7%
Cap rate
0.5%
Rent to Value Ratio

Active
$450,000
3
bds
|
3
ba
|
2,139
sqft
|
built
1994
2018 Jumpin Run Dr, Wilmington, NC 28403
$-959
Cash flow
-11.1%
Cash-on-Cash Return
3.1%
Cap rate
0.6%
Rent to Value Ratio

Active
$850,000
4
bds
|
5
ba
|
3,066
sqft
|
built
2018
19 Hobie Run, Wilmington, NC 28412
$-1,967
Cash flow
-12.1%
Cash-on-Cash Return
2.9%
Cap rate
0.5%
Rent to Value Ratio
Active
$850,000
4
bds
|
3
ba
|
2,716
sqft
|
built
1997
427 Black Diamond Dr, Wilmington, NC 28411
$-1,717
Cash flow
-10.5%
Cash-on-Cash Return
3.3%
Cap rate
0.5%
Rent to Value Ratio
Active
$575,000
3
bds
|
3
ba
|
2,275
sqft
|
built
1991
3501 Kyle Ct, Wilmington, NC 28409
$-819
Cash flow
-7.4%
Cash-on-Cash Return
4.0%
Cap rate
0.5%
Rent to Value Ratio
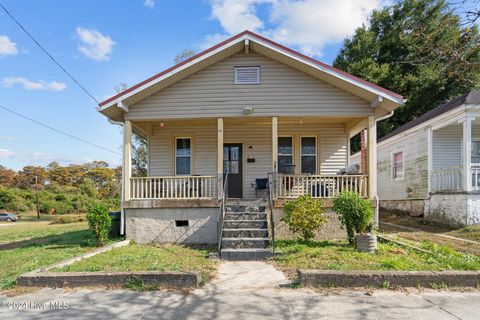
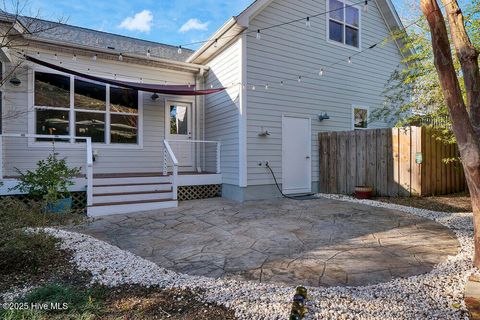
Active
$200,000
3
bds
|
1
ba
|
880
sqft
|
built
1920
1009 Dawson St, Wilmington, NC 28401
$109
Cash flow
2.8%
Cash-on-Cash Return
6.3%
Cap rate
0.8%
Rent to Value Ratio

Active
$385,000
2
bds
|
3
ba
|
1,065
sqft
|
built
2020
1375 S 3rd St, Wilmington, NC 28401
$-825
Cash flow
-11.2%
Cash-on-Cash Return
3.1%
Cap rate
0.6%
Rent to Value Ratio
Active
$3,450,000
5
bds
|
5
ba
|
5,573
sqft
|
built
1999
6433 Shinn Creek Ln, Wilmington, NC 28409
$-12,065
Cash flow
-18.2%
Cash-on-Cash Return
1.5%
Cap rate
0.2%
Rent to Value Ratio
Active
$645,000
1
bds
|
2
ba
|
1,027
sqft
|
built
2019
240 N Water St, Wilmington, NC 28401
$-1,235
Cash flow
-10.0%
Cash-on-Cash Return
3.4%
Cap rate
0.4%
Rent to Value Ratio

Active
$400,000
3
bds
|
3
ba
|
2,030
sqft
|
built
1997
809 Ruffin St, Wilmington, NC 28412
$-598
Cash flow
-7.8%
Cash-on-Cash Return
3.9%
Cap rate
0.6%
Rent to Value Ratio
Active
$1,200,000
5
bds
|
4
ba
|
4,059
sqft
|
built
1997
8700 Fazio Dr, Wilmington, NC 28411
$-2,545
Cash flow
-11.1%
Cash-on-Cash Return
3.1%
Cap rate
0.4%
Rent to Value Ratio
Active
$475,000
3
bds
|
3
ba
|
1,601
sqft
|
built
1894
215 Queen St, Wilmington, NC 28401
$-494
Cash flow
-5.4%
Cash-on-Cash Return
4.4%
Cap rate
0.6%
Rent to Value Ratio
Active
$534,900
3
bds
|
2
ba
|
1,710
sqft
|
built
2005
803 Bonham Ave, Wilmington, NC 28403
$-530
Cash flow
-5.2%
Cash-on-Cash Return
4.5%
Cap rate
0.5%
Rent to Value Ratio
Active
$399,000
3
bds
|
2
ba
|
1,413
sqft
|
built
1959
2024 Market St, Wilmington, NC 28403
$-232
Cash flow
-3.0%
Cash-on-Cash Return
5.0%
Cap rate
0.7%
Rent to Value Ratio

Active
$759,900
3
bds
|
4
ba
|
2,092
sqft
|
built
2020
160 Dugger Ln, Wilmington, NC 28412
$-1,769
Cash flow
-12.1%
Cash-on-Cash Return
2.9%
Cap rate
0.5%
Rent to Value Ratio

Active
$275,000
3
bds
|
3
ba
|
1,395
sqft
|
built
1996
321 S Kerr Ave, Wilmington, NC 28403
$-59
Cash flow
-1.1%
Cash-on-Cash Return
5.4%
Cap rate
0.7%
Rent to Value Ratio

Active
$625,000
4
bds
|
5
ba
|
3,810
sqft
|
built
2021
120 Claytor Lake Ct, Wilmington, NC 28401
$-841
Cash flow
-7.0%
Cash-on-Cash Return
4.1%
Cap rate
0.6%
Rent to Value Ratio
Active
$315,000
3
bds
|
2
ba
|
1,145
sqft
|
built
1988
1234 Shipyard Blvd, Wilmington, NC 28412
$27
Cash flow
0.4%
Cash-on-Cash Return
5.8%
Cap rate
0.7%
Rent to Value Ratio

Active
$1,099,000
5
bds
|
5
ba
|
3,910
sqft
|
built
2018
828 Cupola Dr, Wilmington, NC 28409
$-2,166
Cash flow
-10.3%
Cash-on-Cash Return
3.3%
Cap rate
0.5%
Rent to Value Ratio