Wilmington, NC Investment Properties for Sale
Browse homes for sale and investment properties in Wilmington, NC. Refine your search by price, property type, or more.
Best cash flowing properties in Wilmington, NC
Active
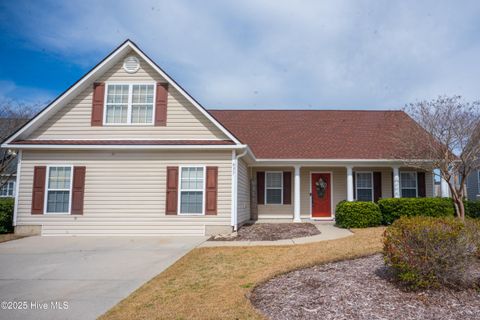
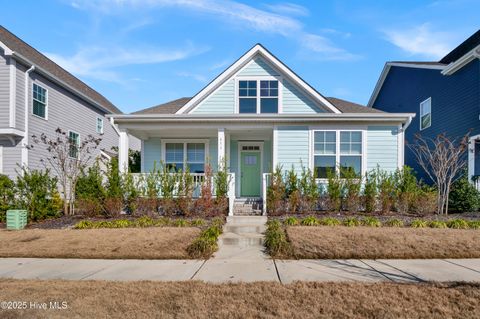
$315,000
3
bds
|
2
ba
|
1,145
sqft
|
built
1988
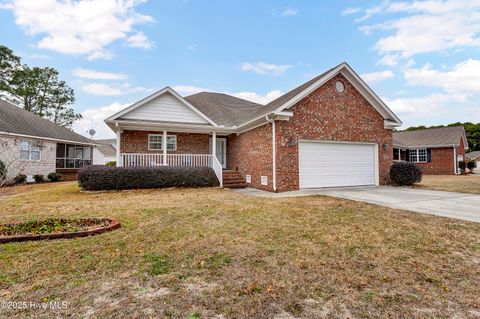
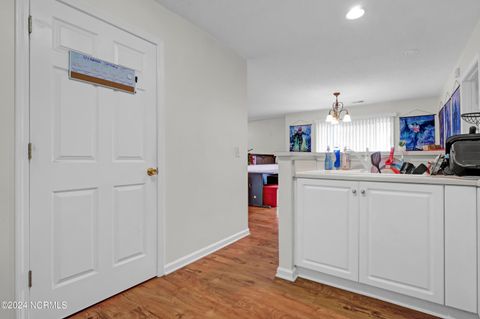
1234 Shipyard Blvd, Wilmington, NC 28412
$-127
Cash flow
-2.1%
Cash-on-Cash Return
5.8%
Cap rate
0.7%
Rent to Value Ratio
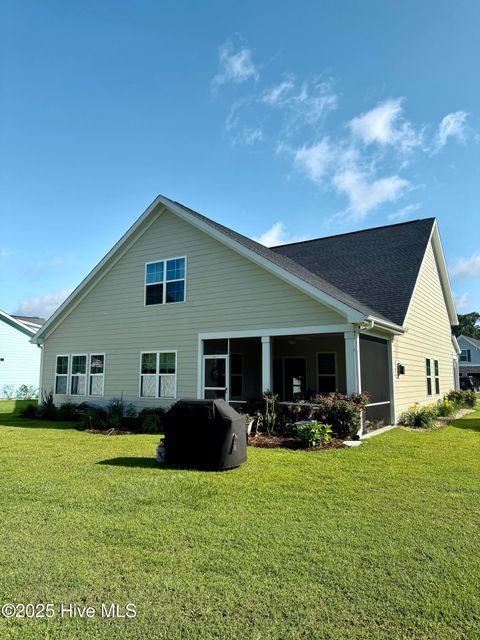
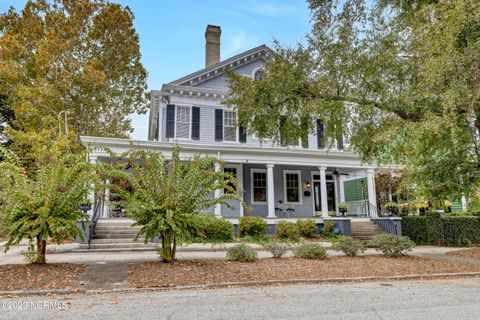
Active
$325,000
3
bds
|
2
ba
|
1,152
sqft
|
built
1941
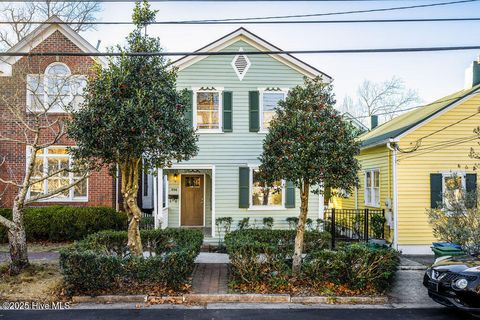
3262 Camden Cir, Wilmington, NC 28403
$-173
Cash flow
-2.8%
Cash-on-Cash Return
5.6%
Cap rate
0.7%
Rent to Value Ratio
373 out of 692 properties for sale in Wilmington, NC
Limited Results Shown
Create a free account, or log in to reveal all property listings and enjoy the complete experience.
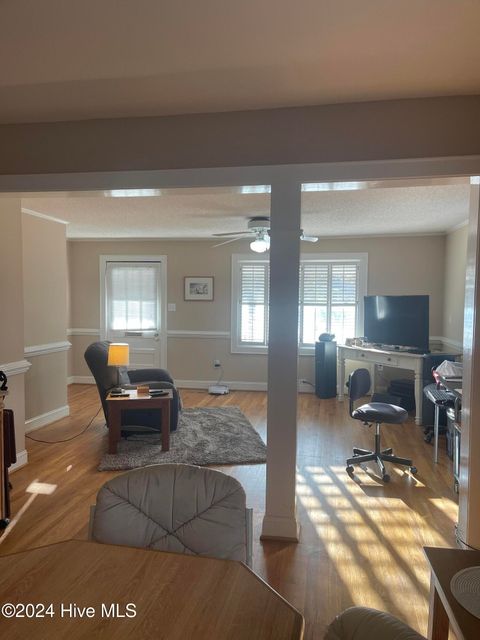
Active
$315,000
3
bds
|
2
ba
|
1,145
sqft
|
built
1988
1234 Shipyard Blvd, Wilmington, NC 28412
$-127
Cash flow
-2.1%
Cash-on-Cash Return
5.8%
Cap rate
0.7%
Rent to Value Ratio

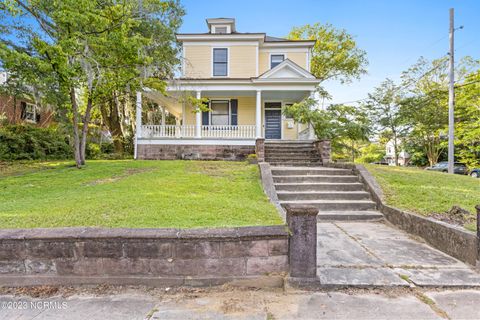
Active
$1,099,000
5
bds
|
5
ba
|
3,910
sqft
|
built
2018
828 Cupola Dr, Wilmington, NC 28409
$-2,703
Cash flow
-12.8%
Cash-on-Cash Return
3.3%
Cap rate
0.5%
Rent to Value Ratio
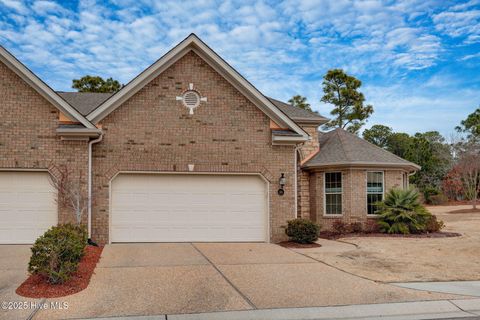
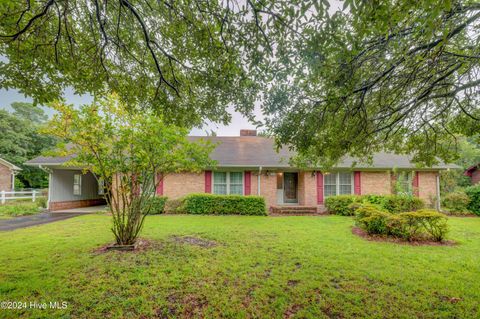
Active
$499,000
4
bds
|
3
ba
|
2,324
sqft
|
built
1966
201 Monterey Dr, Wilmington, NC 28409
$-485
Cash flow
-5.1%
Cash-on-Cash Return
5.1%
Cap rate
0.6%
Rent to Value Ratio
Active
$1,595,000
4
bds
|
4
ba
|
3,548
sqft
|
built
1997
1105 Arboretum Dr, Wilmington, NC 28405
$-4,319
Cash flow
-14.1%
Cash-on-Cash Return
3.0%
Cap rate
0.4%
Rent to Value Ratio
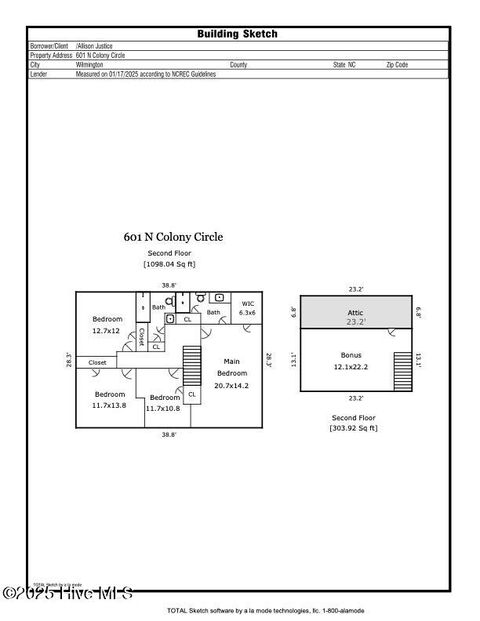
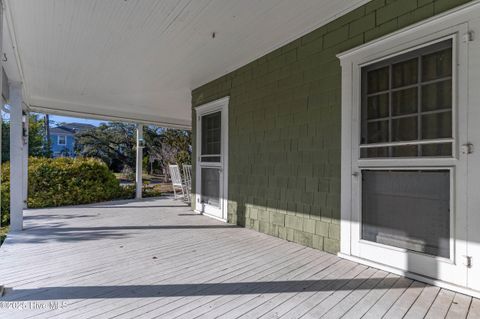
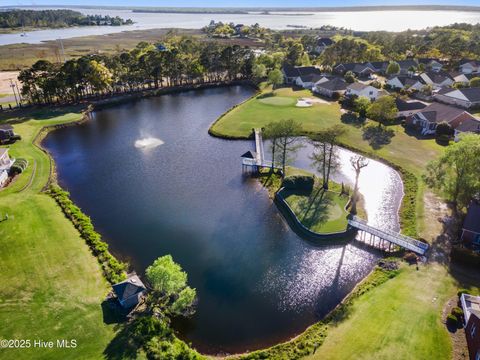
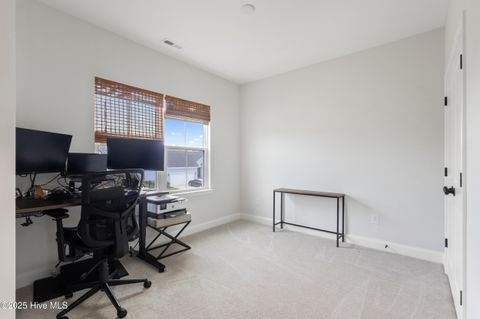
Active
$570,000
4
bds
|
3
ba
|
2,919
sqft
|
built
1987
601 Colony Cir N, Wilmington, NC 28409
$-1,051
Cash flow
-9.6%
Cash-on-Cash Return
4.1%
Cap rate
0.5%
Rent to Value Ratio
Active
$629,000
3
bds
|
2
ba
|
2,333
sqft
|
built
1921
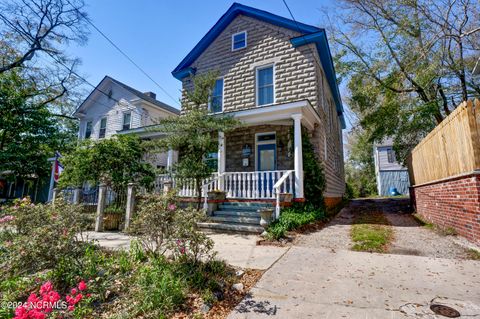
212 N 16th St, Wilmington, NC 28401
$-1,341
Cash flow
-11.1%
Cash-on-Cash Return
3.7%
Cap rate
0.5%
Rent to Value Ratio
Active
$325,000
3
bds
|
2
ba
|
1,152
sqft
|
built
1941
3262 Camden Cir, Wilmington, NC 28403
$-173
Cash flow
-2.8%
Cash-on-Cash Return
5.6%
Cap rate
0.7%
Rent to Value Ratio
Pending
$399,000
3
bds
|
2
ba
|
2,020
sqft
|
built
2004
7838 Trap Way, Wilmington, NC 28412
$-681
Cash flow
-8.9%
Cash-on-Cash Return
4.2%
Cap rate
0.6%
Rent to Value Ratio
Active
$519,000
3
bds
|
3
ba
|
1,971
sqft
|
built
2023
826 Trisail Ter, Wilmington, NC 28412
$-869
Cash flow
-8.7%
Cash-on-Cash Return
4.3%
Cap rate
0.6%
Rent to Value Ratio

Active
$549,000
6
bds
|
4
ba
|
0
sqft
|
built
2001
210 S 9th St, Wilmington, NC 28401
$-1,751
Cash flow
-16.6%
Cash-on-Cash Return
2.4%
Cap rate
0.4%
Rent to Value Ratio
Active
$395,000
4
bds
|
2
ba
|
2,422
sqft
|
built
2004
637 Hillside Dr, Wilmington, NC 28412
$-510
Cash flow
-6.7%
Cash-on-Cash Return
4.7%
Cap rate
0.6%
Rent to Value Ratio

Active
$523,000
3
bds
|
3
ba
|
2,533
sqft
|
built
2014
333 Motts Forest Rd, Wilmington, NC 28412
$-1,515
Cash flow
-15.1%
Cash-on-Cash Return
2.8%
Cap rate
0.6%
Rent to Value Ratio
Active
$574,900
3
bds
|
3
ba
|
2,694
sqft
|
built
2020
1512 Grove Ln, Wilmington, NC 28409
$-946
Cash flow
-8.6%
Cash-on-Cash Return
4.3%
Cap rate
0.6%
Rent to Value Ratio
Pending
$639,900
3
bds
|
3
ba
|
2,345
sqft
|
built
1887
1419 Market St, Wilmington, NC 28401
$-1,164
Cash flow
-9.5%
Cash-on-Cash Return
4.1%
Cap rate
0.5%
Rent to Value Ratio
Active
$535,000
3
bds
|
2
ba
|
2,074
sqft
|
built
2013
315 Motts Forest Rd, Wilmington, NC 28412
$-1,426
Cash flow
-13.9%
Cash-on-Cash Return
3.1%
Cap rate
0.6%
Rent to Value Ratio
Active
$379,000
2
bds
|
3
ba
|
1,059
sqft
|
built
2019
1373 S 3rd St, Wilmington, NC 28401
$-1,051
Cash flow
-14.5%
Cash-on-Cash Return
2.9%
Cap rate
0.6%
Rent to Value Ratio
Active
$462,900
3
bds
|
3
ba
|
2,100
sqft
|
built
2004
7773 Cypress Island Dr, Wilmington, NC 28412
$-812
Cash flow
-9.2%
Cash-on-Cash Return
4.2%
Cap rate
0.6%
Rent to Value Ratio
Active
$253,900
2
bds
|
2
ba
|
1,483
sqft
|
built
2000
4140 Breezewood Dr, Wilmington, NC 28412
$-414
Cash flow
-8.5%
Cash-on-Cash Return
4.3%
Cap rate
0.7%
Rent to Value Ratio
Active
$450,000
3
bds
|
2
ba
|
1,200
sqft
|
built
1947
504 S 2nd St, Wilmington, NC 28401
$-520
Cash flow
-6.0%
Cash-on-Cash Return
4.9%
Cap rate
0.6%
Rent to Value Ratio
Active
$430,000
3
bds
|
3
ba
|
1,592
sqft
|
built
2017
208 Marstellar St, Wilmington, NC 28401
$-825
Cash flow
-10.0%
Cash-on-Cash Return
4.0%
Cap rate
0.5%
Rent to Value Ratio
Active
$520,000
3
bds
|
2
ba
|
2,161
sqft
|
built
2020
653 Edgerton Dr, Wilmington, NC 28412
$-632
Cash flow
-6.3%
Cash-on-Cash Return
4.8%
Cap rate
0.6%
Rent to Value Ratio
Active
$1,099,000
6
bds
|
5
ba
|
5,308
sqft
|
built
1912
106 S 5th Ave, Wilmington, NC 28401
$-4,500
Cash flow
-21.4%
Cash-on-Cash Return
1.4%
Cap rate
0.2%
Rent to Value Ratio
Active
$725,000
3
bds
|
1
ba
|
1,405
sqft
|
built
1900
2113 Wrightsville Ave, Wilmington, NC 28403
$-2,404
Cash flow
-17.3%
Cash-on-Cash Return
2.3%
Cap rate
0.3%
Rent to Value Ratio
Active
$495,000
3
bds
|
2
ba
|
1,852
sqft
|
built
1965
5021 College Acres Dr, Wilmington, NC 28403
$-721
Cash flow
-7.6%
Cash-on-Cash Return
4.5%
Cap rate
0.5%
Rent to Value Ratio
Active
$419,900
4
bds
|
3
ba
|
2,048
sqft
|
built
2003
7204 Courtney Pines Rd, Wilmington, NC 28411
$-492
Cash flow
-6.1%
Cash-on-Cash Return
4.9%
Cap rate
0.6%
Rent to Value Ratio
Active
$2,095,000
5
bds
|
6
ba
|
6,452
sqft
|
built
1999
141 Middle Oaks Dr, Wilmington, NC 28409
$-7,211
Cash flow
-18.0%
Cash-on-Cash Return
2.1%
Cap rate
0.3%
Rent to Value Ratio

Active
$275,000
3
bds
|
2
ba
|
0
sqft
|
built
1910
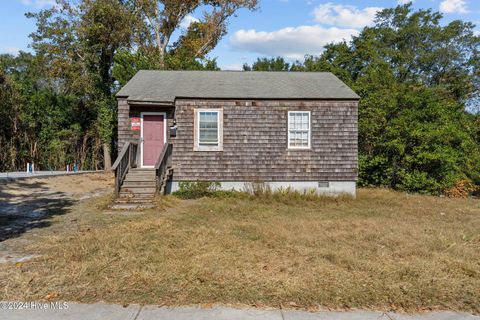
909 S 10th St, Wilmington, NC 28401
$-269
Cash flow
-5.1%
Cash-on-Cash Return
5.1%
Cap rate
0.7%
Rent to Value Ratio
Active
$279,000
3
bds
|
2
ba
|
1,352
sqft
|
built
2002
2113 Market St, Wilmington, NC 28403
$-416
Cash flow
-7.8%
Cash-on-Cash Return
4.5%
Cap rate
0.6%
Rent to Value Ratio
Active
$620,000
5
bds
|
3
ba
|
3,078
sqft
|
built
2001
7319 Thurgood Rd, Wilmington, NC 28411
$-989
Cash flow
-8.3%
Cash-on-Cash Return
4.4%
Cap rate
0.6%
Rent to Value Ratio
Active
$670,000
3
bds
|
2
ba
|
2,308
sqft
|
built
1905
610 S 3rd St, Wilmington, NC 28401
$-1,560
Cash flow
-12.1%
Cash-on-Cash Return
3.5%
Cap rate
0.5%
Rent to Value Ratio
Pending
$174,900
2
bds
|
1
ba
|
696
sqft
|
built
1983
1015 Queen St, Wilmington, NC 28401
$-258
Cash flow
-7.7%
Cash-on-Cash Return
4.5%
Cap rate
0.6%
Rent to Value Ratio
Active
$639,000
4
bds
|
3
ba
|
3,103
sqft
|
built
2017
4104 Passerine Ave, Wilmington, NC 28412
$-1,739
Cash flow
-14.2%
Cash-on-Cash Return
3.0%
Cap rate
0.5%
Rent to Value Ratio
Active
$495,000
3
bds
|
2
ba
|
1,770
sqft
|
built
1985
631 The Cape Blvd, Wilmington, NC 28412
$-723
Cash flow
-7.6%
Cash-on-Cash Return
4.5%
Cap rate
0.6%
Rent to Value Ratio
Active
$300,000
2
bds
|
1
ba
|
870
sqft
|
built
1941
2304 Princess Place Dr, Wilmington, NC 28405
$-574
Cash flow
-10.0%
Cash-on-Cash Return
4.0%
Cap rate
0.5%
Rent to Value Ratio
Active
$207,500
2
bds
|
2
ba
|
803
sqft
|
built
1984
4575 Holly Tree Rd, Wilmington, NC 28412
$-200
Cash flow
-5.0%
Cash-on-Cash Return
5.1%
Cap rate
0.7%
Rent to Value Ratio

Active
$575,000
4
bds
|
4
ba
|
2,704
sqft
|
built
2020
1253 Lt Congleton Rd, Wilmington, NC 28409
$-862
Cash flow
-7.8%
Cash-on-Cash Return
4.5%
Cap rate
0.6%
Rent to Value Ratio
Active
$264,800
2
bds
|
2
ba
|
1,433
sqft
|
built
1998
4158 Breezewood Dr, Wilmington, NC 28412
$-470
Cash flow
-9.3%
Cash-on-Cash Return
4.1%
Cap rate
0.7%
Rent to Value Ratio
Active
$2,999,999
2
bds
|
2
ba
|
1,922
sqft
|
built
1995
1324 Final Landing Ln, Wilmington, NC 28411
$-13,134
Cash flow
-22.8%
Cash-on-Cash Return
1.0%
Cap rate
0.2%
Rent to Value Ratio
Pending
$375,000
1
bds
|
1
ba
|
585
sqft
|
built
2000
106 N Water St, Wilmington, NC 28401
$-1,345
Cash flow
-18.7%
Cash-on-Cash Return
2.0%
Cap rate
0.4%
Rent to Value Ratio
Active
$990,000
6
bds
|
5
ba
|
5,467
sqft
|
built
1948
708 Market St, Wilmington, NC 28401
$-2,162
Cash flow
-11.4%
Cash-on-Cash Return
3.6%
Cap rate
0.5%
Rent to Value Ratio