Wilmington, NC Investment Properties for Sale
Browse homes for sale and investment properties in Wilmington, NC. Refine your search by price, property type, or more.
Best cash flowing properties in Wilmington, NC

Active
$230,000
3
bds
|
2
ba
|
964
sqft
|
built
1999
1202 S 8th St, Wilmington, NC 28401
$-290
Cash flow
-6.6%
Cash-on-Cash Return
4.8%
Cap rate
0.7%
Rent to Value Ratio
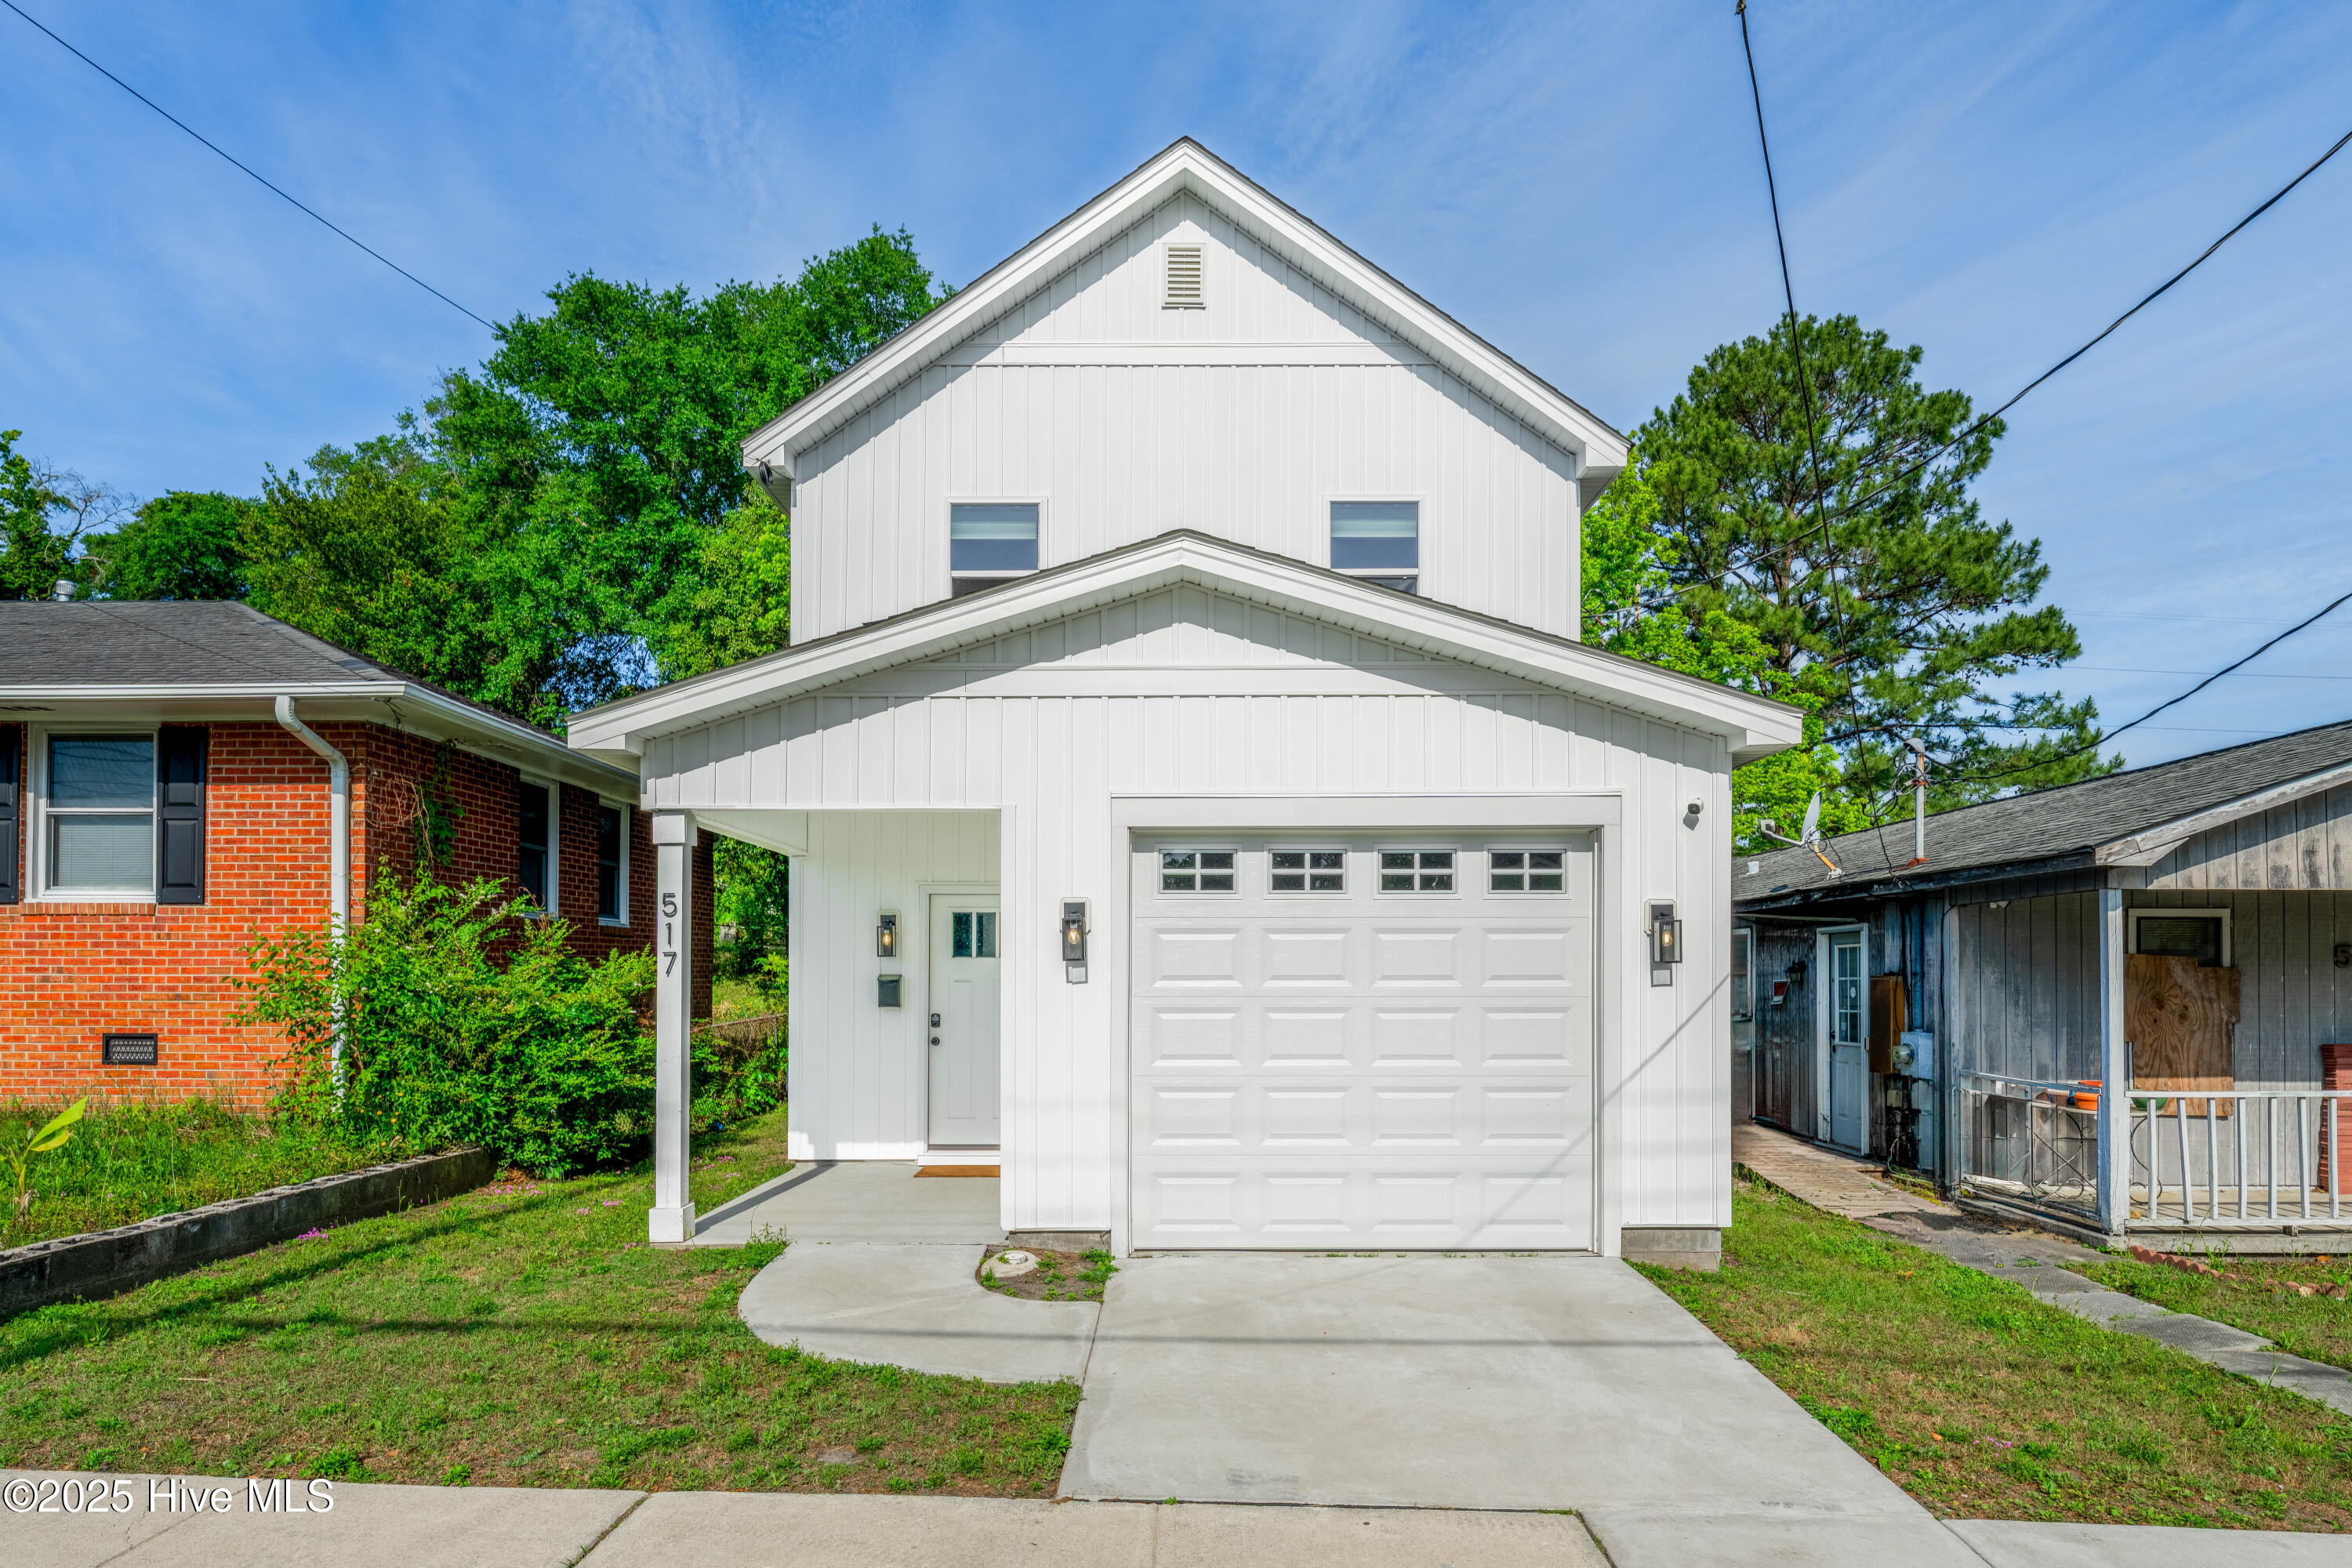
Active
$390,000
3
bds
|
3
ba
|
1,756
sqft
|
built
2023
517 N 11th St, Wilmington, NC 28401
$-425
Cash flow
-5.7%
Cash-on-Cash Return
5.0%
Cap rate
0.7%
Rent to Value Ratio
375 out of 695 properties for sale in Wilmington, NC
Limited Results Shown
Create a free account, or log in to reveal all property listings and enjoy the complete experience.
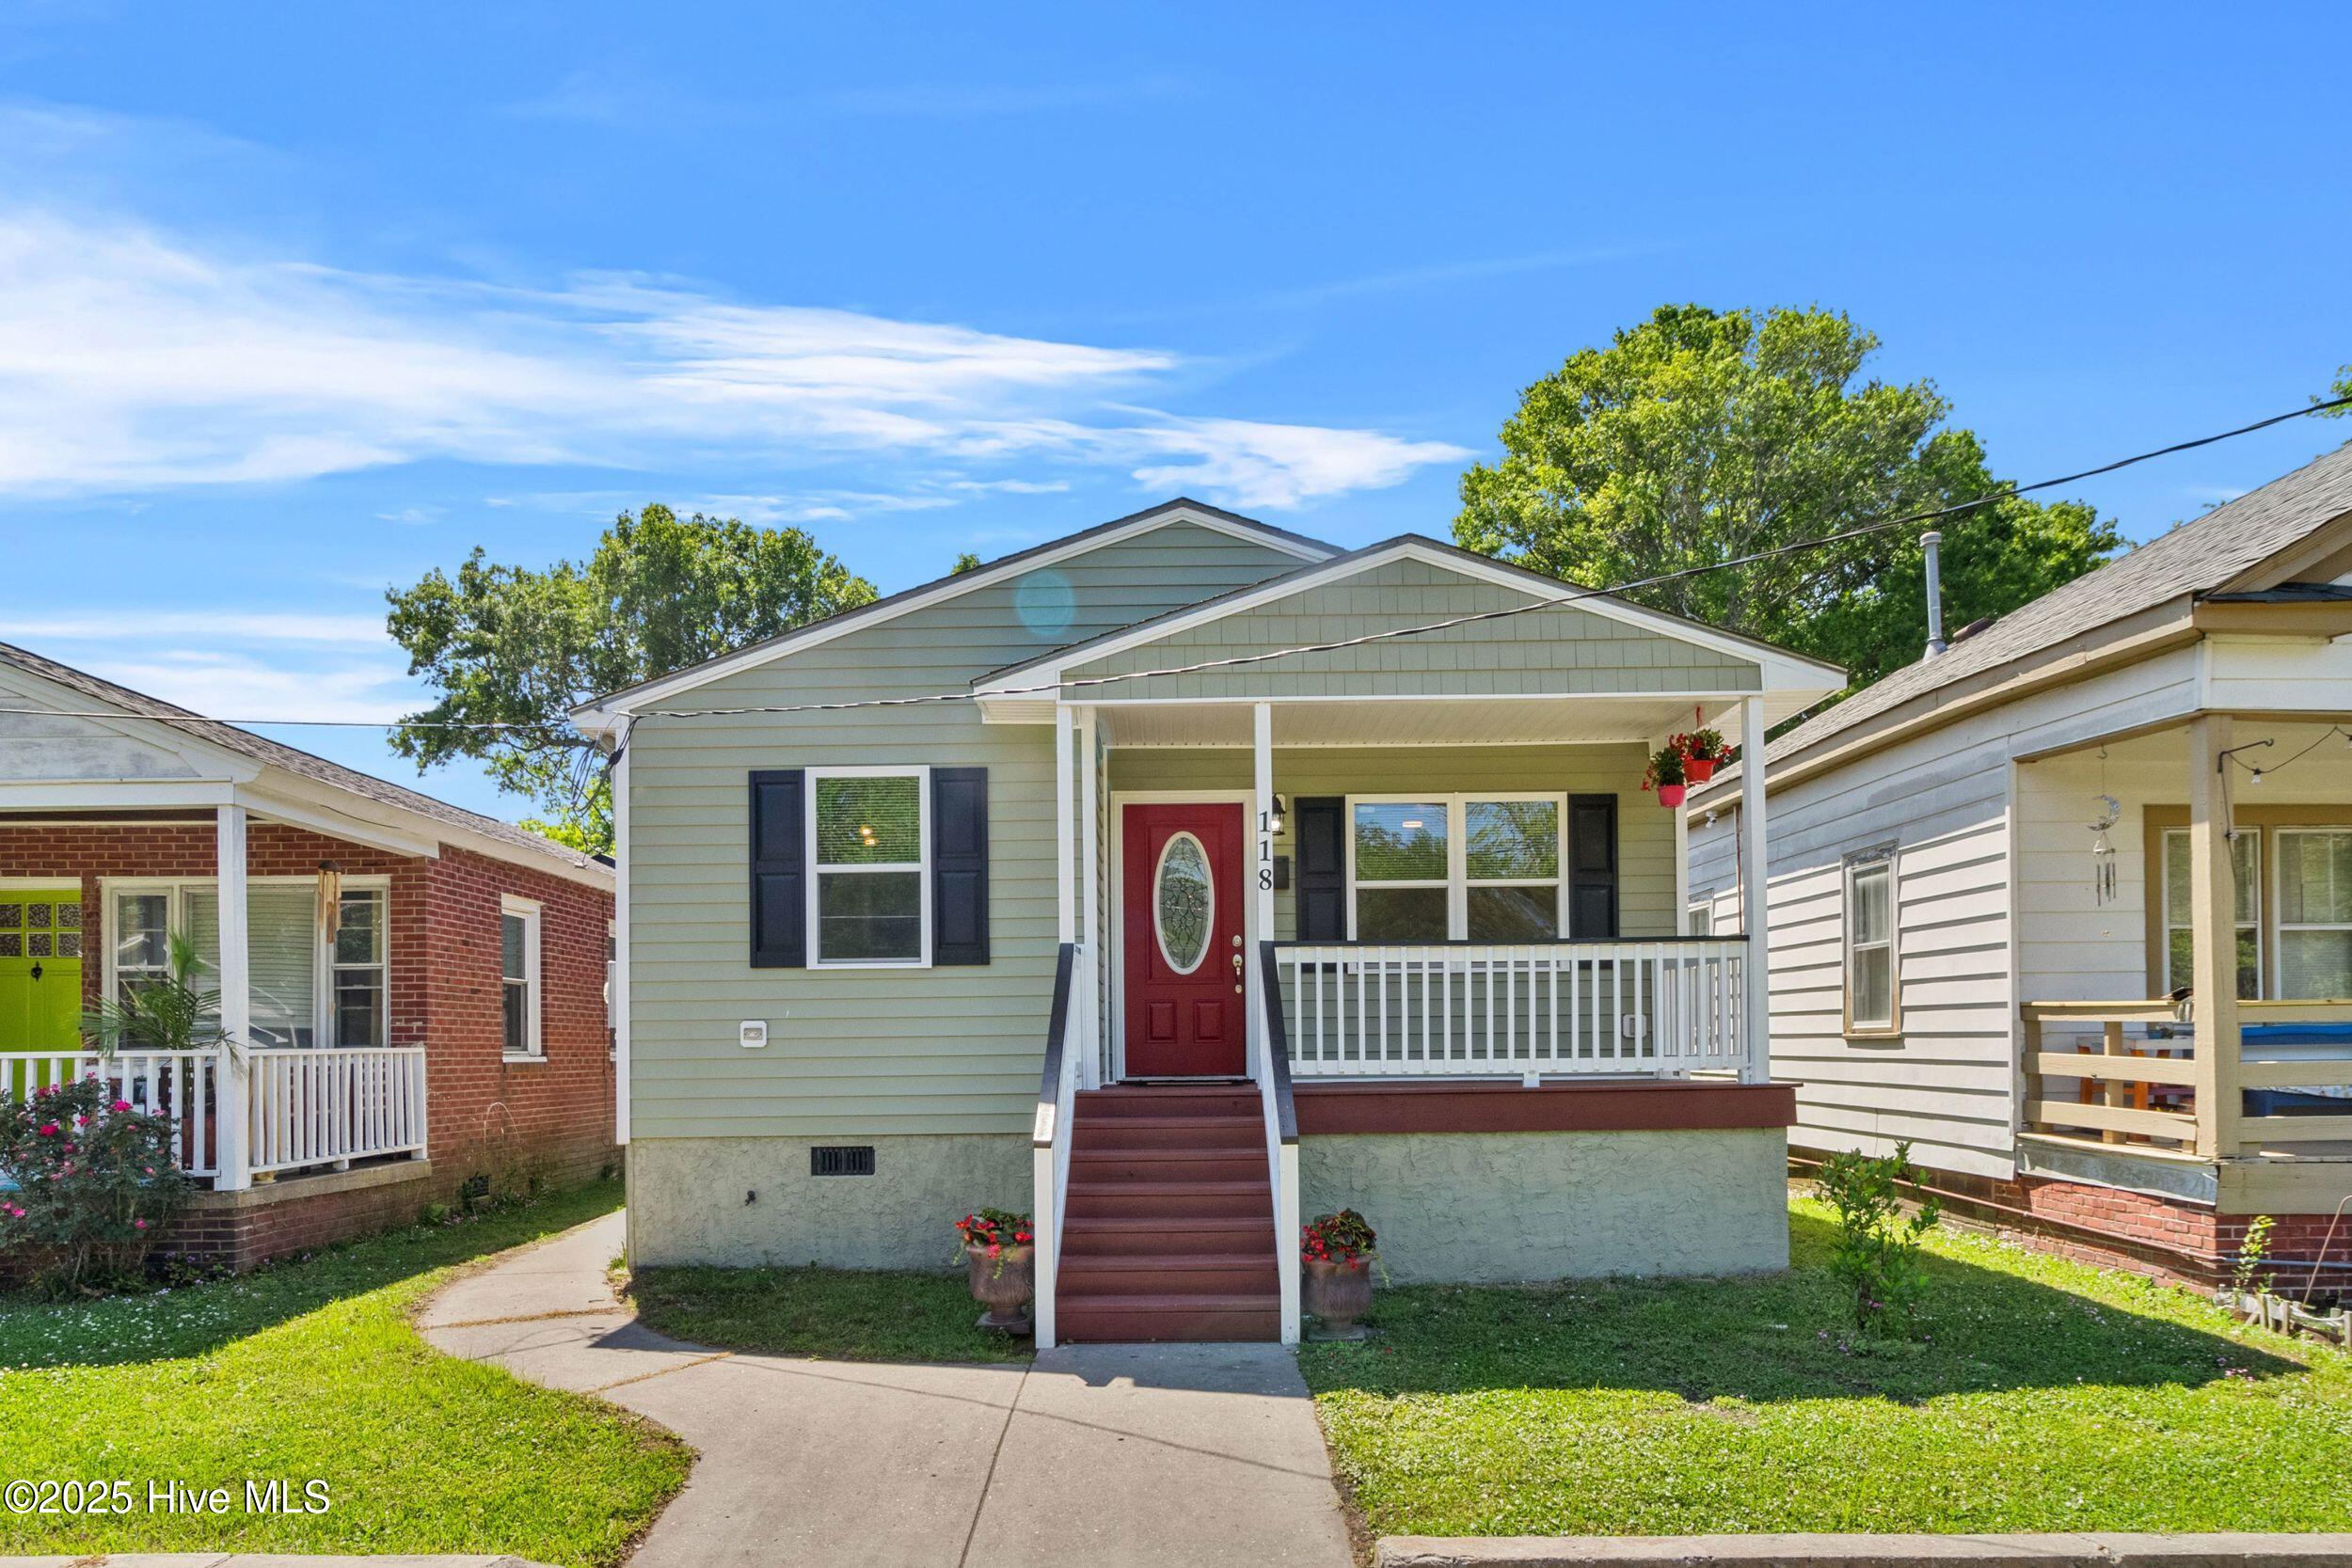
Active
$324,900
3
bds
|
2
ba
|
1,048
sqft
|
built
2000
118 S 13th St, Wilmington, NC 28401
$-597
Cash flow
-9.6%
Cash-on-Cash Return
4.1%
Cap rate
0.5%
Rent to Value Ratio
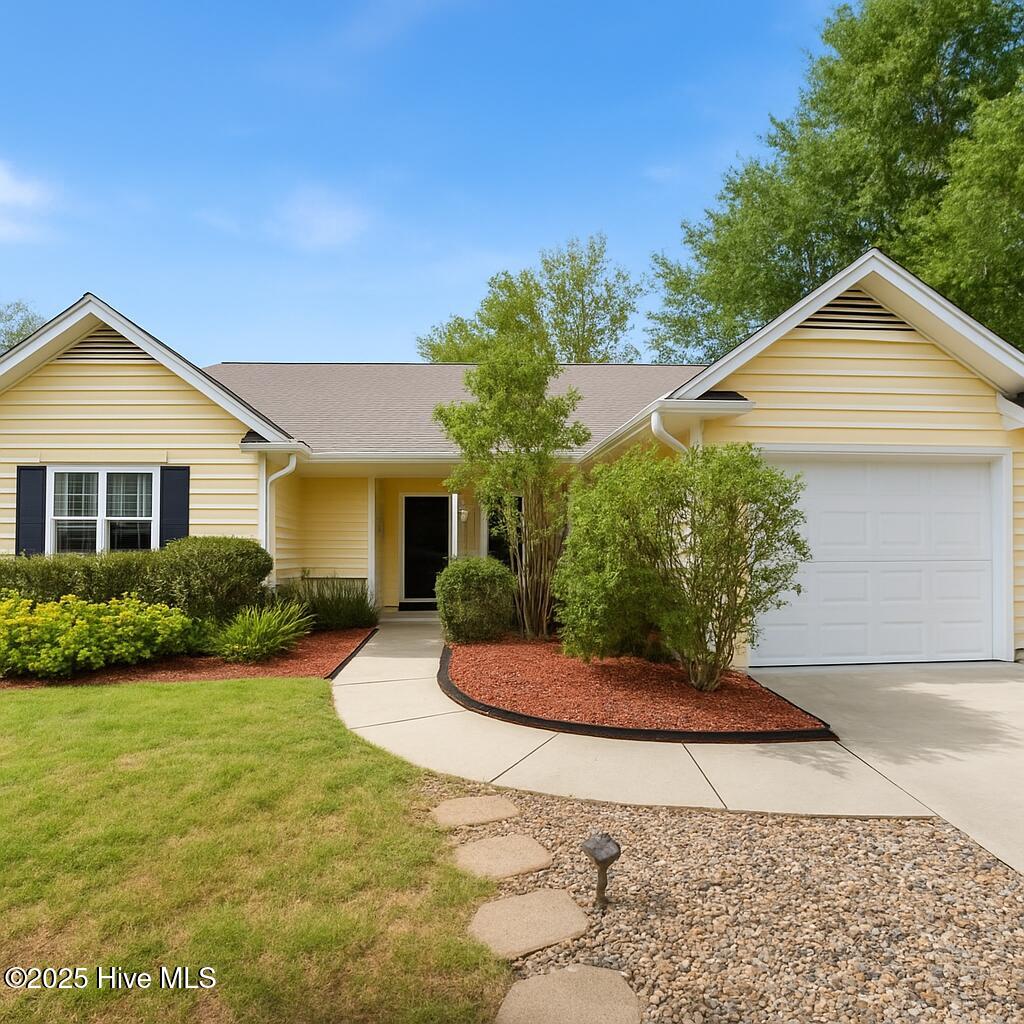
Active
$374,000
3
bds
|
2
ba
|
1,396
sqft
|
built
1997
808 Tanlaw Ct, Wilmington, NC 28412
$-695
Cash flow
-9.7%
Cash-on-Cash Return
4.1%
Cap rate
0.5%
Rent to Value Ratio

Active
$650,000
4
bds
|
3
ba
|
2,471
sqft
|
built
2013
6618 Motts Village Rd, Wilmington, NC 28412
$-1,897
Cash flow
-15.2%
Cash-on-Cash Return
2.8%
Cap rate
0.4%
Rent to Value Ratio

Active
$979,500
4
bds
|
4
ba
|
2,629
sqft
|
built
2016
5418 Saltwater Run, Wilmington, NC 28409
$-3,581
Cash flow
-19.1%
Cash-on-Cash Return
1.9%
Cap rate
0.3%
Rent to Value Ratio
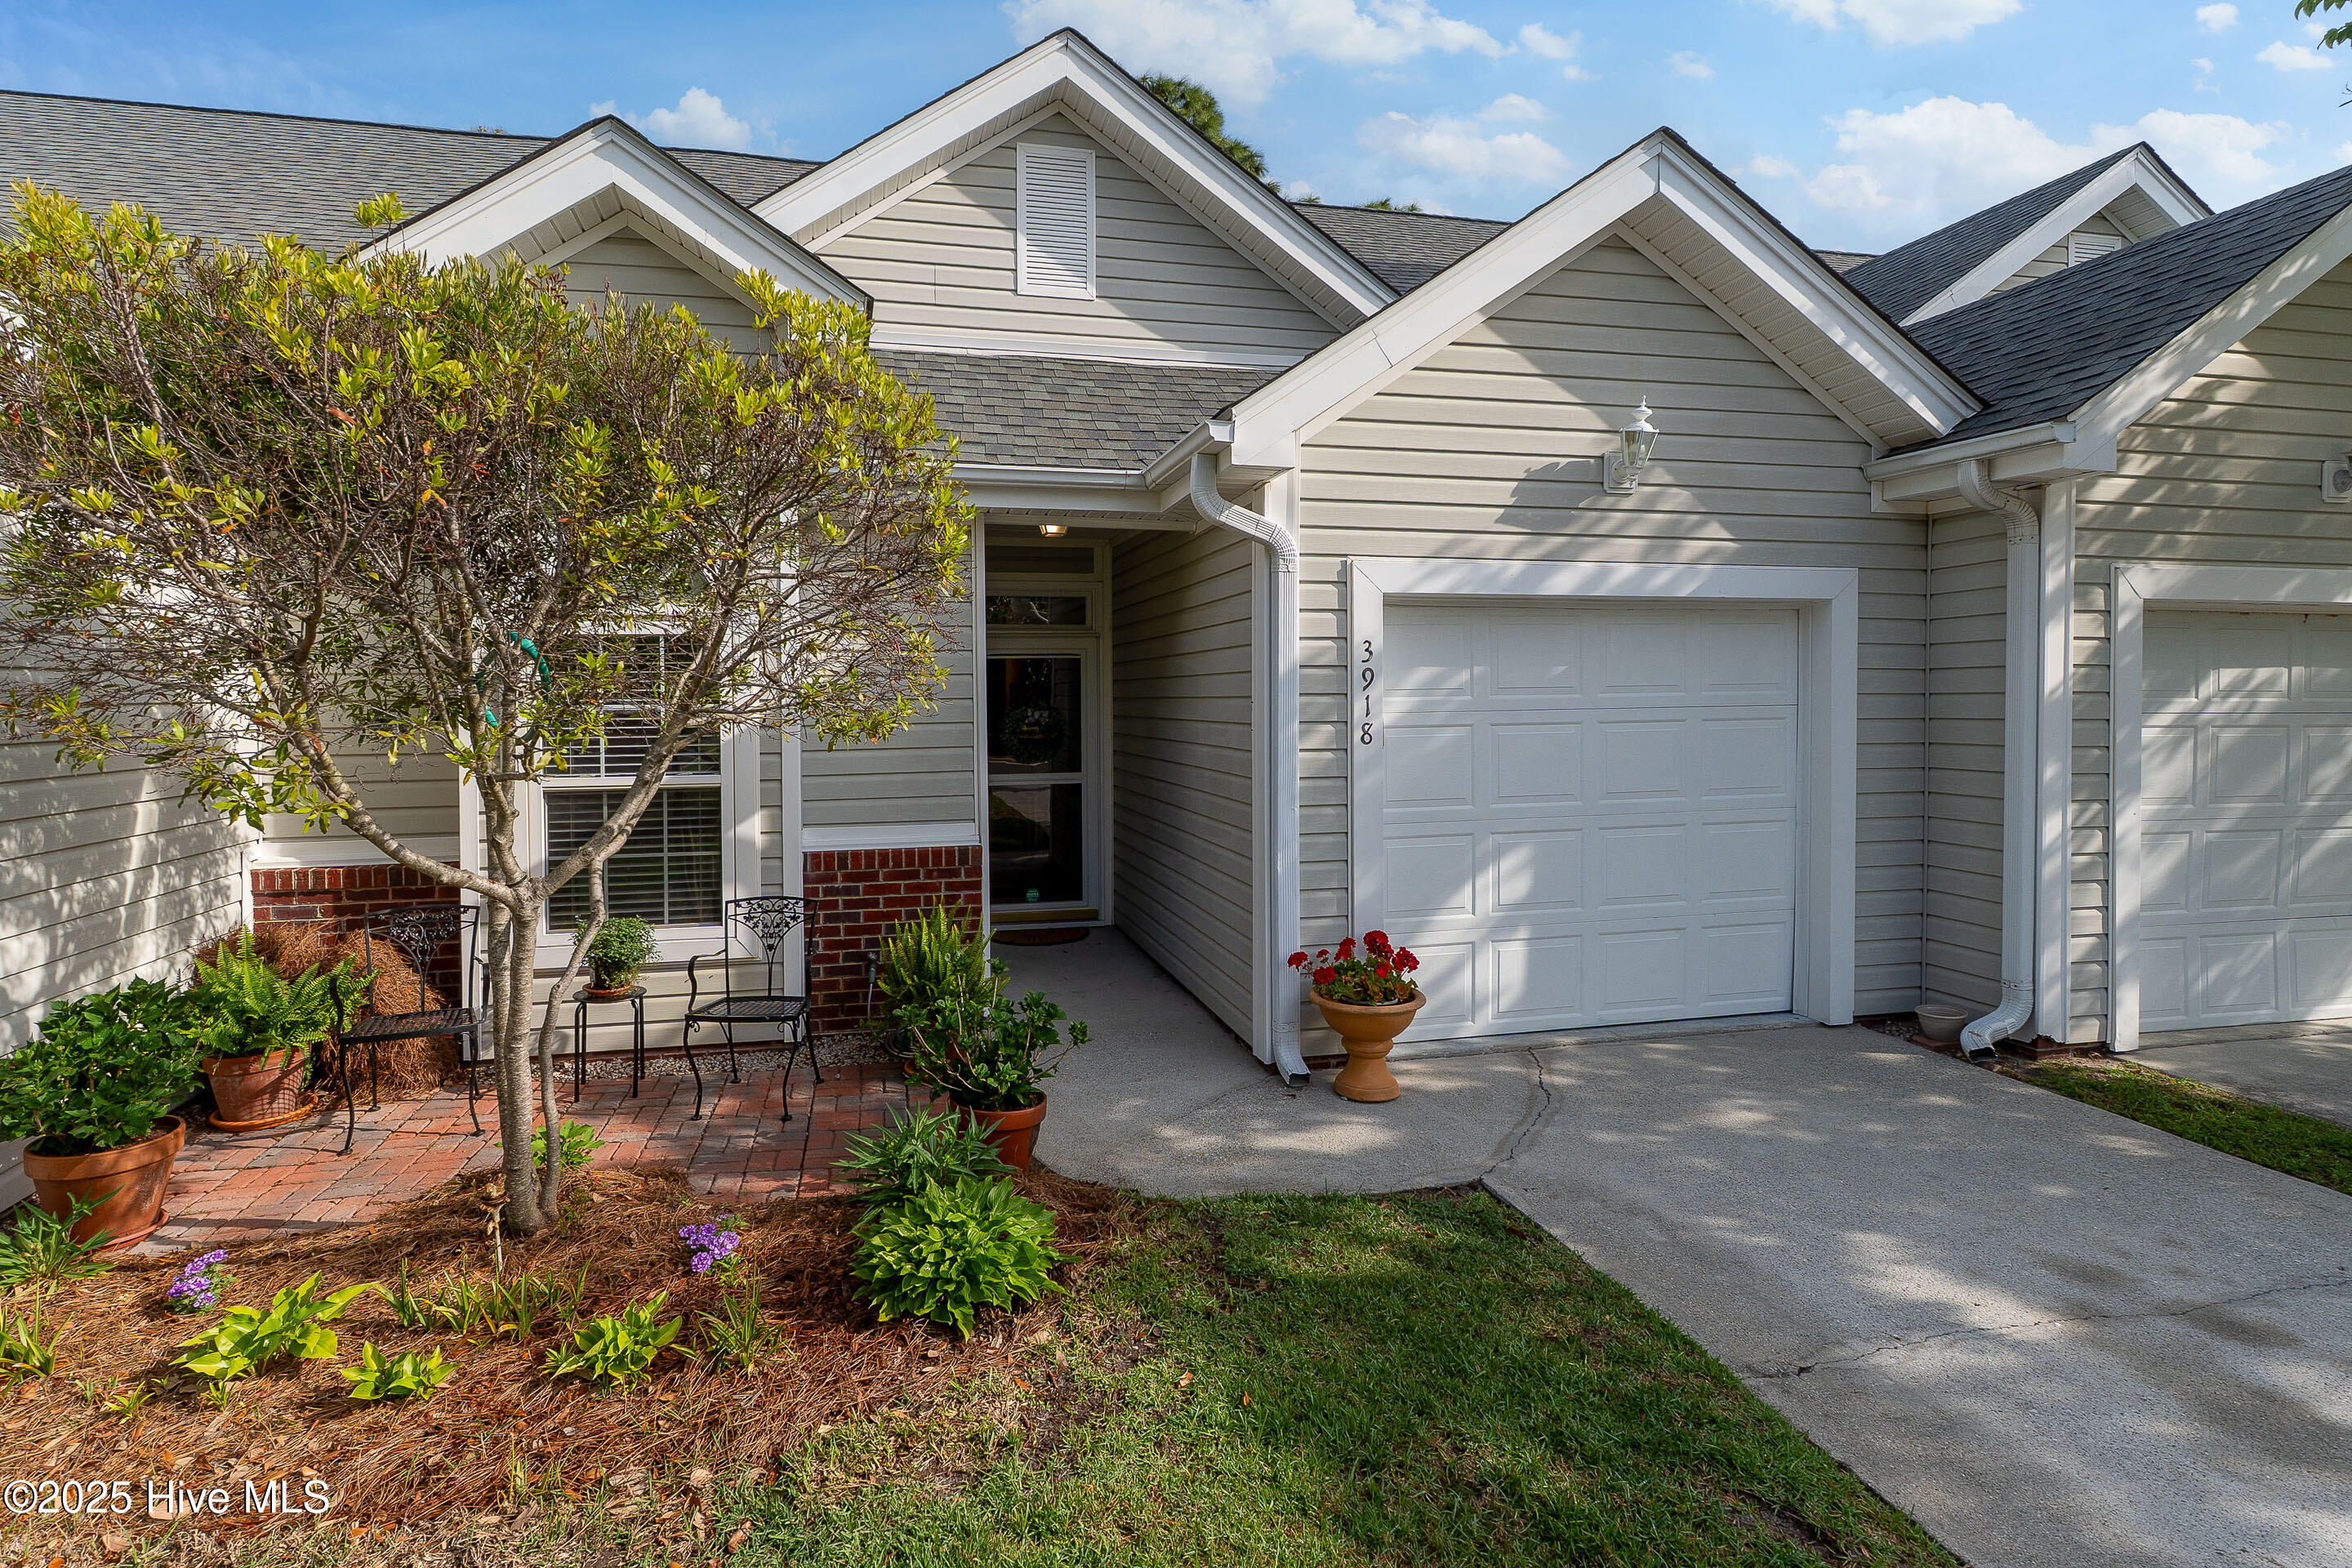
Active
$338,000
3
bds
|
2
ba
|
1,231
sqft
|
built
1996
3918 Mayfield Ct, Wilmington, NC 28412
$-780
Cash flow
-12.0%
Cash-on-Cash Return
3.5%
Cap rate
0.6%
Rent to Value Ratio
Pending
$634,000
5
bds
|
4
ba
|
2,814
sqft
|
built
1995
7300 Oyster Dr, Wilmington, NC 28411
$-1,281
Cash flow
-10.5%
Cash-on-Cash Return
3.9%
Cap rate
0.5%
Rent to Value Ratio
Active
$479,000
3
bds
|
2
ba
|
1,619
sqft
|
built
2005
4113 Rounding Bend Ln, Wilmington, NC 28412
$-883
Cash flow
-9.6%
Cash-on-Cash Return
4.1%
Cap rate
0.5%
Rent to Value Ratio
Active
$495,000
3
bds
|
4
ba
|
1,929
sqft
|
built
2018
4006 Tamarisk Ln, Wilmington, NC 28409
$-1,395
Cash flow
-14.7%
Cash-on-Cash Return
2.9%
Cap rate
0.5%
Rent to Value Ratio
Pending
$400,000
4
bds
|
3
ba
|
1,549
sqft
|
built
1971
1317 Avon Ct, Wilmington, NC 28405
$-853
Cash flow
-11.1%
Cash-on-Cash Return
3.7%
Cap rate
0.4%
Rent to Value Ratio
Active
$390,000
3
bds
|
3
ba
|
1,756
sqft
|
built
2023
517 N 11th St, Wilmington, NC 28401
$-425
Cash flow
-5.7%
Cash-on-Cash Return
5.0%
Cap rate
0.7%
Rent to Value Ratio
Active
$2,475,000
4
bds
|
5
ba
|
4,625
sqft
|
built
2004
2220 Bel Arbor Pl, Wilmington, NC 28403
$-11,080
Cash flow
-23.4%
Cash-on-Cash Return
0.9%
Cap rate
0.2%
Rent to Value Ratio
Active
$230,000
3
bds
|
2
ba
|
964
sqft
|
built
1999
1202 S 8th St, Wilmington, NC 28401
$-290
Cash flow
-6.6%
Cash-on-Cash Return
4.8%
Cap rate
0.7%
Rent to Value Ratio
Active
$949,900
4
bds
|
4
ba
|
3,857
sqft
|
built
2005
4204 Purviance Ct, Wilmington, NC 28409
$-2,590
Cash flow
-14.2%
Cash-on-Cash Return
3.0%
Cap rate
0.4%
Rent to Value Ratio

Active
$362,000
3
bds
|
2
ba
|
1,352
sqft
|
built
1995
606 Manassas Dr, Wilmington, NC 28409
$-603
Cash flow
-8.7%
Cash-on-Cash Return
4.3%
Cap rate
0.6%
Rent to Value Ratio
Active
$494,000
4
bds
|
3
ba
|
2,426
sqft
|
built
2016
7408 Darius Dr, Wilmington, NC 28411
$-688
Cash flow
-7.3%
Cash-on-Cash Return
4.6%
Cap rate
0.6%
Rent to Value Ratio
Active
$515,000
3
bds
|
4
ba
|
1,831
sqft
|
built
2018
4019 Tamarisk Ln, Wilmington, NC 28409
$-1,508
Cash flow
-15.3%
Cash-on-Cash Return
2.8%
Cap rate
0.5%
Rent to Value Ratio

Active
$295,000
3
bds
|
1
ba
|
1,299
sqft
|
built
1907
111 Meares St, Wilmington, NC 28401
$-552
Cash flow
-9.8%
Cash-on-Cash Return
4.0%
Cap rate
0.5%
Rent to Value Ratio

Active
$565,000
4
bds
|
3
ba
|
2,405
sqft
|
built
2002
600 Sea Castle Ct, Wilmington, NC 28412
$-1,060
Cash flow
-9.8%
Cash-on-Cash Return
4.0%
Cap rate
0.5%
Rent to Value Ratio

Active
$729,900
4
bds
|
3
ba
|
2,355
sqft
|
built
2023
419 Glenn Ellen Dr, Wilmington, NC 28412
$-2,097
Cash flow
-15.0%
Cash-on-Cash Return
2.8%
Cap rate
0.4%
Rent to Value Ratio
Active
$415,000
4
bds
|
2
ba
|
2,377
sqft
|
built
2007
7306 Charred Pine Dr, Wilmington, NC 28411
$-713
Cash flow
-9.0%
Cash-on-Cash Return
4.2%
Cap rate
0.6%
Rent to Value Ratio
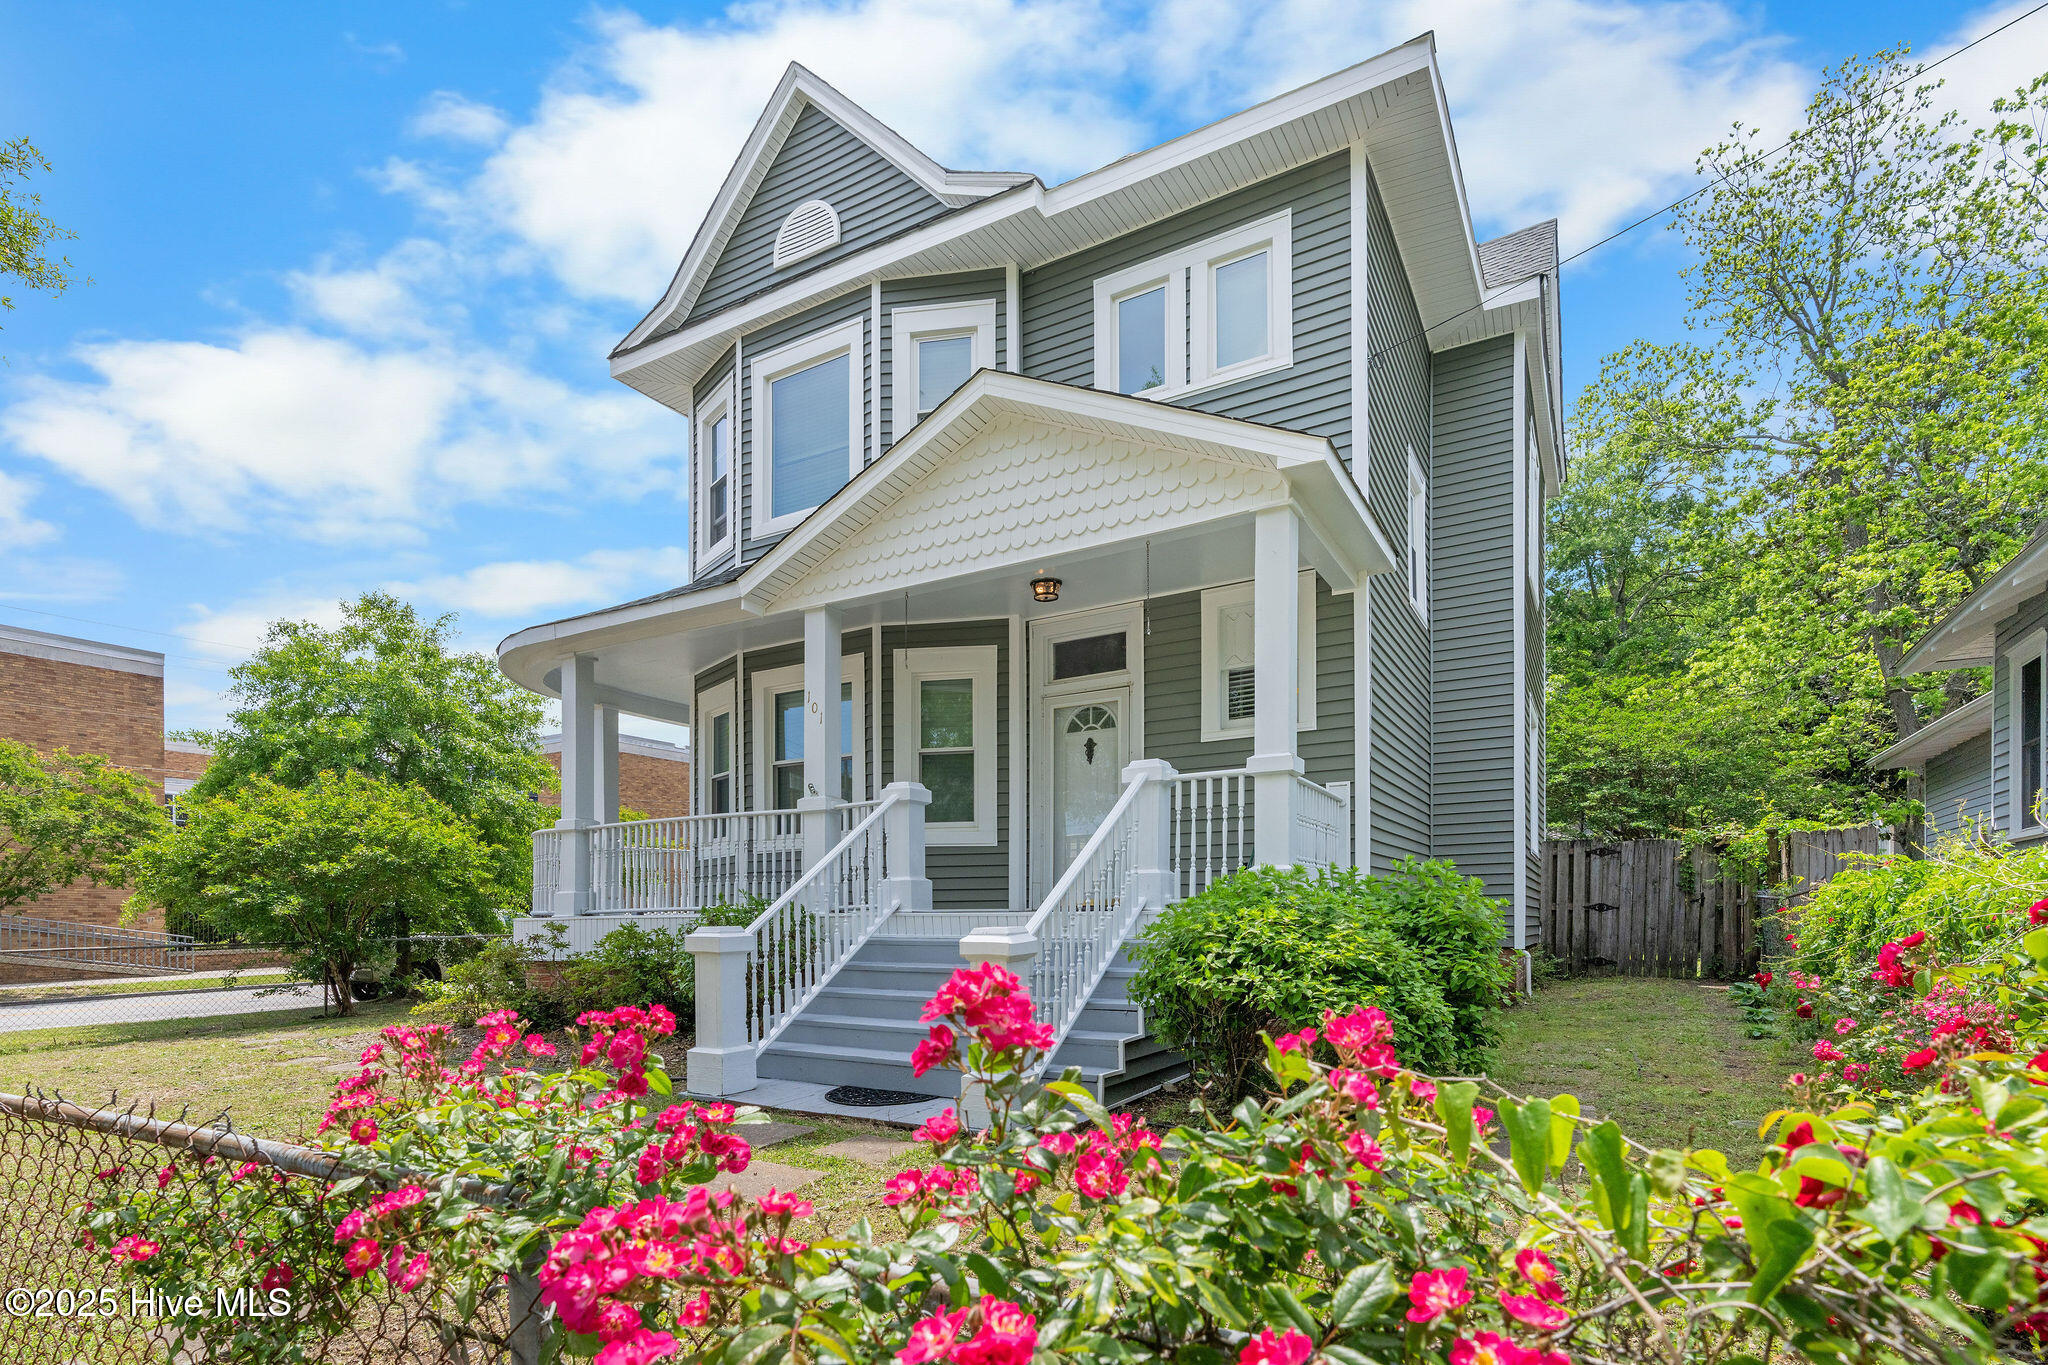
Active
$489,000
3
bds
|
2
ba
|
1,971
sqft
|
built
1910
101 N 13th St, Wilmington, NC 28401
$-1,189
Cash flow
-12.7%
Cash-on-Cash Return
3.4%
Cap rate
0.5%
Rent to Value Ratio

Active
$1,185,000
4
bds
|
4
ba
|
3,451
sqft
|
built
2023
7217 Winding Marsh Dr, Wilmington, NC 28411
$-2,784
Cash flow
-12.3%
Cash-on-Cash Return
3.5%
Cap rate
0.5%
Rent to Value Ratio
Active
$3,495,000
4
bds
|
5
ba
|
5,384
sqft
|
built
2003
5232 Masonboro Harbour Dr, Wilmington, NC 28409
$-14,525
Cash flow
-21.7%
Cash-on-Cash Return
1.3%
Cap rate
0.2%
Rent to Value Ratio
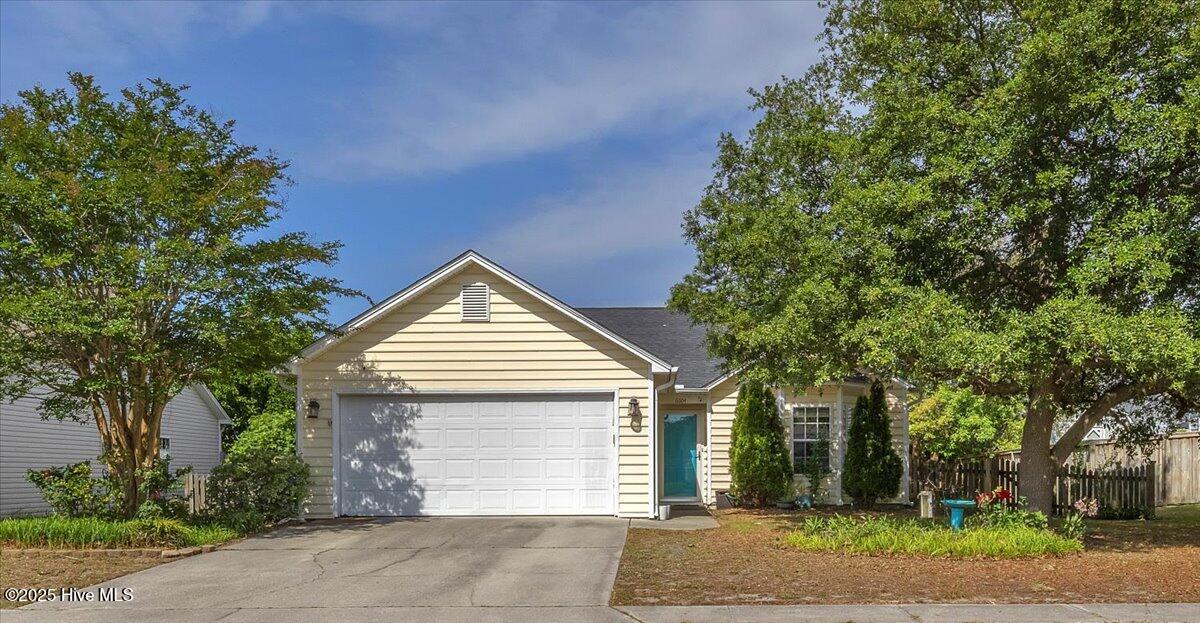
Active
$369,900
3
bds
|
2
ba
|
1,585
sqft
|
built
1999
6604 Stoddard Rd, Wilmington, NC 28412
$-470
Cash flow
-6.6%
Cash-on-Cash Return
4.8%
Cap rate
0.6%
Rent to Value Ratio
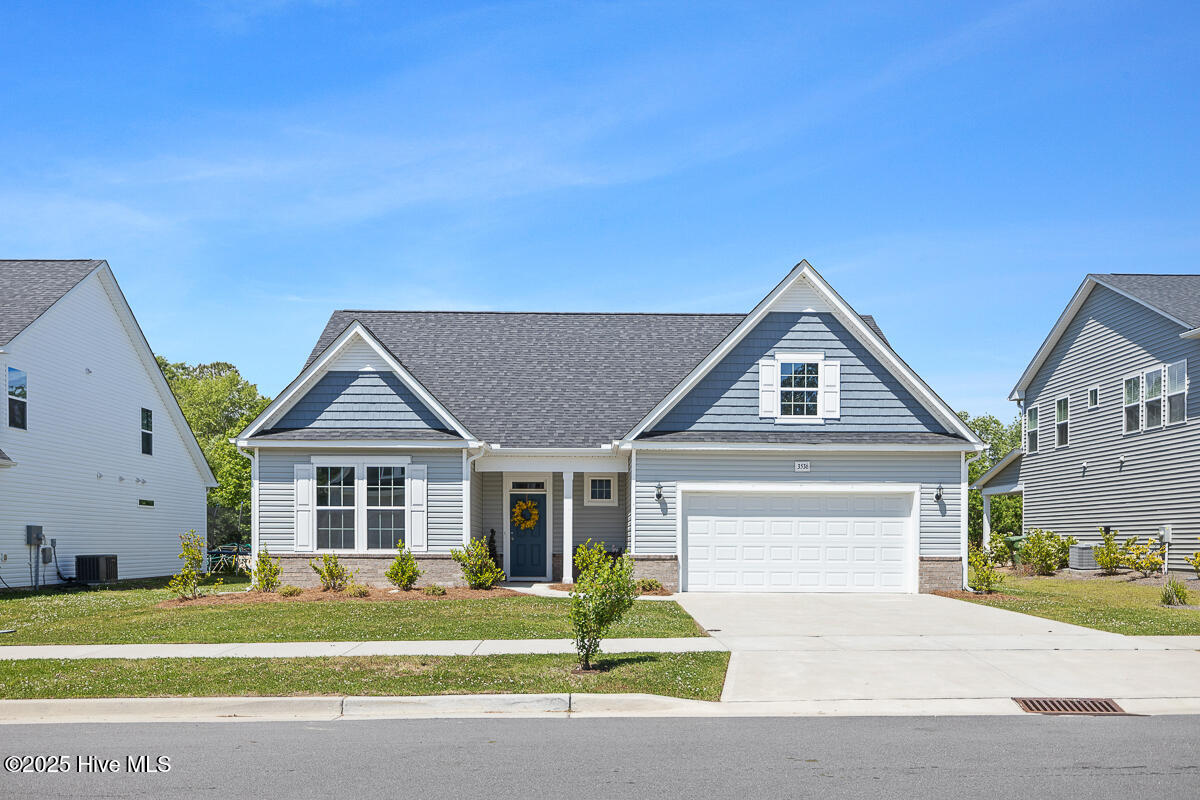
Active
$557,900
4
bds
|
3
ba
|
2,723
sqft
|
built
2022
3536 Daufuskie Dr, Wilmington, NC 28412
$-1,075
Cash flow
-10.1%
Cash-on-Cash Return
4.0%
Cap rate
0.6%
Rent to Value Ratio

Active
$299,500
2
bds
|
2
ba
|
1,056
sqft
|
built
1997
801 Plainfield Ct, Wilmington, NC 28411
$-427
Cash flow
-7.4%
Cash-on-Cash Return
4.6%
Cap rate
0.6%
Rent to Value Ratio
Active
$5,295,000
3
bds
|
3
ba
|
2,756
sqft
|
built
1976
10 Sandy Pt, Wilmington, NC 28411
$-24,937
Cash flow
-24.6%
Cash-on-Cash Return
0.6%
Cap rate
0.1%
Rent to Value Ratio
Active
$340,000
3
bds
|
3
ba
|
1,543
sqft
|
built
2017
506 Orbison Dr, Wilmington, NC 28411
$-622
Cash flow
-9.5%
Cash-on-Cash Return
4.1%
Cap rate
0.6%
Rent to Value Ratio
Active
$519,000
3
bds
|
4
ba
|
2,962
sqft
|
built
2015
4408 Terrington Dr, Wilmington, NC 28412
$-1,224
Cash flow
-12.3%
Cash-on-Cash Return
3.5%
Cap rate
0.6%
Rent to Value Ratio
Active
$559,000
4
bds
|
3
ba
|
3,187
sqft
|
built
2015
3250 Kellerton Pl, Wilmington, NC 28409
$-1,102
Cash flow
-10.3%
Cash-on-Cash Return
3.9%
Cap rate
0.6%
Rent to Value Ratio
Active
$1,400,000
4
bds
|
5
ba
|
3,524
sqft
|
built
1994
2212 Fox Hunt Ln, Wilmington, NC 28405
$-4,372
Cash flow
-16.3%
Cash-on-Cash Return
2.5%
Cap rate
0.4%
Rent to Value Ratio
Active
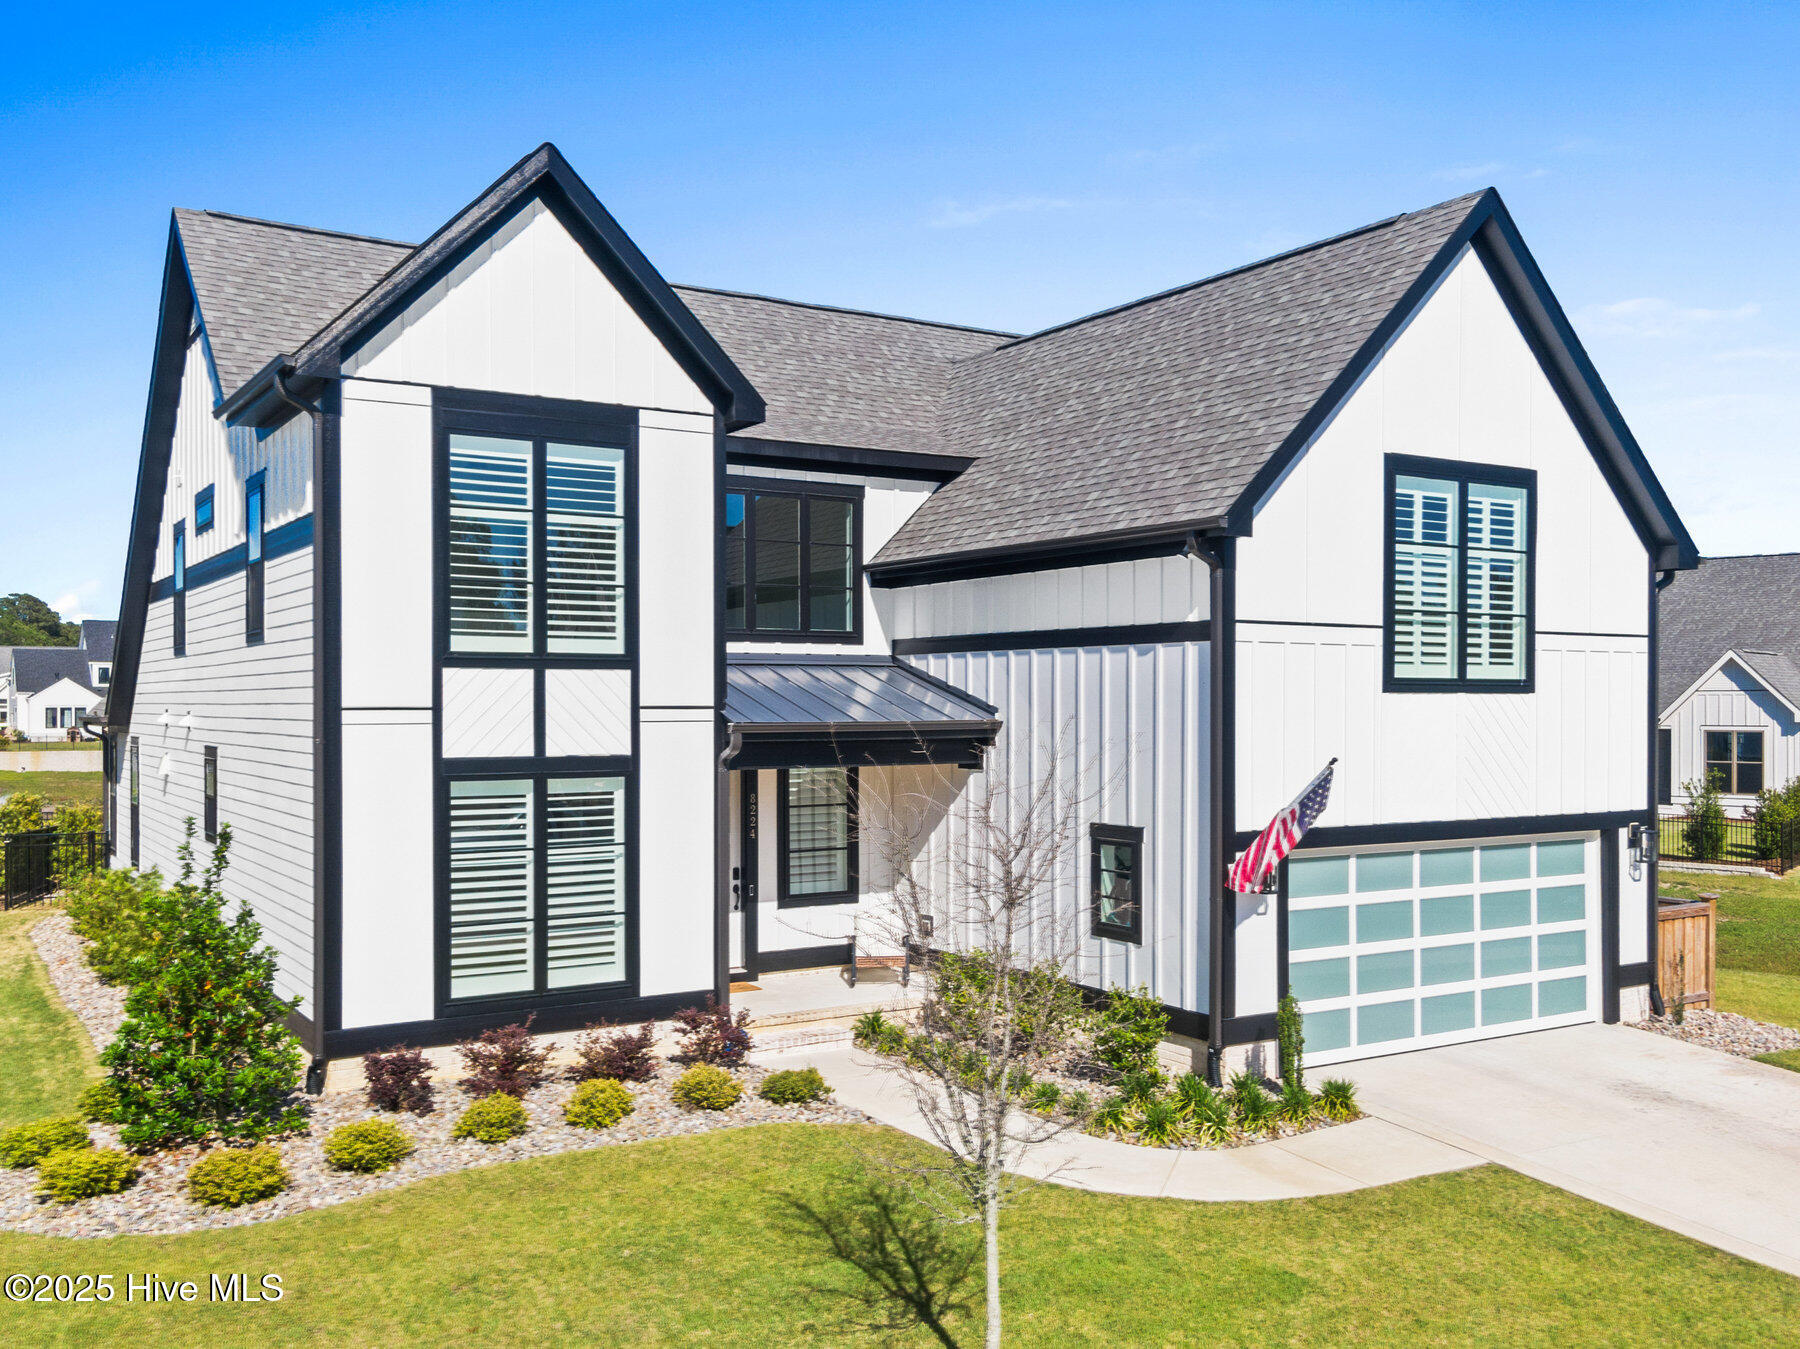
$1,098,900
5
bds
|
4
ba
|
3,410
sqft
|
built
2023
8224 Winding Creek Cir, Wilmington, NC 28411
$-2,327
Cash flow
-11.0%
Cash-on-Cash Return
3.7%
Cap rate
0.5%
Rent to Value Ratio
Active
$1,125,000
4
bds
|
4
ba
|
4,032
sqft
|
built
2006
104 River Ct, Wilmington, NC 28412
$-3,169
Cash flow
-14.7%
Cash-on-Cash Return
2.9%
Cap rate
0.4%
Rent to Value Ratio
Active
$7,200,000
4
bds
|
7
ba
|
7,116
sqft
|
built
2009
109 Live Oak Ln, Wilmington, NC 28411
$-36,202
Cash flow
-26.2%
Cash-on-Cash Return
0.3%
Cap rate
0.1%
Rent to Value Ratio

Active
$770,000
3
bds
|
2
ba
|
1,941
sqft
|
built
1987
1957 Prestwick Ln, Wilmington, NC 28405
$-2,337
Cash flow
-15.8%
Cash-on-Cash Return
2.6%
Cap rate
0.4%
Rent to Value Ratio
Active
$460,000
3
bds
|
3
ba
|
1,779
sqft
|
built
2000
108 Turtle Cay, Wilmington, NC 28412
$-1,459
Cash flow
-16.5%
Cash-on-Cash Return
2.5%
Cap rate
0.5%
Rent to Value Ratio
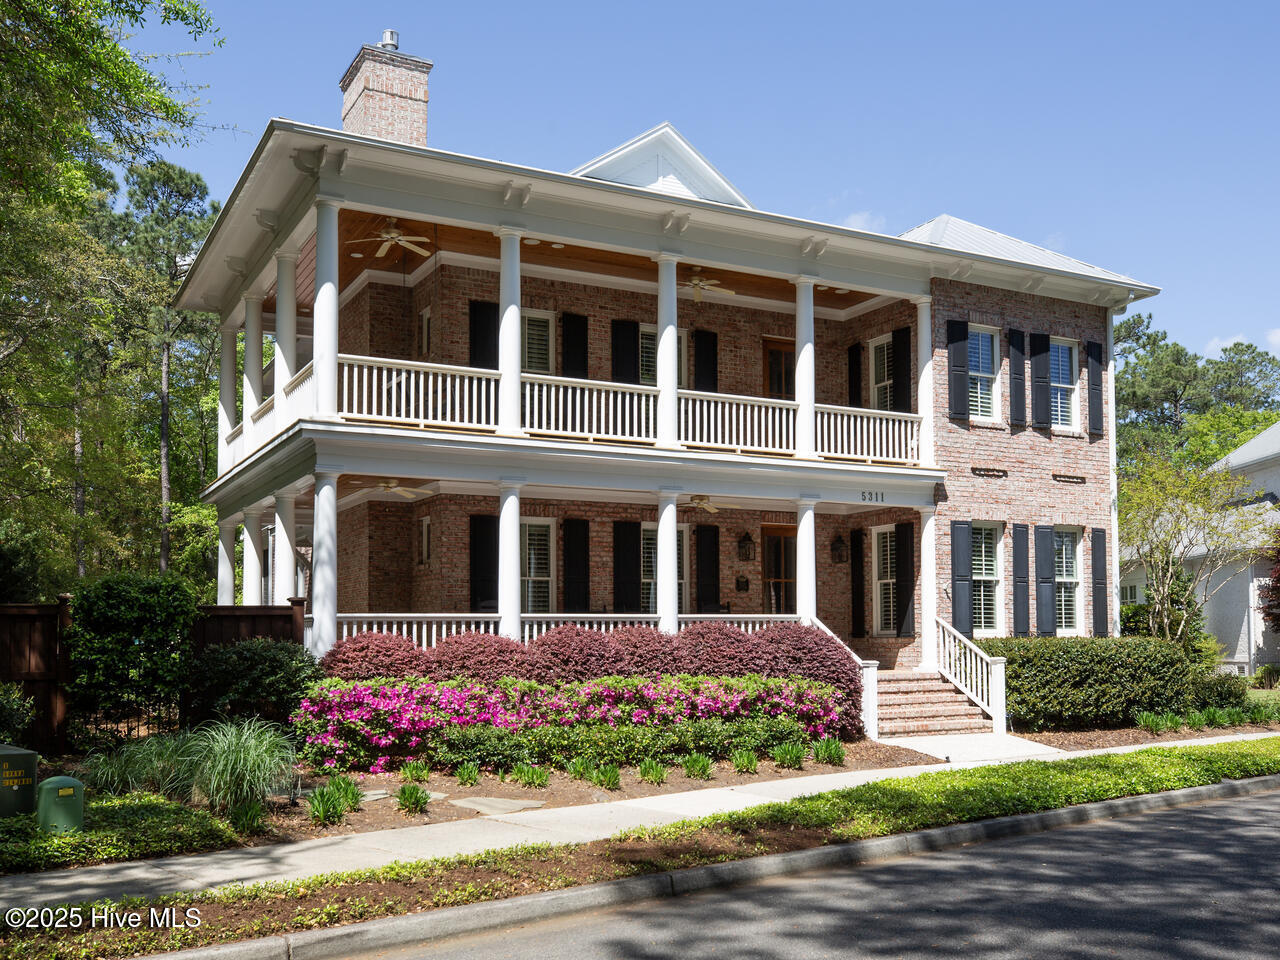
Active
$1,525,000
4
bds
|
4
ba
|
3,672
sqft
|
built
2011
5311 Old Garden Rd, Wilmington, NC 28403
$-5,866
Cash flow
-20.1%
Cash-on-Cash Return
1.7%
Cap rate
0.3%
Rent to Value Ratio
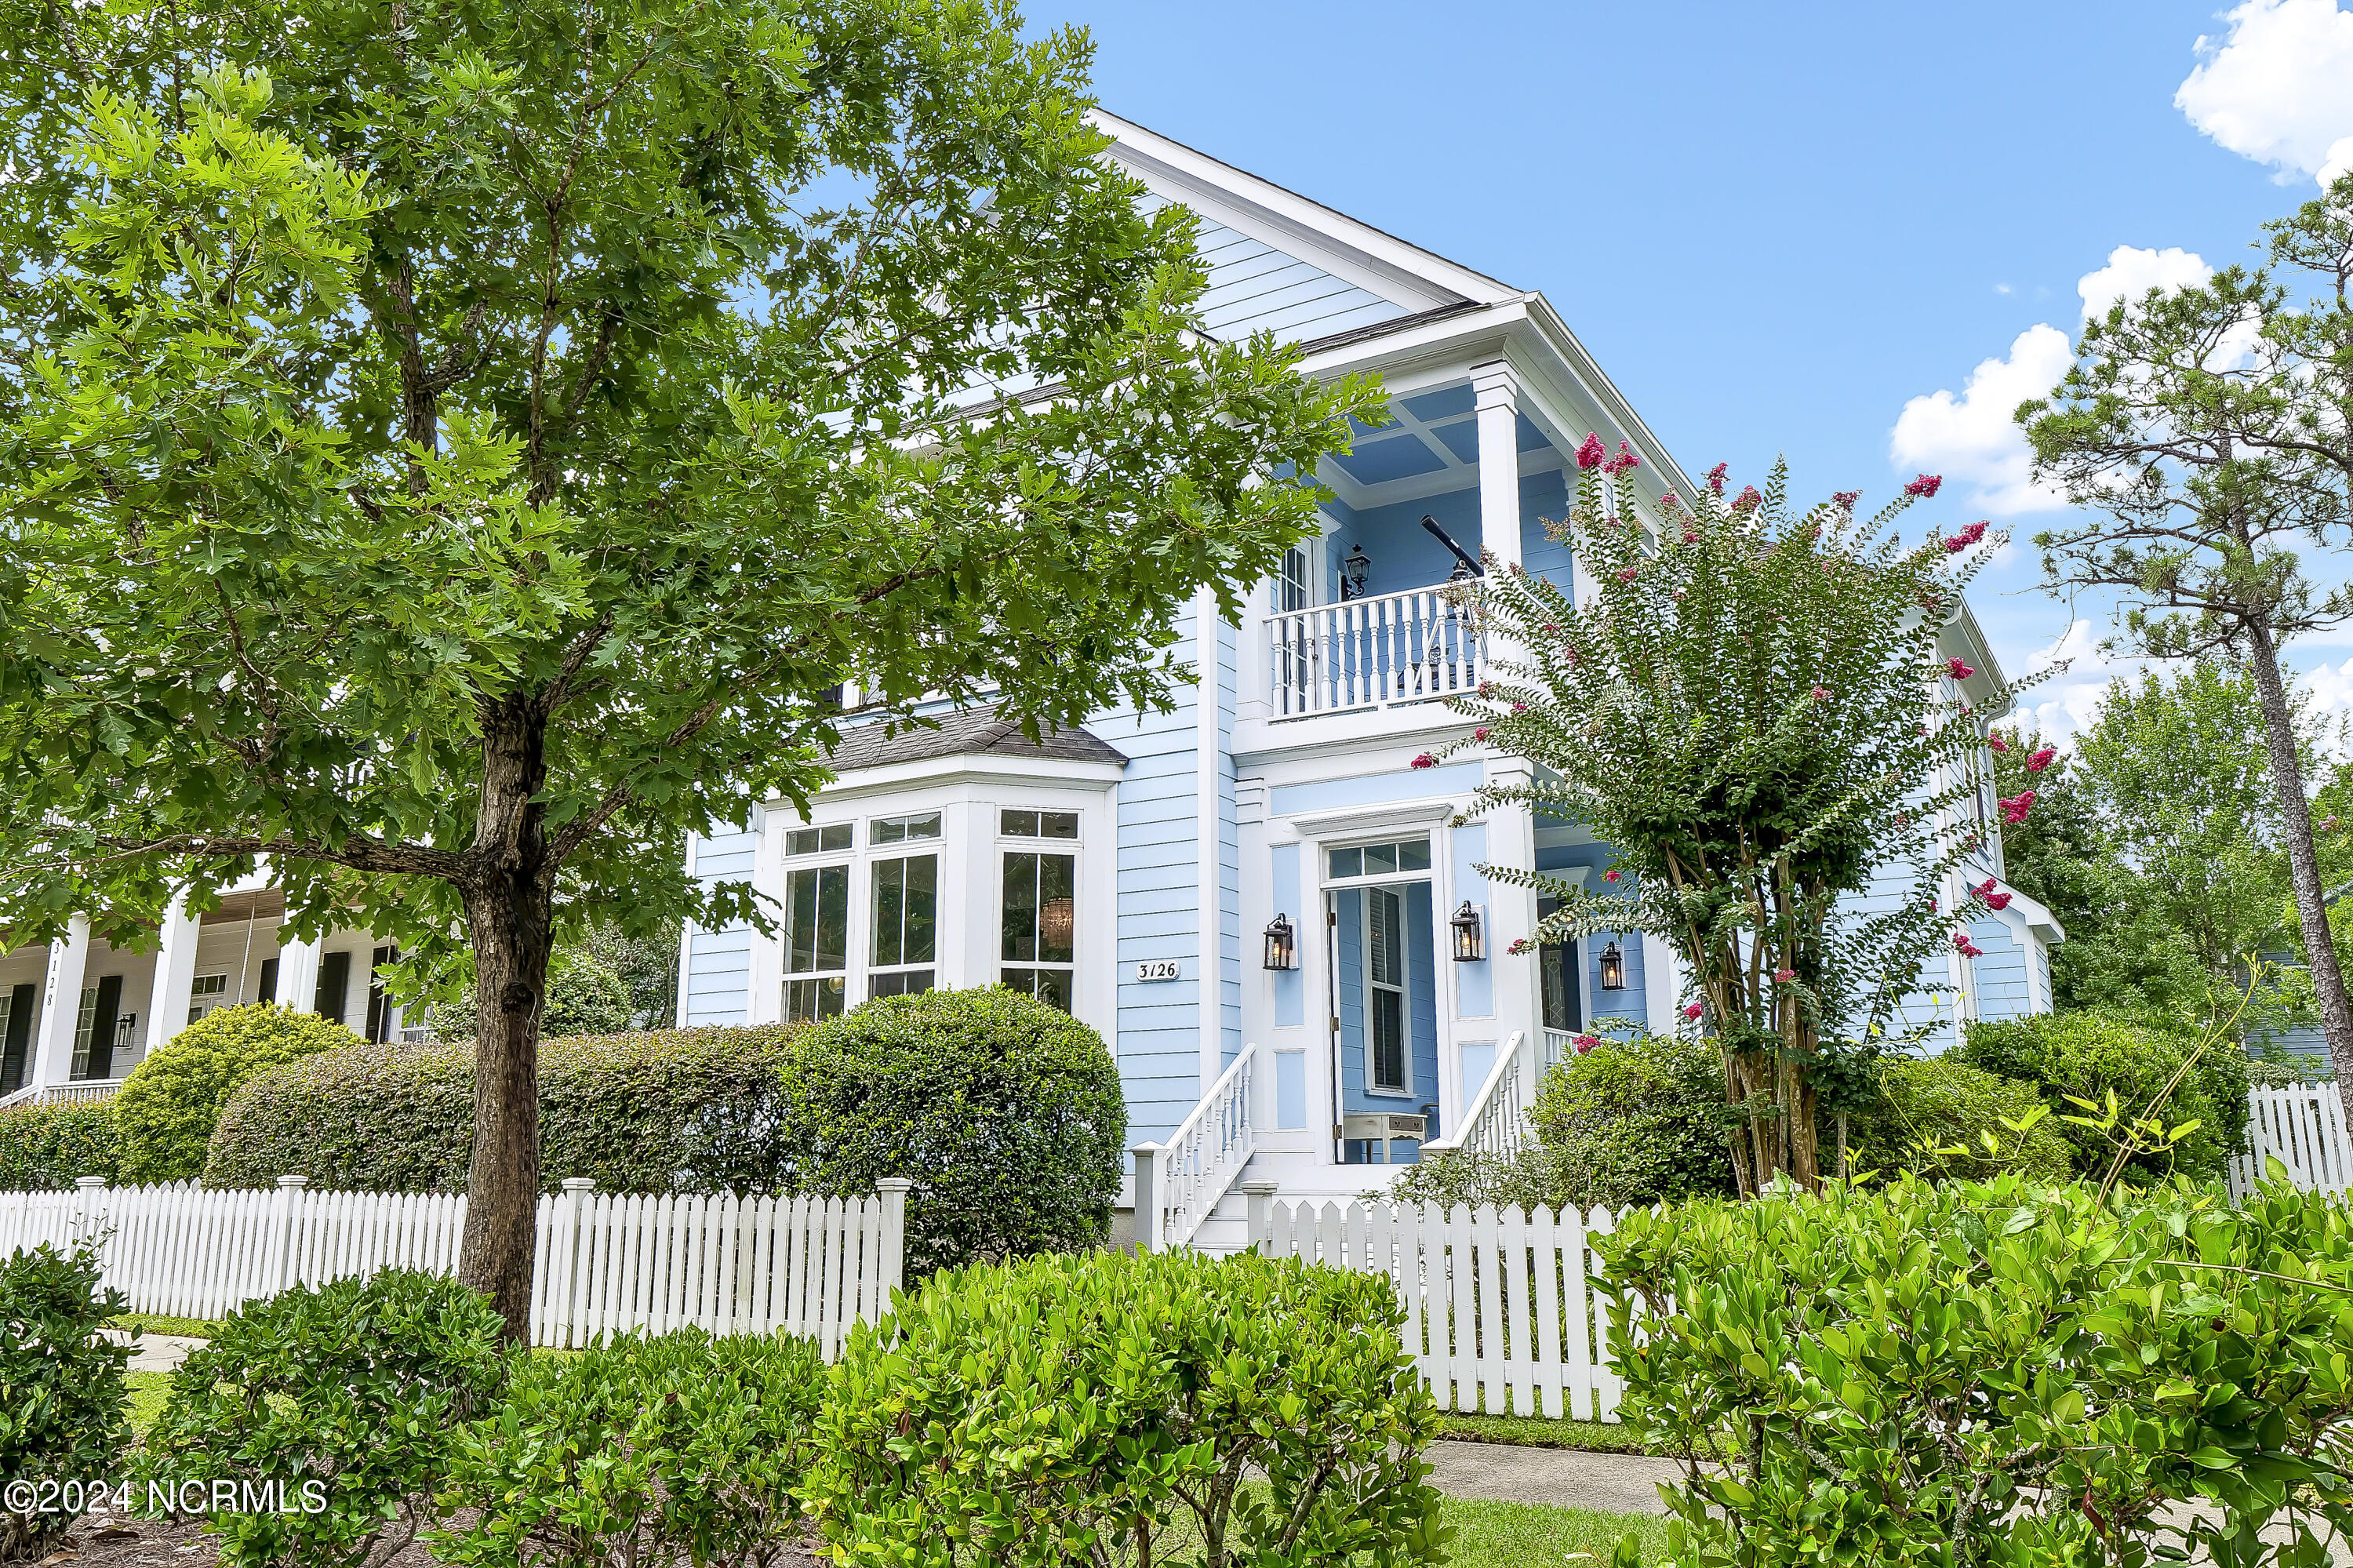
Active
$749,000
3
bds
|
3
ba
|
2,583
sqft
|
built
2001
3126 Dever Ct, Wilmington, NC 28411
$-1,862
Cash flow
-13.0%
Cash-on-Cash Return
3.3%
Cap rate
0.5%
Rent to Value Ratio
Active
$2,975,000
5
bds
|
6
ba
|
3,859
sqft
|
built
1988
6412 Westport Dr, Wilmington, NC 28409
$-12,928
Cash flow
-22.7%
Cash-on-Cash Return
1.1%
Cap rate
0.2%
Rent to Value Ratio
Active
$575,000
5
bds
|
4
ba
|
3,052
sqft
|
built
1993
1304 Williamsburg Ct, Wilmington, NC 28411
$-1,217
Cash flow
-11.0%
Cash-on-Cash Return
3.7%
Cap rate
0.5%
Rent to Value Ratio