Wilmington, NC Investment Properties for Sale
Browse homes for sale and investment properties in Wilmington, NC. Refine your search by price, property type, or more.
Best cash flowing properties in Wilmington, NC
Active
$325,000
3
bds
|
2
ba
|
1,152
sqft
|
built
1941
3262 Camden Cir, Wilmington, NC 28403
$-14
Cash flow
-0.2%
Cash-on-Cash Return
5.6%
Cap rate
0.7%
Rent to Value Ratio
Active
$207,500
2
bds
|
2
ba
|
803
sqft
|
built
1984
4575 Holly Tree Rd, Wilmington, NC 28412
$-99
Cash flow
-2.5%
Cash-on-Cash Return
5.1%
Cap rate
0.7%
Rent to Value Ratio
326 out of 705 properties for sale in Wilmington, NC
Limited Results Shown
Create a free account, or log in to reveal all property listings and enjoy the complete experience.
Active
$1,595,000
4
bds
|
4
ba
|
3,548
sqft
|
built
1997
1105 Arboretum Dr, Wilmington, NC 28405
$-3,540
Cash flow
-11.6%
Cash-on-Cash Return
3.0%
Cap rate
0.4%
Rent to Value Ratio
Active
$499,000
4
bds
|
3
ba
|
2,324
sqft
|
built
1966
201 Monterey Dr, Wilmington, NC 28409
$-241
Cash flow
-2.5%
Cash-on-Cash Return
5.1%
Cap rate
0.6%
Rent to Value Ratio
Active
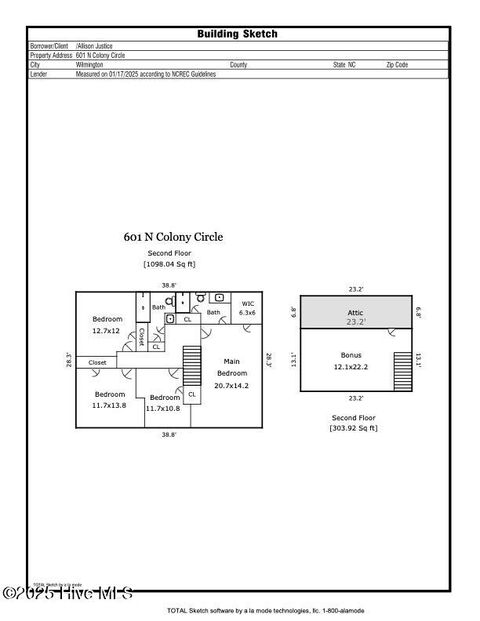
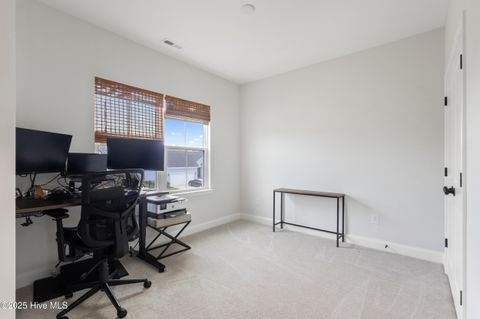
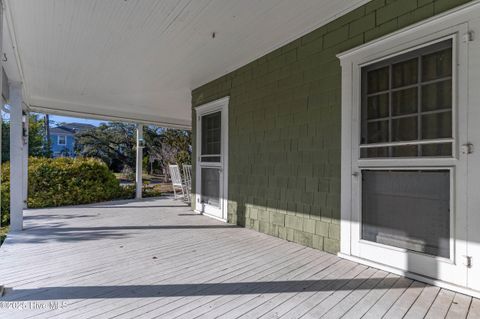
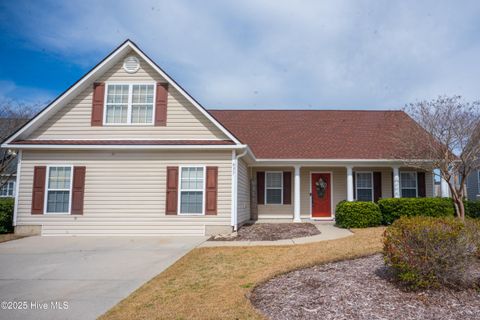
$570,000
4
bds
|
3
ba
|
2,919
sqft
|
built
1987
601 Colony Cir N, Wilmington, NC 28409
$-772
Cash flow
-7.1%
Cash-on-Cash Return
4.1%
Cap rate
0.5%
Rent to Value Ratio
Active
$519,000
3
bds
|
3
ba
|
1,971
sqft
|
built
2023
826 Trisail Ter, Wilmington, NC 28412
$-615
Cash flow
-6.2%
Cash-on-Cash Return
4.3%
Cap rate
0.6%
Rent to Value Ratio
Active
$629,000
3
bds
|
2
ba
|
2,333
sqft
|
built
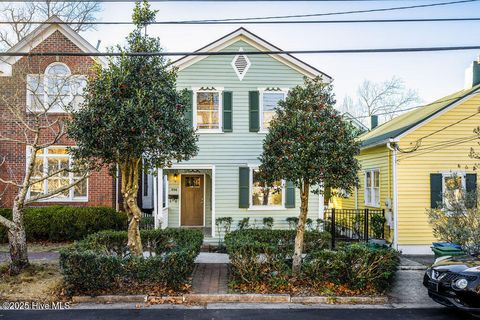
1921
212 N 16th St, Wilmington, NC 28401
$-1,034
Cash flow
-8.6%
Cash-on-Cash Return
3.7%
Cap rate
0.5%
Rent to Value Ratio
Active
$325,000
3
bds
|
2
ba
|
1,152
sqft
|
built
1941
3262 Camden Cir, Wilmington, NC 28403
$-14
Cash flow
-0.2%
Cash-on-Cash Return
5.6%
Cap rate
0.7%
Rent to Value Ratio

Active
$549,000
6
bds
|
4
ba
|
0
sqft
|
built
2001
210 S 9th St, Wilmington, NC 28401
$-1,483
Cash flow
-14.1%
Cash-on-Cash Return
2.4%
Cap rate
0.4%
Rent to Value Ratio
Active
$395,000
4
bds
|
2
ba
|
2,422
sqft
|
built
2004
637 Hillside Dr, Wilmington, NC 28412
$-317
Cash flow
-4.2%
Cash-on-Cash Return
4.7%
Cap rate
0.6%
Rent to Value Ratio
Active
$574,900
3
bds
|
3
ba
|
2,694
sqft
|
built
2020
1512 Grove Ln, Wilmington, NC 28409
$-666
Cash flow
-6.0%
Cash-on-Cash Return
4.3%
Cap rate
0.6%
Rent to Value Ratio

Active
$523,000
3
bds
|
3
ba
|
2,533
sqft
|
built
2014
333 Motts Forest Rd, Wilmington, NC 28412
$-1,260
Cash flow
-12.6%
Cash-on-Cash Return
2.8%
Cap rate
0.6%
Rent to Value Ratio
Active
$535,000
3
bds
|
2
ba
|
2,074
sqft
|
built
2013
315 Motts Forest Rd, Wilmington, NC 28412
$-1,165
Cash flow
-11.4%
Cash-on-Cash Return
3.1%
Cap rate
0.6%
Rent to Value Ratio
Active
$379,000
2
bds
|
3
ba
|
1,059
sqft
|
built
2019
1373 S 3rd St, Wilmington, NC 28401
$-866
Cash flow
-11.9%
Cash-on-Cash Return
2.9%
Cap rate
0.6%
Rent to Value Ratio
Active
$462,900
3
bds
|
3
ba
|
2,100
sqft
|
built
2004
7773 Cypress Island Dr, Wilmington, NC 28412
$-586
Cash flow
-6.6%
Cash-on-Cash Return
4.2%
Cap rate
0.6%
Rent to Value Ratio
Active
$253,900
2
bds
|
2
ba
|
1,483
sqft
|
built
2000
4140 Breezewood Dr, Wilmington, NC 28412
$-290
Cash flow
-6.0%
Cash-on-Cash Return
4.3%
Cap rate
0.7%
Rent to Value Ratio
Active
$450,000
3
bds
|
2
ba
|
1,200
sqft
|
built
1947
504 S 2nd St, Wilmington, NC 28401
$-301
Cash flow
-3.5%
Cash-on-Cash Return
4.9%
Cap rate
0.6%
Rent to Value Ratio
Active
$430,000
3
bds
|
3
ba
|
1,592
sqft
|
built
2017
208 Marstellar St, Wilmington, NC 28401
$-615
Cash flow
-7.5%
Cash-on-Cash Return
4.0%
Cap rate
0.5%
Rent to Value Ratio
Active
$520,000
3
bds
|
2
ba
|
2,161
sqft
|
built
2020
653 Edgerton Dr, Wilmington, NC 28412
$-378
Cash flow
-3.8%
Cash-on-Cash Return
4.8%
Cap rate
0.6%
Rent to Value Ratio
Active
$1,099,000
6
bds
|
5
ba
|
5,308
sqft
|
built
1912
106 S 5th Ave, Wilmington, NC 28401
$-3,963
Cash flow
-18.8%
Cash-on-Cash Return
1.4%
Cap rate
0.2%
Rent to Value Ratio
Active
$725,000
3
bds
|
1
ba
|
1,405
sqft
|
built
1900
2113 Wrightsville Ave, Wilmington, NC 28403
$-2,050
Cash flow
-14.8%
Cash-on-Cash Return
2.3%
Cap rate
0.3%
Rent to Value Ratio
Active
$495,000
3
bds
|
2
ba
|
1,852
sqft
|
built
1965
5021 College Acres Dr, Wilmington, NC 28403
$-479
Cash flow
-5.0%
Cash-on-Cash Return
4.5%
Cap rate
0.5%
Rent to Value Ratio
Active
$419,900
4
bds
|
3
ba
|
2,048
sqft
|
built
2003
7204 Courtney Pines Rd, Wilmington, NC 28411
$-287
Cash flow
-3.6%
Cash-on-Cash Return
4.9%
Cap rate
0.6%
Rent to Value Ratio
Active
$2,095,000
5
bds
|
6
ba
|
6,452
sqft
|
built
1999
141 Middle Oaks Dr, Wilmington, NC 28409
$-6,188
Cash flow
-15.4%
Cash-on-Cash Return
2.1%
Cap rate
0.3%
Rent to Value Ratio

Active
$275,000
3
bds
|
2
ba
|
0
sqft
|
built
1910
909 S 10th St, Wilmington, NC 28401
$-134
Cash flow
-2.5%
Cash-on-Cash Return
5.1%
Cap rate
0.7%
Rent to Value Ratio
Active
$620,000
5
bds
|
3
ba
|
3,078
sqft
|
built
2001
7319 Thurgood Rd, Wilmington, NC 28411
$-686
Cash flow
-5.8%
Cash-on-Cash Return
4.4%
Cap rate
0.6%
Rent to Value Ratio
Active
$670,000
3
bds
|
2
ba
|
2,308
sqft
|
built
1905
610 S 3rd St, Wilmington, NC 28401
$-1,233
Cash flow
-9.6%
Cash-on-Cash Return
3.5%
Cap rate
0.5%
Rent to Value Ratio
Active
$639,000
4
bds
|
3
ba
|
3,103
sqft
|
built
2017
4104 Passerine Ave, Wilmington, NC 28412
$-1,427
Cash flow
-11.7%
Cash-on-Cash Return
3.0%
Cap rate
0.5%
Rent to Value Ratio
Active
$495,000
3
bds
|
2
ba
|
1,770
sqft
|
built
1985
631 The Cape Blvd, Wilmington, NC 28412
$-481
Cash flow
-5.1%
Cash-on-Cash Return
4.5%
Cap rate
0.6%
Rent to Value Ratio
Active
$300,000
2
bds
|
1
ba
|
870
sqft
|
built
1941
2304 Princess Place Dr, Wilmington, NC 28405
$-428
Cash flow
-7.4%
Cash-on-Cash Return
4.0%
Cap rate
0.5%
Rent to Value Ratio
Active
$207,500
2
bds
|
2
ba
|
803
sqft
|
built
1984
4575 Holly Tree Rd, Wilmington, NC 28412
$-99
Cash flow
-2.5%
Cash-on-Cash Return
5.1%
Cap rate
0.7%
Rent to Value Ratio

Active
$575,000
4
bds
|
4
ba
|
2,704
sqft
|
built
2020
1253 Lt Congleton Rd, Wilmington, NC 28409
$-581
Cash flow
-5.3%
Cash-on-Cash Return
4.5%
Cap rate
0.6%
Rent to Value Ratio
Active
$264,800
2
bds
|
2
ba
|
1,433
sqft
|
built
1998
4158 Breezewood Dr, Wilmington, NC 28412
$-341
Cash flow
-6.7%
Cash-on-Cash Return
4.1%
Cap rate
0.7%
Rent to Value Ratio
Active
$2,999,999
2
bds
|
2
ba
|
1,922
sqft
|
built
1995
1324 Final Landing Ln, Wilmington, NC 28411
$-11,669
Cash flow
-20.3%
Cash-on-Cash Return
1.0%
Cap rate
0.2%
Rent to Value Ratio
Active
$990,000
6
bds
|
5
ba
|
5,467
sqft
|
built
1948
708 Market St, Wilmington, NC 28401
$-1,678
Cash flow
-8.8%
Cash-on-Cash Return
3.6%
Cap rate
0.5%
Rent to Value Ratio
Active
$555,000
4
bds
|
3
ba
|
2,300
sqft
|
built
2015
401 Titleist Ln, Wilmington, NC 28412
$-1,039
Cash flow
-9.8%
Cash-on-Cash Return
3.4%
Cap rate
0.5%
Rent to Value Ratio
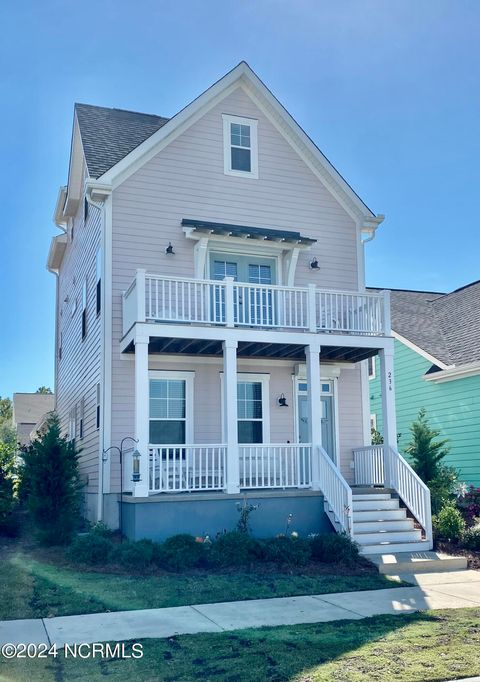
Active
$534,000
3
bds
|
4
ba
|
2,412
sqft
|
built
2018
236 Trisail Ter, Wilmington, NC 28412
$-729
Cash flow
-7.1%
Cash-on-Cash Return
4.0%
Cap rate
0.6%
Rent to Value Ratio

Active
$440,000
3
bds
|
2
ba
|
2,016
sqft
|
built
2001
9208 Slice Ct, Wilmington, NC 28412
$-671
Cash flow
-8.0%
Cash-on-Cash Return
3.8%
Cap rate
0.6%
Rent to Value Ratio
Active
$10,900,000
6
bds
|
8
ba
|
8,317
sqft
|
built
1987
7422 Sea Lilly Ln, Wilmington, NC 28409
$-50,779
Cash flow
-24.3%
Cash-on-Cash Return
0.1%
Cap rate
0.0%
Rent to Value Ratio
Active
$839,000
2
bds
|
3
ba
|
1,226
sqft
|
built
2020
240 N Water St, Wilmington, NC 28401
$-1,486
Cash flow
-9.2%
Cash-on-Cash Return
3.6%
Cap rate
0.4%
Rent to Value Ratio
Active
$399,000
1
bds
|
1
ba
|
585
sqft
|
built
2000
106 N Water St, Wilmington, NC 28401
$-646
Cash flow
-8.4%
Cash-on-Cash Return
3.7%
Cap rate
0.5%
Rent to Value Ratio

Active
$999,999
3
bds
|
3
ba
|
2,573
sqft
|
built
2007
1336 S Moorings Dr, Wilmington, NC 28405
$-2,253
Cash flow
-11.8%
Cash-on-Cash Return
3.0%
Cap rate
0.4%
Rent to Value Ratio