Windermere, FL Investment Properties for Sale
Browse homes for sale and investment properties in Windermere, FL. Refine your search by price, property type, or more.
Best cash flowing properties in Windermere, FL
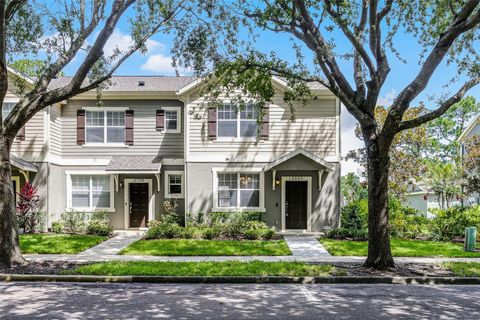
Active
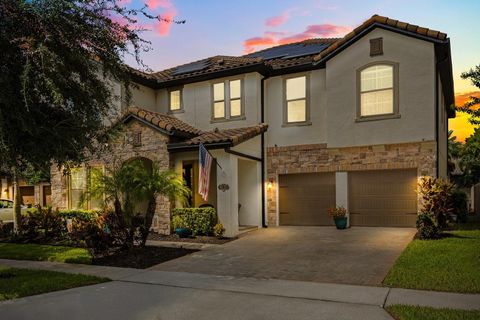
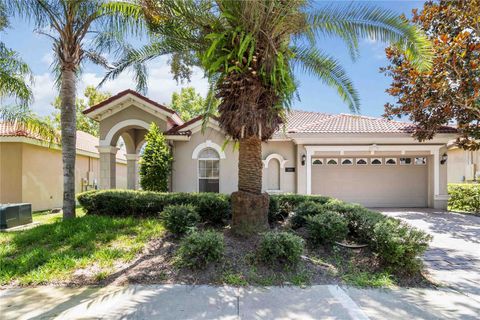
$399,999
2
bds
|
3
ba
|
1,510
sqft
|
built
2006
12335 Cruxbury Dr, Windermere, FL 34786
$-781
Cash flow
-10.2%
Cash-on-Cash Return
3.8%
Cap rate
0.6%
Rent to Value Ratio
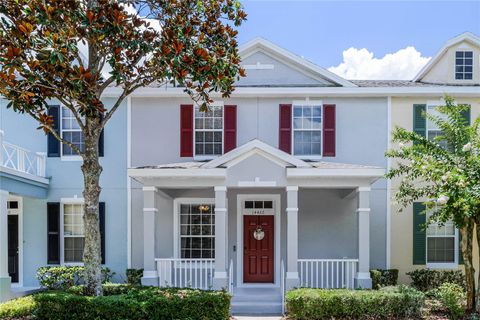
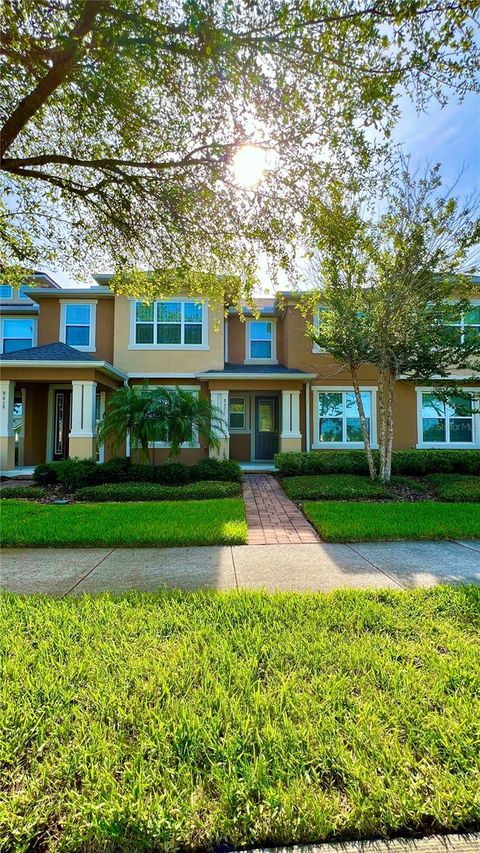
Active
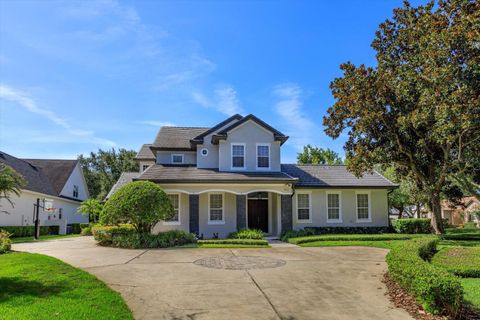
$418,000
4
bds
|
3
ba
|
1,642
sqft
|
built
2006
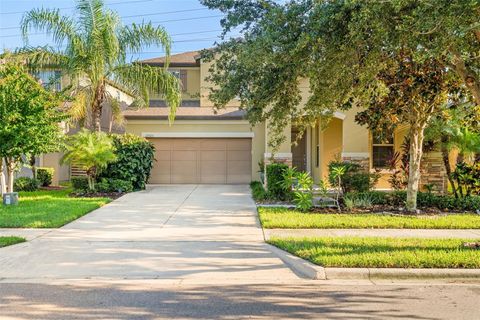
14466 Bridgewater Crossings Blvd, Windermere, FL 34786
$-849
Cash flow
-10.6%
Cash-on-Cash Return
3.7%
Cap rate
0.7%
Rent to Value Ratio
83 out of 92 properties for sale in Windermere, FL
Limited Results Shown
Create a free account, or log in to reveal all property listings and enjoy the complete experience.
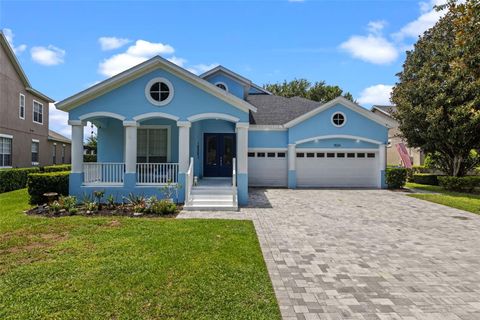
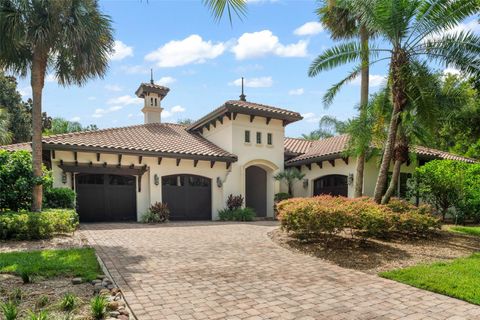
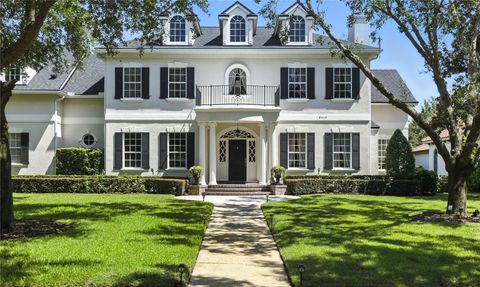
Active
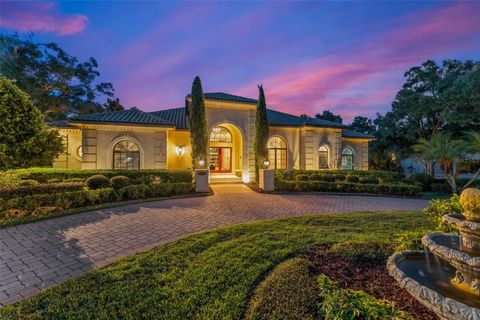
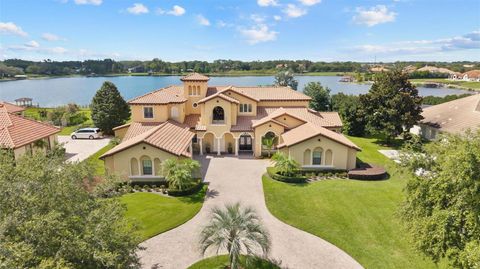
$1,448,000
5
bds
|
4
ba
|
3,358
sqft
|
built
2003
11524 Claymont Cir, Windermere, FL 34786
$-3,491
Cash flow
-12.6%
Cash-on-Cash Return
3.3%
Cap rate
0.4%
Rent to Value Ratio
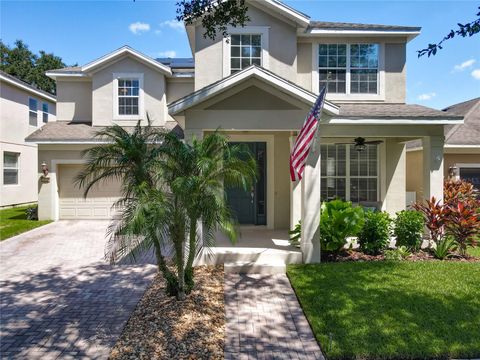
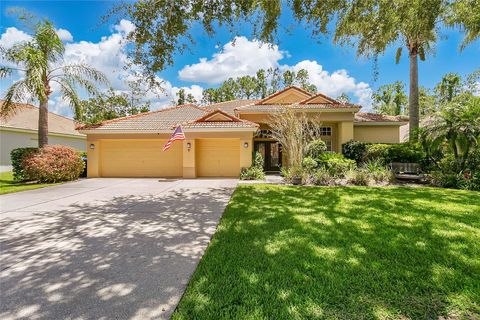
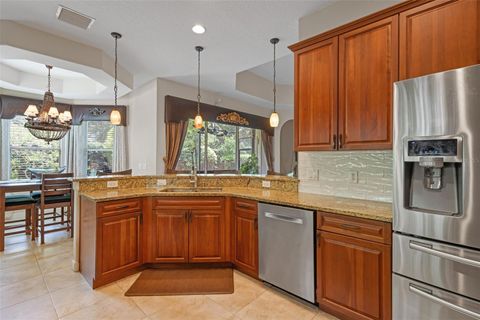
Active
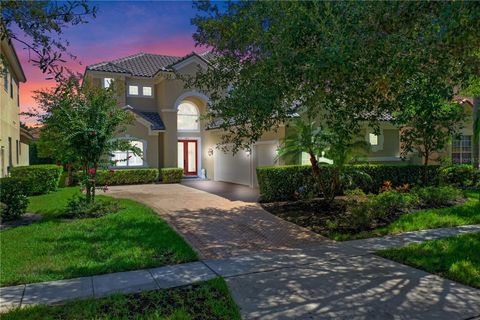
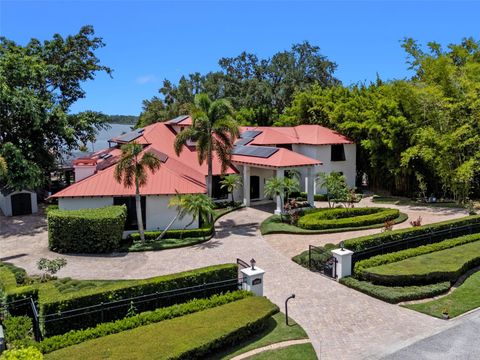
$649,000
4
bds
|
4
ba
|
2,628
sqft
|
built
2008
13225 Charfield St, Windermere, FL 34786
$-1,766
Cash flow
-14.2%
Cash-on-Cash Return
2.9%
Cap rate
0.5%
Rent to Value Ratio
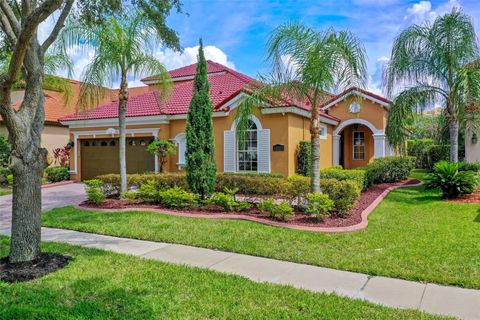
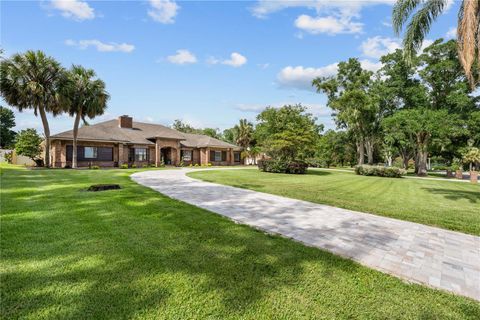
Active
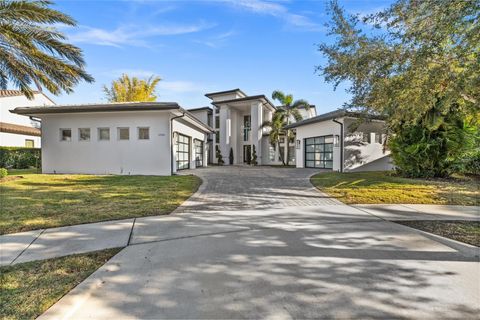
$1,150,000
5
bds
|
5
ba
|
4,061
sqft
|
built
2018
8420 Vivaro Isle Way, Windermere, FL 34786
$-3,714
Cash flow
-16.8%
Cash-on-Cash Return
2.3%
Cap rate
0.4%
Rent to Value Ratio
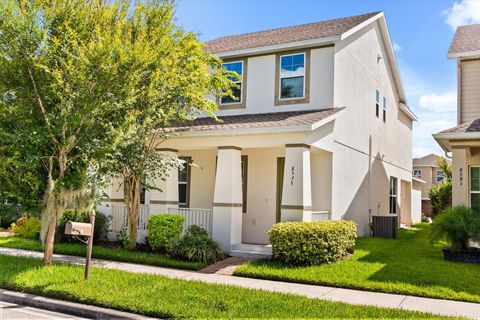
Active
$1,890,000
6
bds
|
4
ba
|
3,894
sqft
|
built
2000
9922 Brentford Ct, Windermere, FL 34786
$-5,832
Cash flow
-16.1%
Cash-on-Cash Return
2.4%
Cap rate
0.5%
Rent to Value Ratio
Active
$3,400,000
4
bds
|
4
ba
|
4,877
sqft
|
built
1986
9731 Chestnut Ridge Dr, Windermere, FL 34786
$-16,182
Cash flow
-24.8%
Cash-on-Cash Return
0.4%
Cap rate
0.2%
Rent to Value Ratio
Active
$990,000
4
bds
|
4
ba
|
3,938
sqft
|
built
2003
1451 Whitney Isles Dr, Windermere, FL 34786
$-2,923
Cash flow
-15.4%
Cash-on-Cash Return
2.6%
Cap rate
0.5%
Rent to Value Ratio
Active
$625,000
4
bds
|
3
ba
|
2,981
sqft
|
built
2013
12925 Holdenbury Ln, Windermere, FL 34786
$-1,343
Cash flow
-11.2%
Cash-on-Cash Return
3.6%
Cap rate
0.6%
Rent to Value Ratio
Active
$378,800
3
bds
|
3
ba
|
1,461
sqft
|
built
2005
5318 Kumquat Loop, Windermere, FL 34786
$-1,032
Cash flow
-14.2%
Cash-on-Cash Return
2.9%
Cap rate
0.7%
Rent to Value Ratio
Active
$1,170,000
4
bds
|
4
ba
|
4,676
sqft
|
built
1999
2107 Westover Reserve Blvd, Windermere, FL 34786
$-1,955
Cash flow
-8.7%
Cash-on-Cash Return
4.1%
Cap rate
0.6%
Rent to Value Ratio
Active
$3,450,000
6
bds
|
8
ba
|
7,559
sqft
|
built
2016
4077 Isabella Cir, Windermere, FL 34786
$-15,371
Cash flow
-23.2%
Cash-on-Cash Return
0.8%
Cap rate
0.3%
Rent to Value Ratio
Active
$1,750,000
5
bds
|
4
ba
|
3,805
sqft
|
built
1913
311 E 8th Ave, Windermere, FL 34786
$-5,855
Cash flow
-17.5%
Cash-on-Cash Return
2.1%
Cap rate
0.4%
Rent to Value Ratio
Active
$480,000
3
bds
|
3
ba
|
1,779
sqft
|
built
2019
13333 Gorgona Isle Dr, Windermere, FL 34786
$-859
Cash flow
-9.3%
Cash-on-Cash Return
4.0%
Cap rate
0.6%
Rent to Value Ratio
Active
$679,000
3
bds
|
3
ba
|
2,463
sqft
|
built
2018
12815 Westside Village Loop, Windermere, FL 34786
$-2,035
Cash flow
-15.6%
Cash-on-Cash Return
2.6%
Cap rate
0.5%
Rent to Value Ratio
Active
$570,000
3
bds
|
3
ba
|
1,984
sqft
|
built
2012
6266 Golden Dewdrop Trl, Windermere, FL 34786
$-1,519
Cash flow
-13.9%
Cash-on-Cash Return
2.9%
Cap rate
0.6%
Rent to Value Ratio
Active
$3,200,000
4
bds
|
5
ba
|
3,745
sqft
|
built
2006
4819 Alexandra Garden Ct, Windermere, FL 34786
$-17,540
Cash flow
-28.6%
Cash-on-Cash Return
-0.4%
Cap rate
0.2%
Rent to Value Ratio
Active
$974,900
5
bds
|
5
ba
|
3,285
sqft
|
built
2003
11096 Ledgement Ln, Windermere, FL 34786
$-2,961
Cash flow
-15.8%
Cash-on-Cash Return
2.5%
Cap rate
0.5%
Rent to Value Ratio
Active
$630,000
4
bds
|
2
ba
|
2,505
sqft
|
built
2005
11520 Via Lucerna Cir, Windermere, FL 34786
$-1,665
Cash flow
-13.8%
Cash-on-Cash Return
3.0%
Cap rate
0.6%
Rent to Value Ratio
Active
$539,900
3
bds
|
3
ba
|
2,154
sqft
|
built
2015
8575 Lookout Pointe Dr, Windermere, FL 34786
$-1,440
Cash flow
-13.9%
Cash-on-Cash Return
2.9%
Cap rate
0.5%
Rent to Value Ratio
Active
$895,000
4
bds
|
5
ba
|
3,051
sqft
|
built
2004
11660 Delwick Dr, Windermere, FL 34786
$-1,981
Cash flow
-11.5%
Cash-on-Cash Return
3.5%
Cap rate
0.6%
Rent to Value Ratio
Active
$2,895,000
5
bds
|
7
ba
|
6,105
sqft
|
built
2003
11209 Macaw Ct, Windermere, FL 34786
$-11,128
Cash flow
-20.1%
Cash-on-Cash Return
1.5%
Cap rate
0.3%
Rent to Value Ratio
Active
$530,000
3
bds
|
3
ba
|
1,826
sqft
|
built
2015
10750 Reams Rd, Windermere, FL 34786
$-867
Cash flow
-8.5%
Cash-on-Cash Return
4.2%
Cap rate
0.7%
Rent to Value Ratio
Active
$1,200,000
7
bds
|
4
ba
|
3,928
sqft
|
built
2012
12023 Gold Creek Trl, Windermere, FL 34786
$-2,239
Cash flow
-9.7%
Cash-on-Cash Return
3.9%
Cap rate
0.6%
Rent to Value Ratio
Active
$585,000
4
bds
|
2
ba
|
2,159
sqft
|
built
2002
11322 Rapallo Ln, Windermere, FL 34786
$-1,834
Cash flow
-16.4%
Cash-on-Cash Return
2.4%
Cap rate
0.5%
Rent to Value Ratio
Active
$3,799,000
4
bds
|
5
ba
|
6,054
sqft
|
built
2007
12812 Jacob Grace Ct, Windermere, FL 34786
$-15,887
Cash flow
-21.8%
Cash-on-Cash Return
1.1%
Cap rate
0.2%
Rent to Value Ratio
Active
$3,795,000
5
bds
|
7
ba
|
7,263
sqft
|
built
1987
10545 Down Lakeview Cir, Windermere, FL 34786
$-19,548
Cash flow
-26.9%
Cash-on-Cash Return
0.0%
Cap rate
0.1%
Rent to Value Ratio
Active
$5,890,000
4
bds
|
7
ba
|
7,872
sqft
|
built
2017
12264 Montalcino Cir, Windermere, FL 34786
$-31,638
Cash flow
-28.0%
Cash-on-Cash Return
-0.3%
Cap rate
0.2%
Rent to Value Ratio
Active
$401,990
3
bds
|
3
ba
|
1,554
sqft
|
built
2016
8625 Coventry Park Way, Windermere, FL 34786
$-1,035
Cash flow
-13.4%
Cash-on-Cash Return
3.1%
Cap rate
0.7%
Rent to Value Ratio
Active
$2,195,000
5
bds
|
5
ba
|
5,052
sqft
|
built
2006
9210 Tibet Pointe Cir, Windermere, FL 34786
$-8,259
Cash flow
-19.6%
Cash-on-Cash Return
1.6%
Cap rate
0.3%
Rent to Value Ratio
Active
$659,900
3
bds
|
3
ba
|
2,433
sqft
|
built
2005
1656 Whitney Isles Dr, Windermere, FL 34786
$-1,481
Cash flow
-11.7%
Cash-on-Cash Return
3.5%
Cap rate
0.5%
Rent to Value Ratio
Active
$1,350,000
4
bds
|
3
ba
|
3,888
sqft
|
built
1985
10506 Down Lakeview Cir, Windermere, FL 34786
$-4,419
Cash flow
-17.1%
Cash-on-Cash Return
2.2%
Cap rate
0.4%
Rent to Value Ratio
Active
$3,250,000
4
bds
|
6
ba
|
4,849
sqft
|
built
2002
6186 Louise Cove Dr, Windermere, FL 34786
$-13,560
Cash flow
-21.8%
Cash-on-Cash Return
1.1%
Cap rate
0.3%
Rent to Value Ratio
Active
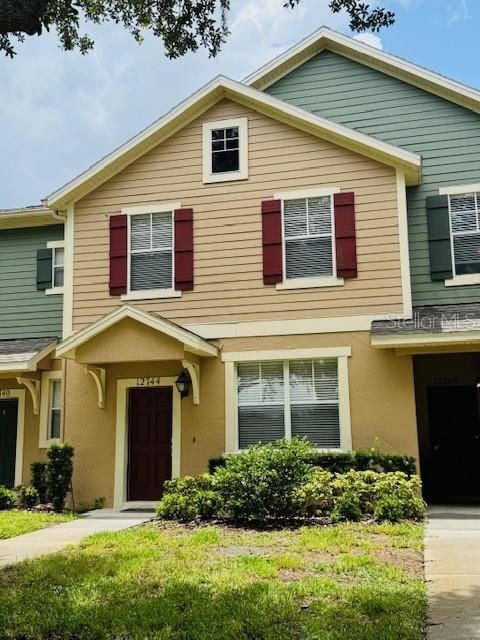
$389,000
3
bds
|
3
ba
|
1,369
sqft
|
built
2004
12744 Langstaff Dr, Windermere, FL 34786
$-902
Cash flow
-12.1%
Cash-on-Cash Return
3.4%
Cap rate
0.6%
Rent to Value Ratio
Active
$1,399,000
4
bds
|
4
ba
|
2,681
sqft
|
built
1987
3417 Bay Meadow Ct, Windermere, FL 34786
$-5,392
Cash flow
-20.1%
Cash-on-Cash Return
1.5%
Cap rate
0.3%
Rent to Value Ratio
Active
$409,000
3
bds
|
3
ba
|
1,584
sqft
|
built
2017
11686 Water Run Aly, Windermere, FL 34786
$-936
Cash flow
-11.9%
Cash-on-Cash Return
3.4%
Cap rate
0.6%
Rent to Value Ratio
Active
$399,990
3
bds
|
3
ba
|
1,462
sqft
|
built
2004
5235 Keenes Pheasant Dr, Windermere, FL 34786
$-1,162
Cash flow
-15.2%
Cash-on-Cash Return
2.7%
Cap rate
0.6%
Rent to Value Ratio
Active
$1,499,900
5
bds
|
5
ba
|
4,477
sqft
|
built
2007
1450 Belfiore Way, Windermere, FL 34786
$-4,190
Cash flow
-14.6%
Cash-on-Cash Return
2.8%
Cap rate
0.5%
Rent to Value Ratio
Active
$2,650,000
5
bds
|
8
ba
|
7,621
sqft
|
built
2011
9905 Lanai View Ct, Windermere, FL 34786
$-9,467
Cash flow
-18.6%
Cash-on-Cash Return
1.9%
Cap rate
0.3%
Rent to Value Ratio
Active
$759,500
4
bds
|
4
ba
|
2,820
sqft
|
built
2008
6832 Thornhill Cir, Windermere, FL 34786
$-1,899
Cash flow
-13.0%
Cash-on-Cash Return
3.1%
Cap rate
0.5%
Rent to Value Ratio