Woodland Park, CO Investment Properties for Sale
Browse homes for sale and investment properties in Woodland Park, CO. Refine your search by price, property type, or more.
Best cash flowing properties in Woodland Park, CO

Active
$200,000
2
bds
|
1
ba
|
728
sqft
|
built
1982
310 Blossom Rd, Woodland Park, CO 80863
$0
Cash flow
n/a
Cash-on-Cash Return
n/a
Cap rate
n/a
Rent to Value Ratio

Active
$285,000
1
bds
|
1
ba
|
672
sqft
|
built
2002
345 Klitowya Trl, Woodland Park, CO 80863
$-196
Cash flow
-3.6%
Cash-on-Cash Return
4.9%
Cap rate
0.6%
Rent to Value Ratio
39 out of 75 properties for sale in Woodland Park, CO
Limited Results Shown
Create a free account, or log in to reveal all property listings and enjoy the complete experience.
Active
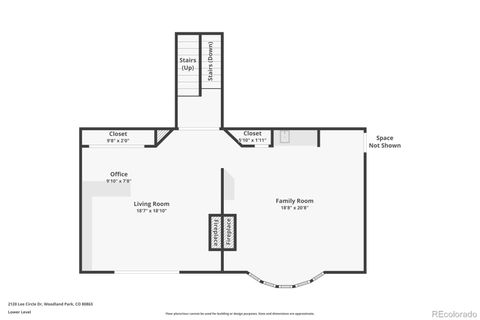
$2,199,999
4
bds
|
2
ba
|
4,852
sqft
|
built
1980
2120 Lee Circle Dr, Woodland Park, CO 80863
$-7,897
Cash flow
-18.7%
Cash-on-Cash Return
1.4%
Cap rate
0.2%
Rent to Value Ratio
Active
$1,225,000
4
bds
|
4
ba
|
3,960
sqft
|
built
2007
700 Sunrise Cir, Woodland Park, CO 80863
$-3,828
Cash flow
-16.3%
Cash-on-Cash Return
1.9%
Cap rate
0.3%
Rent to Value Ratio
Active
$399,000
4
bds
|
1
ba
|
816
sqft
|
built
2002
429 Gentian Rd, Woodland Park, CO 80863
$-464
Cash flow
-6.1%
Cash-on-Cash Return
4.3%
Cap rate
0.6%
Rent to Value Ratio
Active
$989,900
5
bds
|
4
ba
|
3,524
sqft
|
built
2000
556 Crystola Ct, Woodland Park, CO 80863
$-1,987
Cash flow
-10.5%
Cash-on-Cash Return
3.3%
Cap rate
0.4%
Rent to Value Ratio
Active
$485,000
4
bds
|
2
ba
|
1,868
sqft
|
built
1974
418 N Baldwin St, Woodland Park, CO 80863
$-1,293
Cash flow
-13.9%
Cash-on-Cash Return
2.5%
Cap rate
0.4%
Rent to Value Ratio
Active
$825,000
3
bds
|
4
ba
|
3,784
sqft
|
built
2003
931 Heather Ct, Woodland Park, CO 80863
$-1,073
Cash flow
-6.8%
Cash-on-Cash Return
4.1%
Cap rate
0.5%
Rent to Value Ratio
Active
$599,900
3
bds
|
2
ba
|
1,092
sqft
|
built
1971
500 W Kelly Rd, Woodland Park, CO 80863
$-1,229
Cash flow
-10.7%
Cash-on-Cash Return
3.2%
Cap rate
0.4%
Rent to Value Ratio
Active
$389,000
2
bds
|
2
ba
|
1,316
sqft
|
built
2018
501 Wakanda Trl, Woodland Park, CO 80863
$-403
Cash flow
-5.4%
Cash-on-Cash Return
4.4%
Cap rate
0.6%
Rent to Value Ratio
Active
$685,000
3
bds
|
2
ba
|
1,595
sqft
|
built
2019
14077 S State Highway 67, Woodland Park, CO 80863
$-1,069
Cash flow
-8.1%
Cash-on-Cash Return
3.8%
Cap rate
0.5%
Rent to Value Ratio

Active
$750,000
3
bds
|
3
ba
|
2,141
sqft
|
built
1990
2601 Vista Glen Ct, Woodland Park, CO 80863
$-1,583
Cash flow
-11.0%
Cash-on-Cash Return
3.1%
Cap rate
0.4%
Rent to Value Ratio
Active
$2,999,900
6
bds
|
8
ba
|
9,097
sqft
|
built
2004
419 Lucky Lady Dr, Woodland Park, CO 80863
$-11,611
Cash flow
-20.2%
Cash-on-Cash Return
1.0%
Cap rate
0.2%
Rent to Value Ratio

Active
$450,000
3
bds
|
2
ba
|
1,832
sqft
|
built
1957
150 Apache Trl, Woodland Park, CO 80863
$-425
Cash flow
-4.9%
Cash-on-Cash Return
4.5%
Cap rate
0.6%
Rent to Value Ratio
Active
$760,000
3
bds
|
3
ba
|
3,306
sqft
|
built
1996
1321 Forest Edge Rd, Woodland Park, CO 80863
$-1,619
Cash flow
-11.1%
Cash-on-Cash Return
3.1%
Cap rate
0.4%
Rent to Value Ratio
Active
$1,250,000
3
bds
|
3
ba
|
3,415
sqft
|
built
1999
111 E Lovell Gulch Rd, Woodland Park, CO 80863
$-3,481
Cash flow
-14.5%
Cash-on-Cash Return
2.3%
Cap rate
0.3%
Rent to Value Ratio
Active
$515,000
3
bds
|
2
ba
|
1,778
sqft
|
built
2003
635 Wakanda Trl, Woodland Park, CO 80863
$-878
Cash flow
-8.9%
Cash-on-Cash Return
3.6%
Cap rate
0.5%
Rent to Value Ratio
Active
$739,900
4
bds
|
2
ba
|
2,496
sqft
|
built
2020
1378 Millstone Ln, Woodland Park, CO 80863
$-1,415
Cash flow
-10.0%
Cash-on-Cash Return
3.4%
Cap rate
0.5%
Rent to Value Ratio
Active
$2,395,000
4
bds
|
5
ba
|
4,984
sqft
|
built
2013
201 Fox Mountain Dr, Woodland Park, CO 80863
$-8,518
Cash flow
-18.6%
Cash-on-Cash Return
1.4%
Cap rate
0.2%
Rent to Value Ratio
Active
$325,000
2
bds
|
2
ba
|
1,500
sqft
|
built
1985
590 Greenway Ct, Woodland Park, CO 80863
$-665
Cash flow
-10.7%
Cash-on-Cash Return
3.2%
Cap rate
0.7%
Rent to Value Ratio
Active
$465,000
3
bds
|
2
ba
|
1,520
sqft
|
built
1981
430 Shady Ln, Woodland Park, CO 80863
$-655
Cash flow
-7.3%
Cash-on-Cash Return
4.0%
Cap rate
0.5%
Rent to Value Ratio

Active
$695,000
3
bds
|
4
ba
|
3,883
sqft
|
built
2000
352 Gray Horse Cir, Woodland Park, CO 80863
$-812
Cash flow
-6.1%
Cash-on-Cash Return
4.3%
Cap rate
0.6%
Rent to Value Ratio

Active
$570,000
3
bds
|
2
ba
|
1,428
sqft
|
built
1985
1300 Thomas Cir, Woodland Park, CO 80863
$-1,078
Cash flow
-9.9%
Cash-on-Cash Return
3.4%
Cap rate
0.5%
Rent to Value Ratio
Active
$399,000
3
bds
|
2
ba
|
1,560
sqft
|
built
2012
50 Dakota Ln, Woodland Park, CO 80863
$-495
Cash flow
-6.5%
Cash-on-Cash Return
4.2%
Cap rate
0.6%
Rent to Value Ratio
Active
$484,000
2
bds
|
2
ba
|
1,638
sqft
|
built
1993
47 Aspen Rd, Woodland Park, CO 80863
$-477
Cash flow
-5.1%
Cash-on-Cash Return
4.5%
Cap rate
0.6%
Rent to Value Ratio
Active
$2,200,000
5
bds
|
8
ba
|
9,395
sqft
|
built
2001
221 Columbine Pl, Woodland Park, CO 80863
$-8,546
Cash flow
-20.3%
Cash-on-Cash Return
1.0%
Cap rate
0.2%
Rent to Value Ratio
Active
$625,000
3
bds
|
4
ba
|
2,680
sqft
|
built
2006
1511 Crestview Way, Woodland Park, CO 80863
$-1,211
Cash flow
-10.1%
Cash-on-Cash Return
3.4%
Cap rate
0.5%
Rent to Value Ratio
Active
$689,000
3
bds
|
3
ba
|
2,478
sqft
|
built
1999
350 Panther Ct, Woodland Park, CO 80863
$-1,358
Cash flow
-10.3%
Cash-on-Cash Return
3.3%
Cap rate
0.4%
Rent to Value Ratio
Active
$697,700
4
bds
|
3
ba
|
2,982
sqft
|
built
1982
1003 Kings Crown Rd, Woodland Park, CO 80863
$-1,539
Cash flow
-11.5%
Cash-on-Cash Return
3.0%
Cap rate
0.4%
Rent to Value Ratio
Active
$370,000
1
bds
|
1
ba
|
672
sqft
|
built
2002
526 Wakanda Trl, Woodland Park, CO 80863
$-490
Cash flow
-6.9%
Cash-on-Cash Return
4.1%
Cap rate
0.5%
Rent to Value Ratio
Active
$575,000
4
bds
|
0
ba
|
1,532
sqft
|
built
1972
1148 Parkview Rd, Woodland Park, CO 80863
$-831
Cash flow
-7.5%
Cash-on-Cash Return
3.9%
Cap rate
0.5%
Rent to Value Ratio
Active
$764,800
3
bds
|
3
ba
|
2,639
sqft
|
built
2001
320 Summit Rd, Woodland Park, CO 80863
$-1,676
Cash flow
-11.4%
Cash-on-Cash Return
3.0%
Cap rate
0.4%
Rent to Value Ratio
Active
$749,000
4
bds
|
3
ba
|
2,746
sqft
|
built
1996
2255 Spruce Rd, Woodland Park, CO 80863
$-1,593
Cash flow
-11.1%
Cash-on-Cash Return
3.1%
Cap rate
0.4%
Rent to Value Ratio
Active
$462,500
2
bds
|
2
ba
|
1,720
sqft
|
built
1986
1908 Valley View Dr, Woodland Park, CO 80863
$-501
Cash flow
-5.7%
Cash-on-Cash Return
4.4%
Cap rate
0.6%
Rent to Value Ratio
Active
$460,000
2
bds
|
2
ba
|
1,424
sqft
|
built
2021
269 Klitowya Trl, Woodland Park, CO 80863
$-612
Cash flow
-6.9%
Cash-on-Cash Return
4.1%
Cap rate
0.5%
Rent to Value Ratio
Active
$439,500
2
bds
|
2
ba
|
960
sqft
|
built
2004
155 Squilchuck Trl, Woodland Park, CO 80863
$-487
Cash flow
-5.8%
Cash-on-Cash Return
4.3%
Cap rate
0.6%
Rent to Value Ratio
Active
$769,000
4
bds
|
4
ba
|
3,338
sqft
|
built
2001
1300 W Midland Ave, Woodland Park, CO 80863
$-1,936
Cash flow
-13.1%
Cash-on-Cash Return
2.7%
Cap rate
0.4%
Rent to Value Ratio
Active
$650,000
3
bds
|
2
ba
|
2,000
sqft
|
built
2017
1136 Ptarmigan Dr, Woodland Park, CO 80863
$-1,428
Cash flow
-11.5%
Cash-on-Cash Return
3.0%
Cap rate
0.4%
Rent to Value Ratio
Active
$610,000
3
bds
|
2
ba
|
1,803
sqft
|
built
1986
1955 Valley View Dr, Woodland Park, CO 80863
$-1,218
Cash flow
-10.4%
Cash-on-Cash Return
3.3%
Cap rate
0.4%
Rent to Value Ratio