


All Forum Posts by: Steven S.
Steven S. has started 6 posts and replied 112 times.
 Post: What software should I be taking advantage of when investing in real estate
- Specialist
- LA & Ventura
- Posts 119
- Votes 60
Quote from @Joseph Fenner:
Quote from @Account Closed:
Quote from @Joseph Fenner:
Quote from @Account Closed:
Quote from @Joseph Fenner:
What software should I take advantage of that will help me analyze deals, comps, market research, etc. A all in one tool that every real estate investor should have?
You can get that from Propstream, Redfin, Property Radar.
My experience is they are all different numbers and are "best guesses". They are "okay" for generalized information, but if you are putting money on a property, in my opinion you want better analysis than those provide.
Ok I will check those websites out, Thank you.
There's a variety of ways to get a deal in front of you (I'm mostly a flipper), but basically if it looks promising, I run custom comps queries and check the current & past $/sf of renovated/distressed product in that city or zipcode.
Here's a chart on 90066 I generated from my tool under Market Stats > Sales Data > Specific Zip Code:

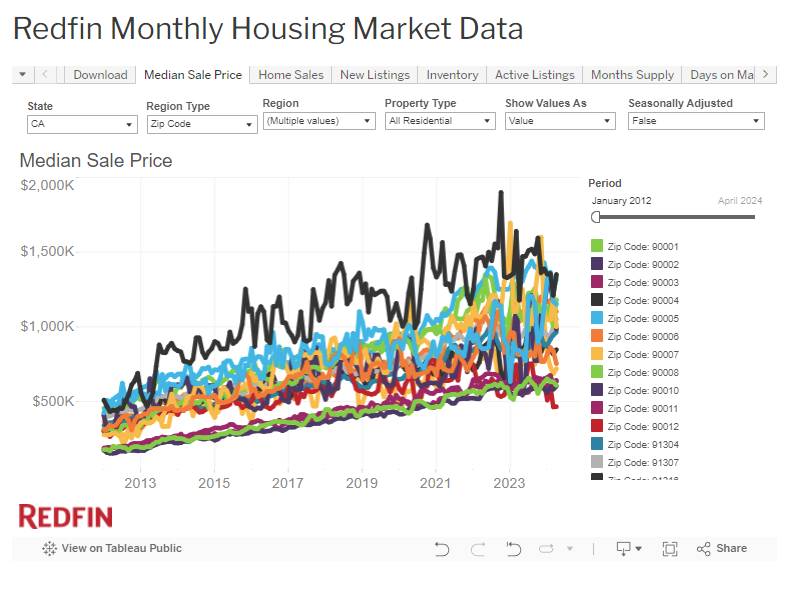
- My above chart (more available) shows the Avg Renovated $/sf (High) over time in this Zip Code, something completely different than charts/providers based on Averages/Medians only, like every other platform (RedFin Below, https://www.redfin.com/news/data-center/):

- Can't select smaller locations such as City or Zipcode for their $/sf data, so it's useless helping me underwrite/verify a deal.

- Can set Zip Code for Median Sale Price data, but again it's the median/avg so it's useless helping me underwrite/verify a deal.
Then if that looks decent, I'll run Sales Comps, and get a quick summary of some key metrics based on those comps. Take this 💥just-closed renovated property for example💥:

With my query of "22757 Charlemont Pl, Woodland Hills, CA 91364 5/4/2400-3050,0.6,300" we get an ARV Estimate that is ~4% off, and I picked this at random just scrolling through recently closed in my area

And the Market Stats $/sf of renovated property in that Zip Code matches up pretty well, so I know the ARV estimate is realistic:

You can also run Agent Stats to find/get in touch with the real top-agents in that area so you can triple-verify everything and/or list it with them when you are done.
With the above, I am able to quickly vet every new deal that comes my way and spend more time on the good ones. Without these tools, you'd have to do a lot of manual data collection and copy/pasting of comps/data into a spreadsheet for every property you analyze, was kinda the reason for building this out.
Post: What Tools Do You Use For Market Research
- Specialist
- LA & Ventura
- Posts 119
- Votes 60
Quote from @Antonio Waller:
Hello All,
What tools do you guys use when researching/analyzing a potential market?
There's a variety of ways to get a deal in front of you (I'm mostly a flipper), but basically if it looks promising, I run custom comps queries and check the current & past $/sf of renovated/distressed product in that city or zipcode.
Here's a chart on 90066 I generated from my tool under Market Stats > Sales Data > Specific Zip Code:
- My above chart (more available) shows the Avg Renovated $/sf (High) over time in this Zip Code, something completely different than charts/providers based on Averages/Medians only, like every other platform (RedFin Below, https://www.redfin.com/news/data-center/):
- Can't select smaller locations such as City or Zipcode for their $/sf data, so it's useless helping me underwrite/verify a deal.
- Can set Zip Code for Median Sale Price data, but again it's the median/avg so it's useless helping me underwrite/verify a deal.
Then if that looks decent, I'll run Sales Comps, and get a quick summary of some key metrics based on those comps. Take this 💥just-closed renovated property for example💥:
With my query of "22757 Charlemont Pl, Woodland Hills, CA 91364 5/4/2400-3050,0.6,300" we get an ARV Estimate that is ~4% off, and I picked this at random just scrolling through recently closed in my area
And the Market Stats $/sf of renovated property in that Zip Code matches up pretty well, so I know the ARV estimate is realistic:
You can also run Agent Stats to find/get in touch with the real top-agents in that area so you can triple-verify everything and/or list it with them when you are done.
With the above, I am able to quickly vet every new deal that comes my way and spend more time on the good ones. Without these tools, you'd have to do a lot of manual data collection and copy/pasting of comps/data into a spreadsheet for every property you analyze, was kinda the reason for building this out.
Post: How Do You Conduct Market Research for Your Investments?
- Specialist
- LA & Ventura
- Posts 119
- Votes 60
Quote from @Moses Sefah Bosompem:
Understanding the market is crucial for making informed investment decisions. How do you conduct your market research? can you share your methods and tools?
There's a variety of ways to get a deal in front of you (I'm mostly a flipper), but basically if it looks promising, I run custom comps queries and check the current & past $/sf of renovated/distressed product in that city or zipcode.
Here's a chart on 90066 I generated from my tool under Market Stats > Sales Data > Specific Zip Code:
- My above chart (more available) shows the Avg Renovated $/sf (High) over time in this Zip Code, something completely different than charts/providers based on Averages/Medians only, like every other platform (RedFin Below, https://www.redfin.com/news/data-center/):
- Can't select smaller locations such as City or Zipcode for their $/sf data, so it's useless helping me underwrite/verify a deal.
- Can set Zip Code for Median Sale Price data, but again it's the median/avg so it's useless helping me underwrite/verify a deal.
Then if that looks decent, I'll run Sales Comps, and get a quick summary of some key metrics based on those comps. Take this 💥just-closed renovated property for example💥:
With my query of "22757 Charlemont Pl, Woodland Hills, CA 91364 5/4/2400-3050,0.6,300" we get an ARV Estimate that is ~4% off, and I picked this at random just scrolling through recently closed in my area
And the Market Stats $/sf of renovated property in that Zip Code matches up pretty well, so I know the ARV estimate is realistic:
You can also run Agent Stats to find/get in touch with the real top-agents in that area so you can triple-verify everything and/or list it with them when you are done.
Post: New Listings Analyzer for LA/Ventura, and Detailed Market & Comps Data Tool
- Specialist
- LA & Ventura
- Posts 119
- Votes 60
I created this to identify opportunities faster, and to be more confident closing them! 😎
Identifying opportunity in new listings is easier with the Daily Spread Analyzer, as a flipper or wholesaler/wholetailer:


If it looks promising, run custom comps queries and check the current & past $/sf of renovated/distressed product in that city or zipcode on app.runcomps.org & enter your_best_friend
Here's a chart on 90066 I generated under Market Stats > Sales Data > Specific Zip Code:
- My above chart (more available) shows the Avg Renovated $/sf (High) over time in this Zip Code, something completely different than charts/providers based on Averages/Medians only, like every other platform (RedFin Below, https://www.redfin.com/news/data-center/):
- Can't select smaller locations such as City or Zipcode for their $/sf data, so it's useless helping me underwrite/verify a deal.
- Can set Zip Code for Median Sale Price data, but again it's the median/avg so it's useless helping me underwrite/verify a deal.
You can also run Sales Comps, and get a quick summary of some key metrics based on those comps! Take this 💥just-closed renovated property for example💥:
With the RUNCOMPS query of "22757 Charlemont Pl, Woodland Hills, CA 91364 5/4/2400-3050,0.6,300" we get an ARV Estimate that is ~4% off, and I picked this at random just scrolling through recently closed in my area
And the Market Stats $/sf of renovated property in that Zip Code matches up pretty well, so I know the ARV estimate is realistic:
You can also run Agent Stats to find/get in touch with the real top-agents in that area so you can triple-verify everything and/or list it with them when you are done.
app.runcomps.org & enter your_best_friend. If you want to be subscribed to the emails of the Daily Spread Analyzer, just contact me and I'll add you as a recipient.
Would love to hear any thoughts, especially ways to make it better for how you underwrite properties! Thanks for reading
Post: Anybody Need Housing Data?
- Specialist
- LA & Ventura
- Posts 119
- Votes 60
This is cool! But I think that because I like good data visualizations. As for usefulness to me, a flipper/builder of SFRs & 3-6 unit rental properties in the SFV & West-LA, I don't see it providing any value.
This tool seems focused on macroecomonic trends (for example, I can't zoom into see all the cities I participate in, nor can your tool accept a City like Woodland Hills or Reseda):
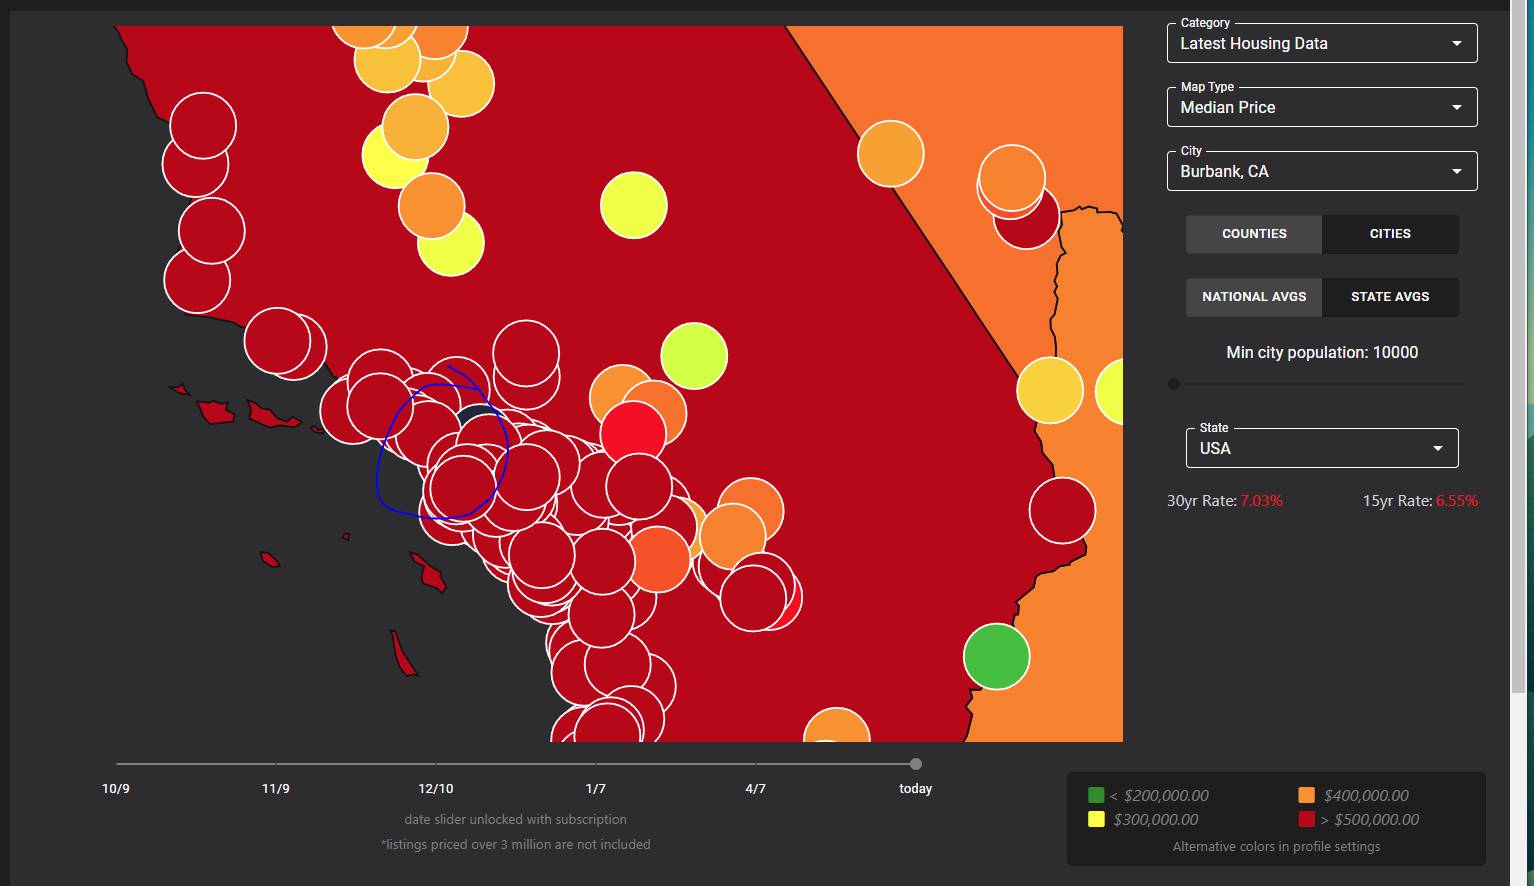
Second, your conclusions/coloring/etc are all based on Medians & Averages. This doesn't help me make a buying decision as it's just too broad/generalized. I want to know what the Avg RENOVATED $/sf, DOM (days on market), etc are, AND what the Avg DISTRESSED $/sf, DOM, etc are, because that's what I'm manually calculating/checking to come up with my estimated disposition & offer price. This Average & Median-based data you are plotting is already being prepared, for free, in a better-to-use UI, by RedFin: https://www.redfin.com/news/data-center/ (but again, not super useful to a flipper/developer due to the above).
What us flippers care about most are recently renovated sold comps and their metrics. Secondly, we care about drilled-down market stats. So don't reinvent the wheel and make your Average & Median-plotting dashboard work with Zip Codes, MSA's, or whatever, the RedFin tool above already does that, and they have more!
If you have all this data to locally calculate on, come up with more advanced ways to separate the data to allow calculation of Renovated $/sf, Distressed $/sf, etc per Location (Zip Code, City, Drawn Region), something RedFin isn't doing. Also, a auto-comps feature would be great! If I enter an address, BR, BTH, and SF range, it could run comps for me and then perform market stats on those transactions, to give me an even more drilled-down idea of the exact deal.
I built a tool for myself called RUNCOMPS, but it only is for LA/Ventura county. Check it out, make sure to use the Sales Comps feature and Market Stats > Sales Data > Specific Zip/City feature, and you will get a good idea of what I mean:
- app.runcomps.org
- your_best_friend
Props to you! Hope to see this get built-out
Post: Analyze this Property
- Specialist
- LA & Ventura
- Posts 119
- Votes 60
Quote from @Lisa H.:
Lets say you aquire an inherited property that's paid off. It rents for $3300 a month but with taxes, insurance, HOA, PM, maintenance and vacancy % expenses, it only cash flows $1950. Sounds great but it's worth 600k-650k. It's only paying out about 3.8%. The house is an an A/B class area. Very little chance you will have to deal with evictions with the quality of tenants. It borders LA county but is in Ventura county.
Would you continue to rent it? Sell it? Reinvest it? Obviously taxes play a part. Not sure about all the tax implications. All ideas, thoughts and opinions welcomed!
If the property was acquired 7+ years ago, your returns from appreciation will be massive & unmatched by renting this out. A better metric for you to evaluate rental property performance is to take the annual CF and divide it by your all-in costs (not the current value) on the project so you can see what yields you are getting from your past-spent dollars. Just add up the original purchase, add any renovations/construction/improvements, and divide $23,400 by that number to get your annual CF yield %.
If it's 10-15%+ annually, you might want to hold it since that yield on your current cash is hard to beat. If it's closer to 5%, I'd say capture the appreciation dollars by selling, and 1031 the funds to a slightly larger project
Post: Quad Development project in South Pasadena CA
- Specialist
- LA & Ventura
- Posts 119
- Votes 60
Quote from @Brad S.:
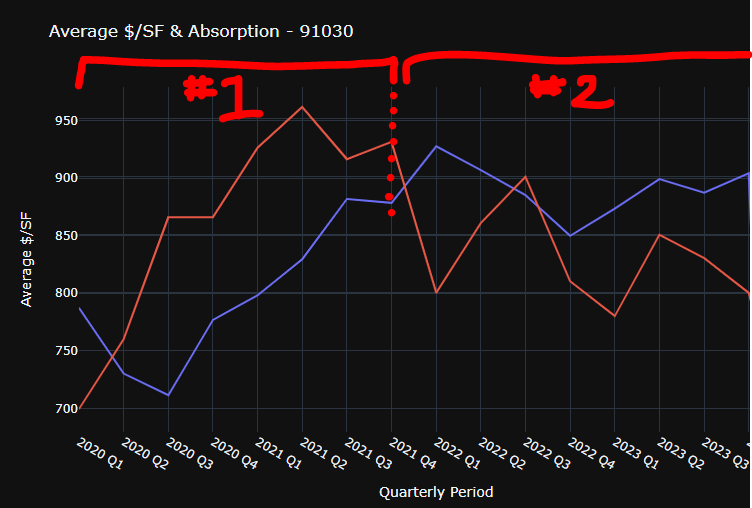
I personally am pretty biased. I like to get it prior to any value being added, like prior to when he bought it. The previous sale was $1,267,000 in 2020, and it already seemed renovated then also.
Ya whoever bought & sold it before Richard timed the market very well, or just got lucky! They made about $150k/year off appreciation alone (before paying closing costs & commission) for the 2 years they owned it:
Blue line is Avg $/sf, Red line is Absorption or Closed Sales, look at that upward slope!
Post: Too many off-market leads for me to actually execute on
- Specialist
- LA & Ventura
- Posts 119
- Votes 60
Quote from @Max Yuan:
I think we can agree finding good quality off-market leads is not easy. Even with PropStream and PropertyRadar, I'm usually not the first to reach out upon seeing the lead. As a result, I actually created my own frankenstein of an automation pipeline combining public notices, county data and skip tracing so I can get the leads directly from the source and act on them as soon as they are available. Now I am realizing there are too many of them for me to personally execute on, but I also hate the idea of wasted opportunities.
How does an experienced investors actually scale their operations besides just hiring VAs? Does anyone have any experience partnering with different RE teams local to the lead? How are those deals / incentives usually structured?
Thanks in advance!
This is similar to what I'm doing out in Los Angeles. With your pipeline of off-markets, cherry-pick the best for yourself to close on, and on the rest, lock them up with a long inspection window, and make sure you have an option in the contract to Assign the deal to another buyer. Once the seller signs it, use your CRM to mass-contact investors/developers/flippers in that area (perhaps using your database/services in a different way to identify these LLCs/people) and sell them your contract with an assignment fee. This is called Wholesaling. You could also use a listing-only service from a brokerage where you'd pay them $200-$300 to list it on the MLS, and you/your team would take all incoming calls from interested buyers, but it's a bit slimy since the seller may see it listed on the market when you appeared to be buying it.
That would be the maximum value-capture of your off-market lead machine. It's infinitely harder and much more costly to scale a construction crew than it is to find people interested in buying a good deal (that you'll provide happily). Sure, you'll have to work the seller's down a bit to make it feasible for your buyer, but that's a heck of a lot easier than managing 50+ employees and or a bunch of subcontractors!
Post: Starting a wholesaling business
- Specialist
- LA & Ventura
- Posts 119
- Votes 60
Quote from @Melanie P.:
Quote from @Anthony Taylor:
I’m not sure you understand. I am closing deals myself. I want to build a team and a business. I want to automate my business so I can focus on another stream of income. I want to go from 8 hour days to 2-4 managing the business. I close deals myself I just want to learn how to automate my business and go from 30k a month to 100k+ lol
This is not consistent with what you wrote originally. I wish you luck getting started, but having an aversion to full-time work and pretending to be an expert prior to having done anything are not qualities that will help you succeed in business or life.
LMAO ur an animal Melanie!!
Post: Are you using projection models? (Here's why you should)
- Specialist
- LA & Ventura
- Posts 119
- Votes 60
Quote from @Leo R.:
For example, I've run models that showed me that a particular rehab wasn't going to produce the type of return I originally thought, and that I'd be better off dropping that capital on a different property in the portfolio...
My point was that you'd have to manually re-run your metrics (rent comps, sales values, refi rates, and rehab costs) on every property, every time you want to re-assess. For example, you'd have to see what the top-of-market rents are for your specific units/product, then update that in your model, add in the costs, and see if that increases your return metrics enough to be worthwhile. Then update the new sales comps, see what those are trading for on a $/sf, cap rate, and $/unit basis, and so on to make sure you are actually adding real value.
Why not just assess at the time of purchase? Do you own that many properties that are not at top-of-market rents/value? Every rental property we stabilize or flip we undertake is rehabbed immediately to the highest quality (like A+++ condition, just-renovated home for sale), so we wouldn't ever think of dumping more money into it once it's built/renovated. Either our investment strategies are just completely different, or I am just missing something here.
Separately, I concur on your thinking "it's more about improving my understanding of what COULD happen, not necessarily what WILL happen." Here's what is to the right of my MF hold model, I call it Risk Analysis, and it is auto-generated based on the metrics in the completed A&D model I previously replied with:
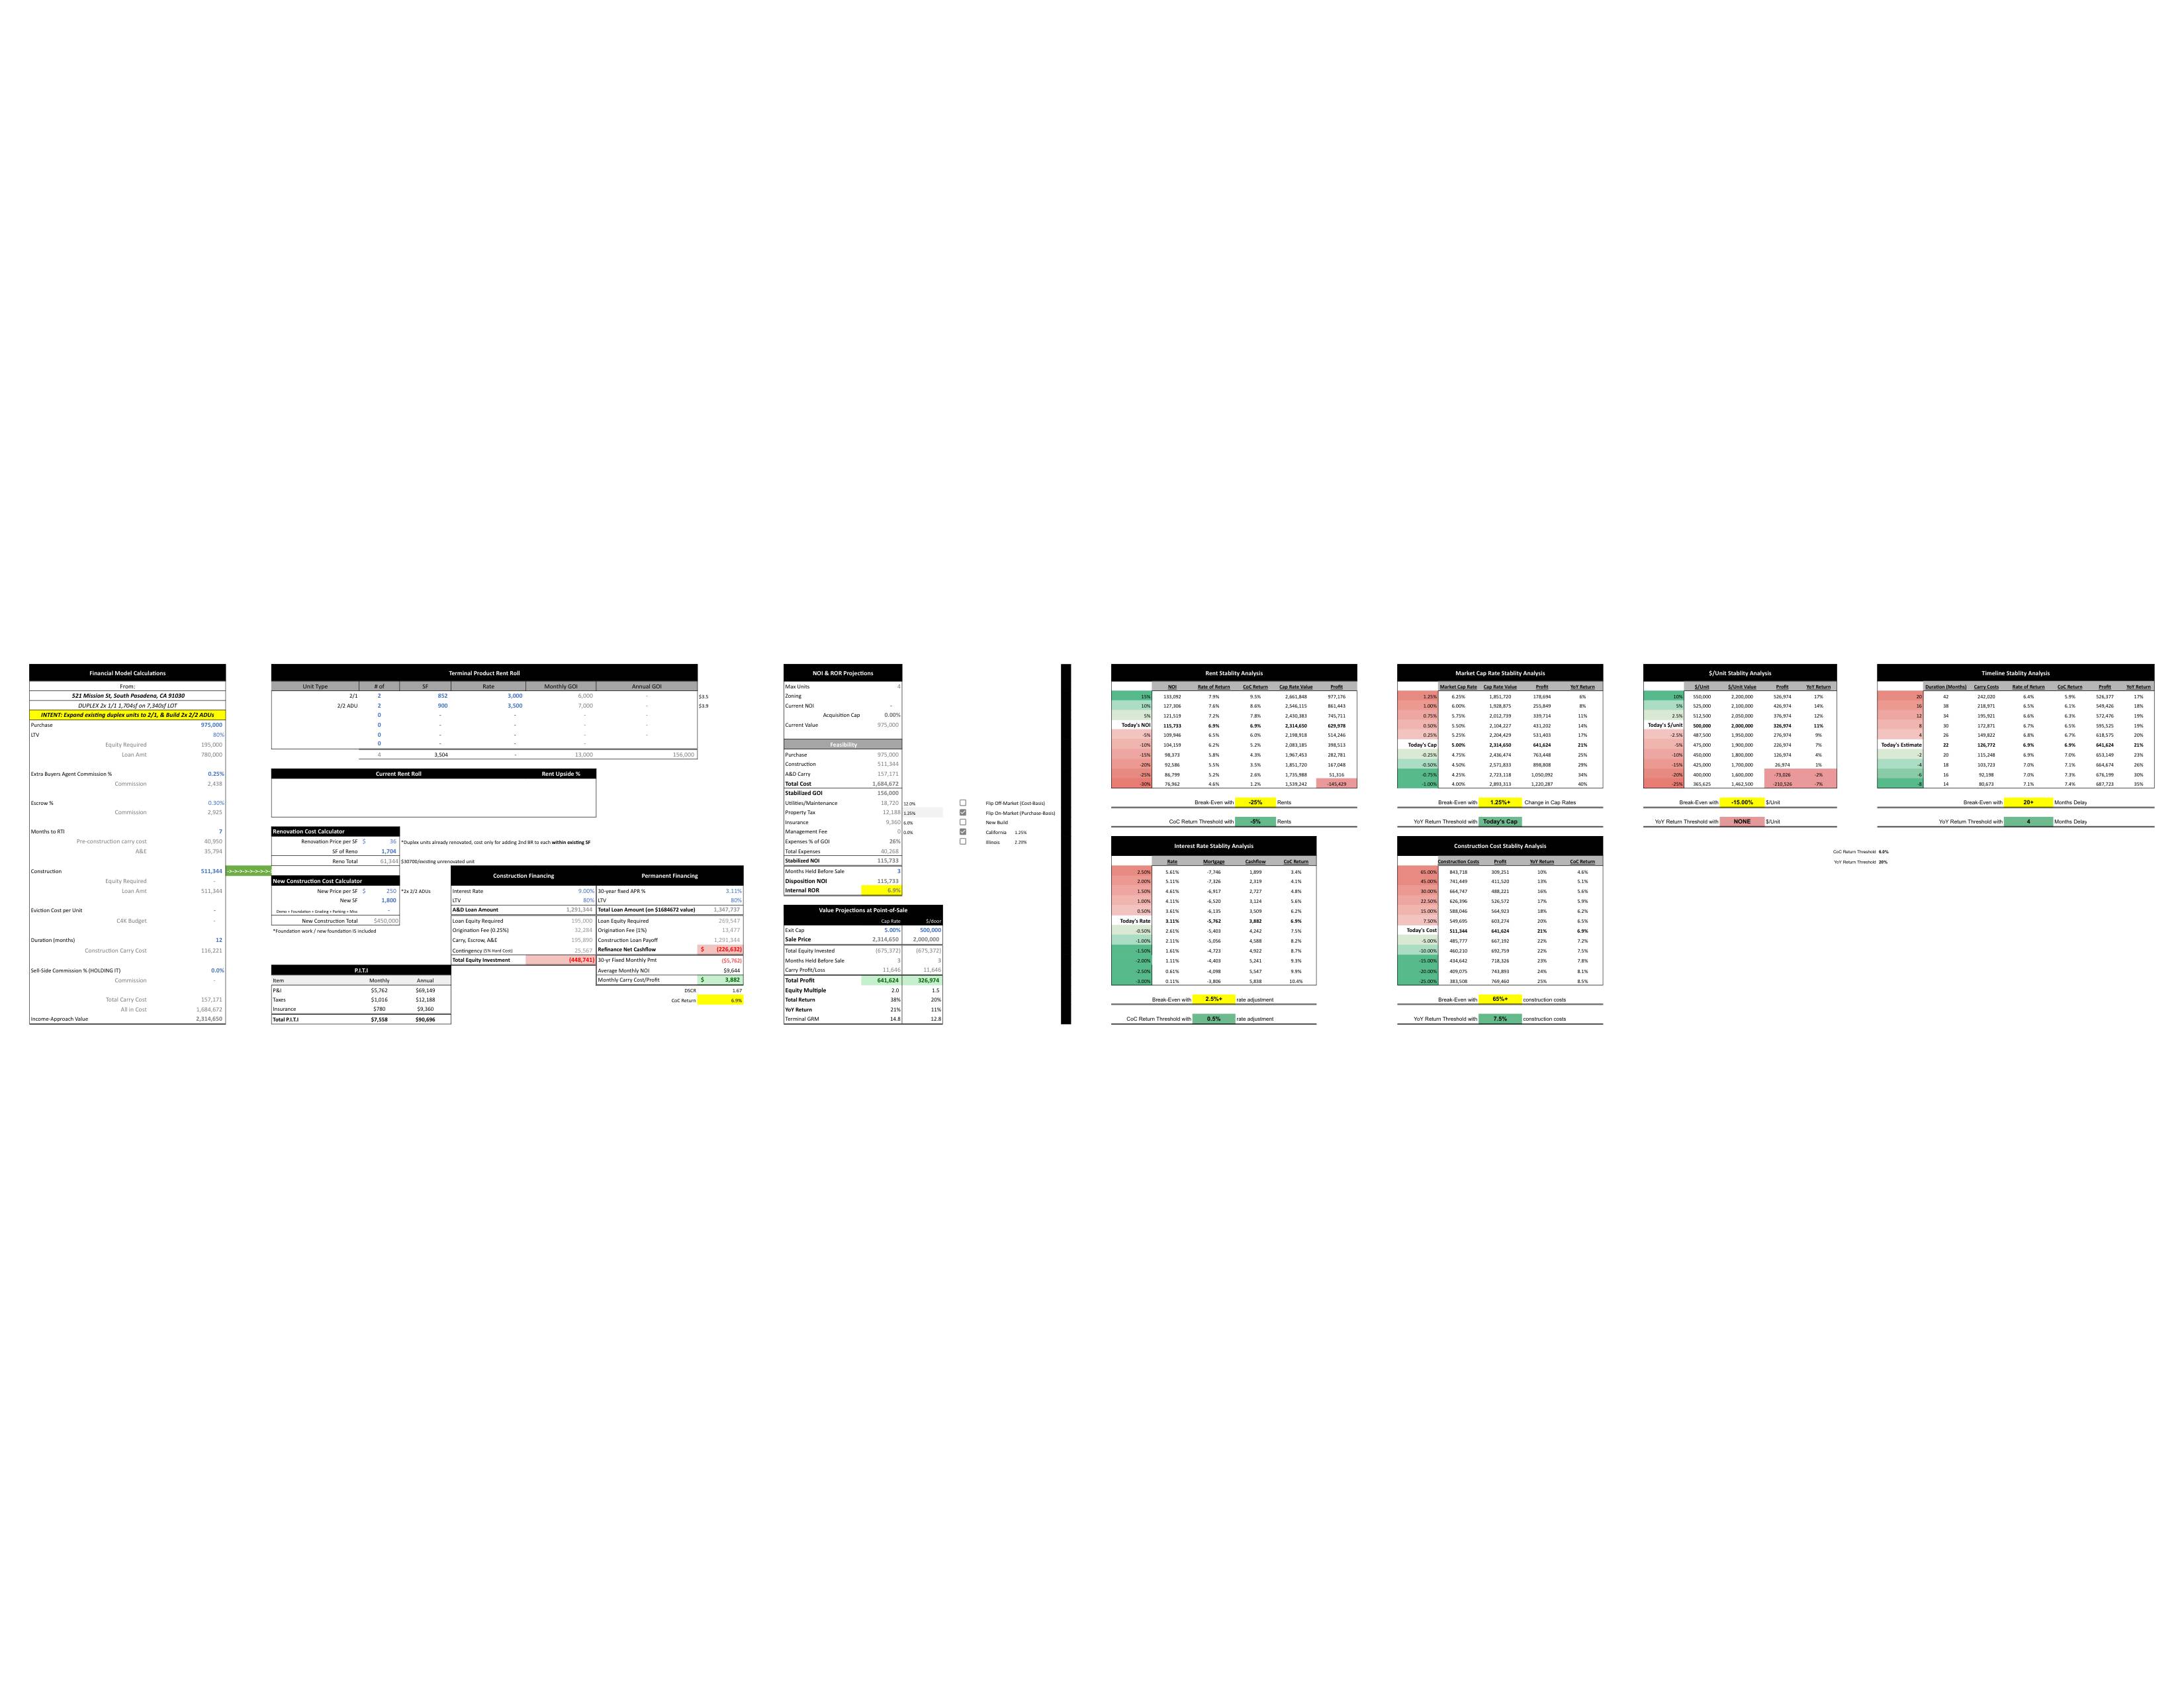
This shows me how the deal will pan out should a variety of key-metrics change on me during the project (zoom in to right-side of image above, not the model I sent previously).
Is this similar to what you are doing? This again is only useful to me at the point of purchase, to better visualize risks to the project while it is underway. For example, if I am about to offer $2M on one property projected to produce 10% CoC return, and $2M on another property projected to produce 10% CoC return, but HAD to choose 1, I would go with the more risk-adverse deal as indicated by these metrics.