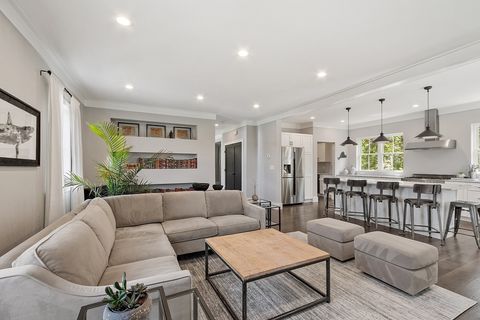
01810 Investment Properties for Sale
Browse homes for sale and investment properties in 01810. Refine your search by price, property type, or more.
Best cash flowing properties in 01810
Active
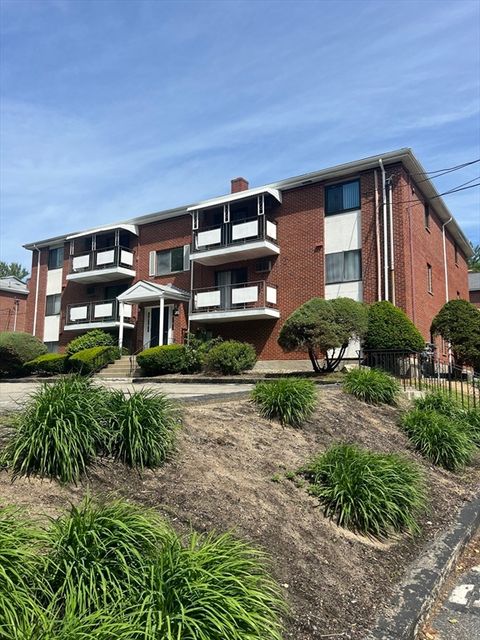
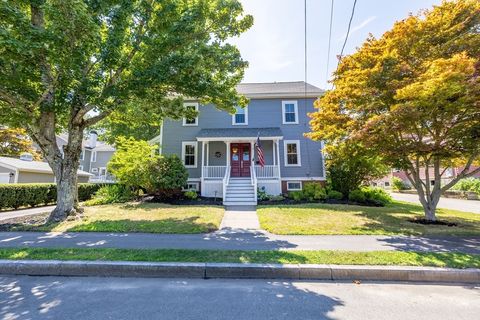
$269,000
1
bds
|
1
ba
|
735
sqft
|
built
1973
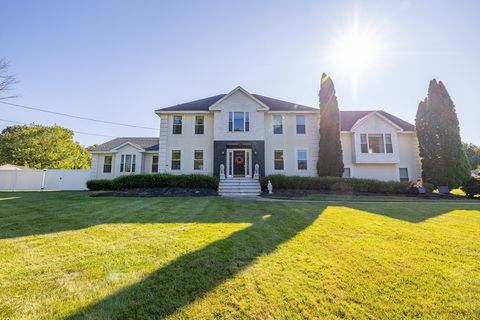
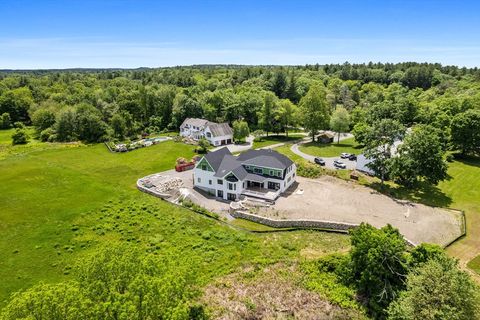
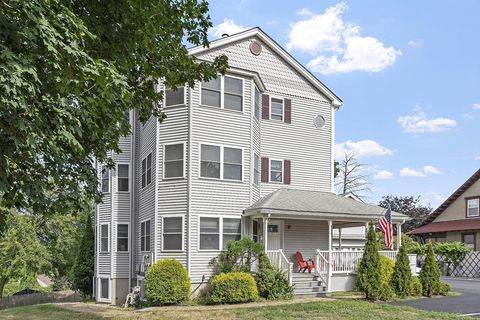
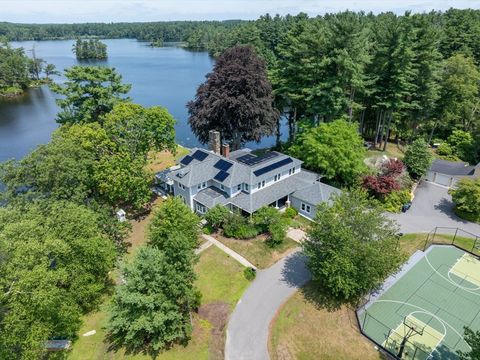
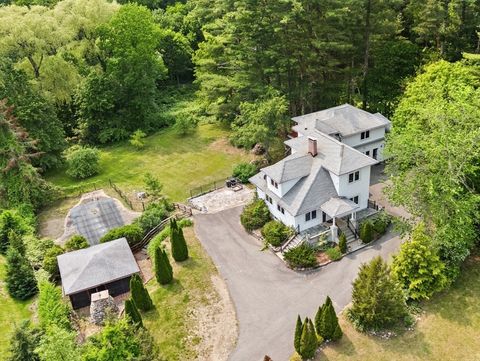
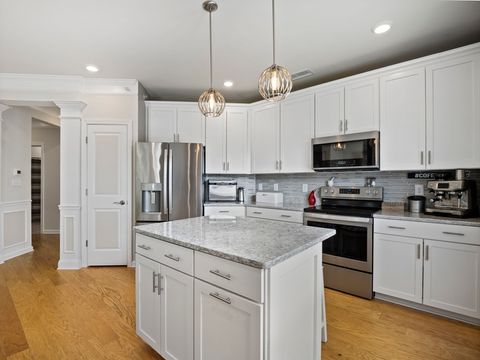
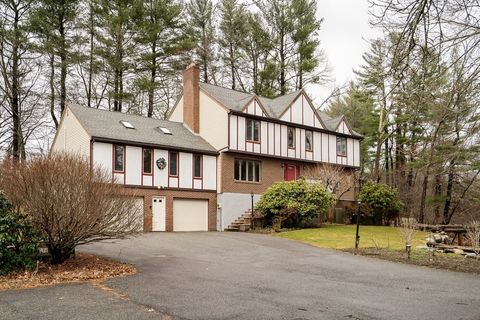
20 Colonial Dr, Andover, MA 01810
$-577
Cash flow
-11.2%
Cash-on-Cash Return
3.1%
Cap rate
0.8%
Rent to Value Ratio
Active
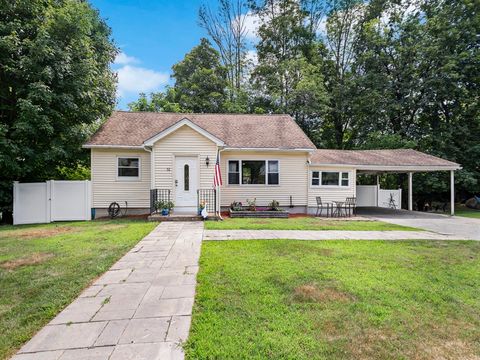
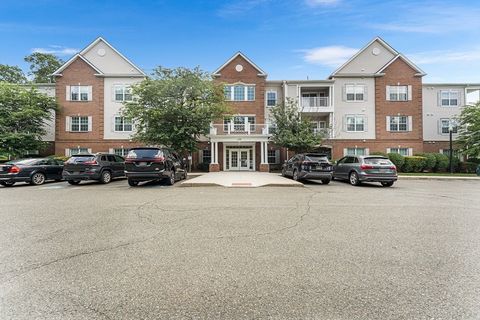
$565,444
3
bds
|
1
ba
|
1,296
sqft
|
built
1950
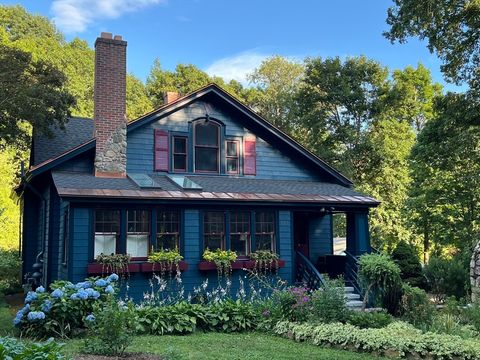
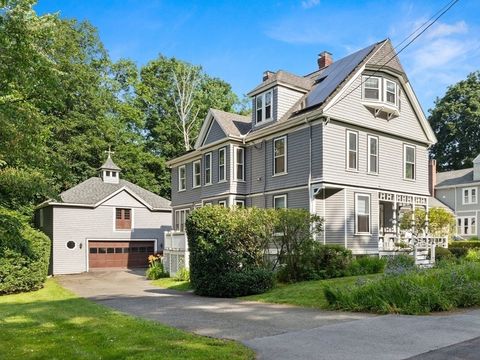
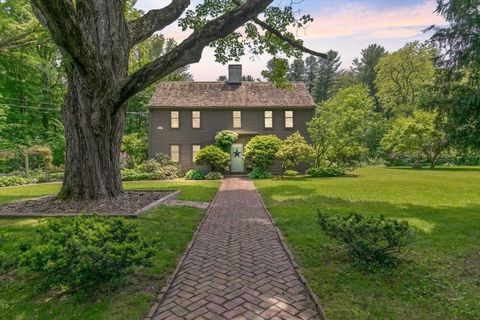
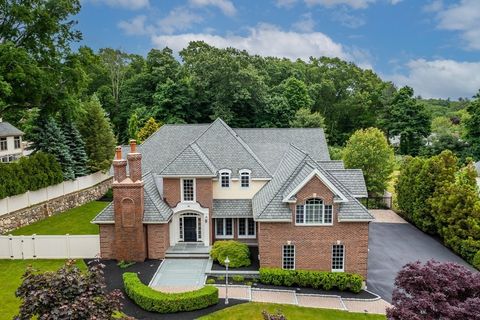
51 Dufton Rd, Andover, MA 01810
$-750
Cash flow
-6.9%
Cash-on-Cash Return
4.1%
Cap rate
0.6%
Rent to Value Ratio
29 out of 39 properties for sale in 01810
Limited Results Shown
Create a free account, or log in to reveal all property listings and enjoy the complete experience.
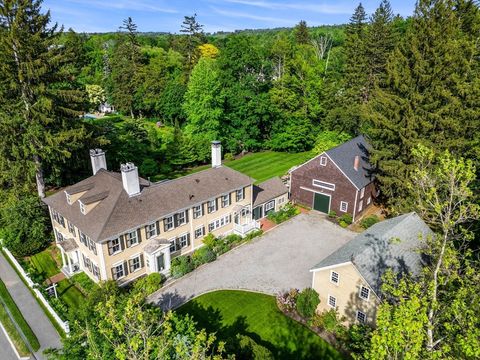
Active
$1,849,900
6
bds
|
6
ba
|
4,060
sqft
|
built
1992
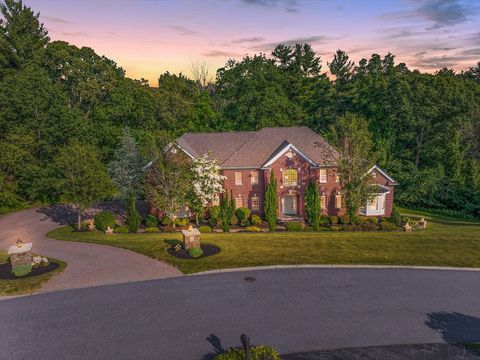
2 Nollet Dr, Andover, MA 01810
$-6,295
Cash flow
-17.8%
Cash-on-Cash Return
1.6%
Cap rate
0.3%
Rent to Value Ratio
Active
$1,750,000
4
bds
|
5
ba
|
4,973
sqft
|
built
2024
107 Reservation Rd, Andover, MA 01810
$-7,395
Cash flow
-22.0%
Cash-on-Cash Return
0.6%
Cap rate
0.2%
Rent to Value Ratio
Active
$549,900
2
bds
|
2
ba
|
1,084
sqft
|
built
2003
437 N Main St, Andover, MA 01810
$-1,137
Cash flow
-10.8%
Cash-on-Cash Return
3.2%
Cap rate
0.6%
Rent to Value Ratio
Active
$1,049,000
3
bds
|
2
ba
|
2,055
sqft
|
built
1922
177 Highland Rd, Andover, MA 01810
$-2,792
Cash flow
-13.9%
Cash-on-Cash Return
2.5%
Cap rate
0.4%
Rent to Value Ratio
Active
$679,900
3
bds
|
3
ba
|
1,959
sqft
|
built
1965
50 County Rd, Andover, MA 01810
$-1,124
Cash flow
-8.6%
Cash-on-Cash Return
3.7%
Cap rate
0.6%
Rent to Value Ratio
Active
$995,000
4
bds
|
3
ba
|
2,265
sqft
|
built
1949
48 High Plain Rd, Andover, MA 01810
$-2,135
Cash flow
-11.2%
Cash-on-Cash Return
3.1%
Cap rate
0.5%
Rent to Value Ratio
Active
$1,680,000
7
bds
|
7
ba
|
3,983
sqft
|
built
1886
31 Bartlet St, Andover, MA 01810
$-3,716
Cash flow
-11.5%
Cash-on-Cash Return
3.0%
Cap rate
0.5%
Rent to Value Ratio
Active
$575,000
2
bds
|
2
ba
|
1,400
sqft
|
built
2003
170 Haverhill St, Andover, MA 01810
$-1,691
Cash flow
-15.3%
Cash-on-Cash Return
2.1%
Cap rate
0.5%
Rent to Value Ratio
Active
$1,989,000
4
bds
|
5
ba
|
4,135
sqft
|
built
1996
11 Scotland Dr, Andover, MA 01810
$-6,711
Cash flow
-17.6%
Cash-on-Cash Return
1.6%
Cap rate
0.3%
Rent to Value Ratio
Active
$1,035,000
4
bds
|
3
ba
|
2,232
sqft
|
built
1870
11 Clark Rd, Andover, MA 01810
$-2,667
Cash flow
-13.4%
Cash-on-Cash Return
2.6%
Cap rate
0.4%
Rent to Value Ratio
Active
$2,499,000
5
bds
|
4
ba
|
5,187
sqft
|
built
1920
15 Geneva Rd, Andover, MA 01810
$-8,903
Cash flow
-18.6%
Cash-on-Cash Return
1.4%
Cap rate
0.3%
Rent to Value Ratio
Active
$1,390,000
5
bds
|
4
ba
|
3,825
sqft
|
built
1974
24 Enfield Dr, Andover, MA 01810
$-4,200
Cash flow
-15.8%
Cash-on-Cash Return
2.1%
Cap rate
0.4%
Rent to Value Ratio
Active
$2,495,000
5
bds
|
6
ba
|
9,459
sqft
|
built
2003
2 Regency Rdg, Andover, MA 01810
$-10,207
Cash flow
-21.3%
Cash-on-Cash Return
0.8%
Cap rate
0.3%
Rent to Value Ratio
Active
$1,149,900
5
bds
|
3
ba
|
2,861
sqft
|
built
1900
47 Abbot St, Andover, MA 01810
$-2,908
Cash flow
-13.2%
Cash-on-Cash Return
2.6%
Cap rate
0.5%
Rent to Value Ratio
Active
$1,375,000
5
bds
|
4
ba
|
3,897
sqft
|
built
2016
166 Greenwood Rd, Andover, MA 01810
$-5,549
Cash flow
-21.1%
Cash-on-Cash Return
0.8%
Cap rate
0.2%
Rent to Value Ratio
Active
$899,900
6
bds
|
4
ba
|
3,322
sqft
|
built
1908
497 S Main St, Andover, MA 01810
$-1,928
Cash flow
-11.2%
Cash-on-Cash Return
3.1%
Cap rate
0.5%
Rent to Value Ratio
Active
$1,500,000
5
bds
|
3
ba
|
3,460
sqft
|
built
1717
88 Central St, Andover, MA 01810
$-4,135
Cash flow
-14.4%
Cash-on-Cash Return
2.4%
Cap rate
0.4%
Rent to Value Ratio
Active
$995,000
3
bds
|
3
ba
|
2,464
sqft
|
built
1949
79 Cheever Cir, Andover, MA 01810
$-2,554
Cash flow
-13.4%
Cash-on-Cash Return
2.6%
Cap rate
0.5%
Rent to Value Ratio

Active
$2,895,000
5
bds
|
6
ba
|
7,919
sqft
|
built
1995
59 William St, Andover, MA 01810
$-8,935
Cash flow
-16.1%
Cash-on-Cash Return
2.0%
Cap rate
0.4%
Rent to Value Ratio
Active
$649,900
2
bds
|
2
ba
|
1,500
sqft
|
built
2018
4 Francis Dr, Andover, MA 01810
$-2,128
Cash flow
-17.1%
Cash-on-Cash Return
1.8%
Cap rate
0.5%
Rent to Value Ratio
Active
$2,599,900
5
bds
|
6
ba
|
6,176
sqft
|
built
2001
46 Porter Rd, Andover, MA 01810
$-7,645
Cash flow
-15.3%
Cash-on-Cash Return
2.2%
Cap rate
0.4%
Rent to Value Ratio
Active
$2,495,000
5
bds
|
7
ba
|
6,814
sqft
|
built
1998
3 West Holw, Andover, MA 01810
$-6,413
Cash flow
-13.4%
Cash-on-Cash Return
2.6%
Cap rate
0.4%
Rent to Value Ratio
Active
$2,799,000
4
bds
|
5
ba
|
5,407
sqft
|
built
1795
53 Salem St, Andover, MA 01810
$-8,799
Cash flow
-16.4%
Cash-on-Cash Return
1.9%
Cap rate
0.4%
Rent to Value Ratio
Active
$1,349,000
4
bds
|
3
ba
|
4,606
sqft
|
built
1985
21 Orchard Xing, Andover, MA 01810
$-2,197
Cash flow
-8.5%
Cash-on-Cash Return
3.7%
Cap rate
0.6%
Rent to Value Ratio
Active
$2,895,000
5
bds
|
6
ba
|
5,150
sqft
|
built
1796
56 Central St, Andover, MA 01810
$-8,252
Cash flow
-14.9%
Cash-on-Cash Return
2.3%
Cap rate
0.4%
Rent to Value Ratio
Active
$1,899,000
4
bds
|
3
ba
|
3,042
sqft
|
built
2024
14 Geneva Rd, Andover, MA 01810
$-5,329
Cash flow
-14.6%
Cash-on-Cash Return
2.3%
Cap rate
0.3%
Rent to Value Ratio

Active
$609,999
3
bds
|
2
ba
|
1,682
sqft
|
built
1956
347 Lowell St, Andover, MA 01810
$-946
Cash flow
-8.1%
Cash-on-Cash Return
3.8%
Cap rate
0.6%
Rent to Value Ratio