33019 Investment Properties for Sale
Browse homes for sale and investment properties in 33019. Refine your search by price, property type, or more.
Best cash flowing properties in 33019
Active
$299,000
1
bds
|
1
ba
|
363
sqft
|
built
2018
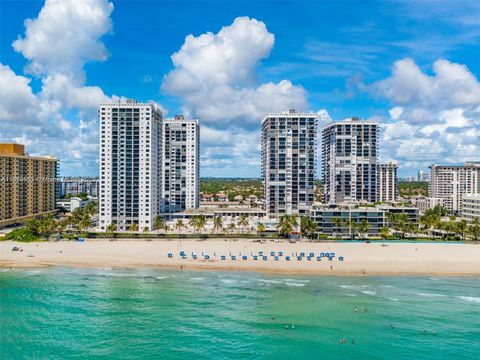
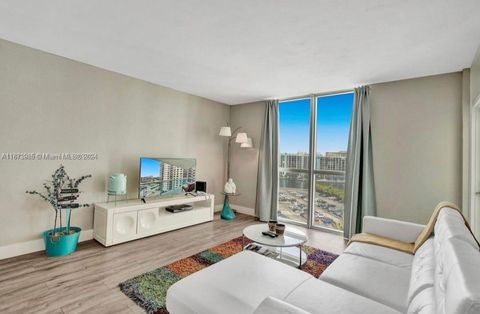
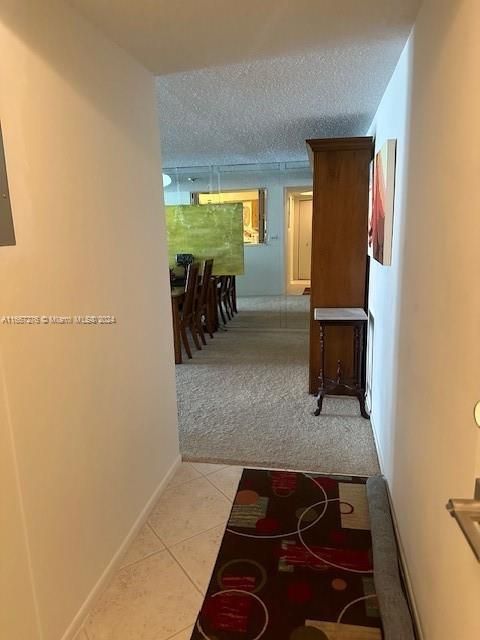
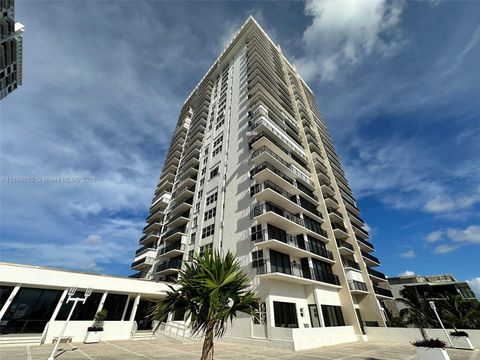
777 N Ocean Dr, Hollywood, FL 33019
$-861
Cash flow
-15.0%
Cash-on-Cash Return
2.7%
Cap rate
0.9%
Rent to Value Ratio
Active
$299,000
1
bds
|
1
ba
|
363
sqft
|
built
2018
777 N Ocean Dr, Hollywood, FL 33019
$-930
Cash flow
-16.2%
Cash-on-Cash Return
2.4%
Cap rate
0.8%
Rent to Value Ratio
433 out of 540 properties for sale in 33019
Limited Results Shown
Create a free account, or log in to reveal all property listings and enjoy the complete experience.

Active
$295,000
2
bds
|
2
ba
|
1,262
sqft
|
built
1971
1600 S Ocean Dr, Hollywood, FL 33019
$-1,111
Cash flow
-19.6%
Cash-on-Cash Return
1.6%
Cap rate
1.2%
Rent to Value Ratio
Active
$499,777
2
bds
|
2
ba
|
1,221
sqft
|
built
1973
1500 S Ocean Dr, Hollywood, FL 33019
$-2,640
Cash flow
-27.6%
Cash-on-Cash Return
-0.2%
Cap rate
0.6%
Rent to Value Ratio

Active
$384,900
1
bds
|
1
ba
|
874
sqft
|
built
1969
3901 S Ocean Dr, Hollywood, FL 33019
$-1,830
Cash flow
-24.8%
Cash-on-Cash Return
0.4%
Cap rate
0.7%
Rent to Value Ratio
Active
$425,000
3
bds
|
2
ba
|
1,553
sqft
|
built
1973
3800 S Ocean Dr, Hollywood, FL 33019
$-2,111
Cash flow
-25.9%
Cash-on-Cash Return
0.2%
Cap rate
0.8%
Rent to Value Ratio

Active
$1,749,000
2
bds
|
3
ba
|
2,267
sqft
|
built
2006
3535 S Ocean Dr, Hollywood, FL 33019
$-8,464
Cash flow
-25.2%
Cash-on-Cash Return
0.3%
Cap rate
0.5%
Rent to Value Ratio
Active
$295,000
1
bds
|
2
ba
|
832
sqft
|
built
1971
1600 S Ocean Dr, Hollywood, FL 33019
$-1,626
Cash flow
-28.8%
Cash-on-Cash Return
-0.5%
Cap rate
0.8%
Rent to Value Ratio
Active
$449,999
2
bds
|
2
ba
|
1,460
sqft
|
built
1968
1701 S Ocean Dr, Hollywood, FL 33019
$-1,715
Cash flow
-19.9%
Cash-on-Cash Return
1.6%
Cap rate
0.8%
Rent to Value Ratio
Active
$500,000
1
bds
|
1
ba
|
874
sqft
|
built
1969
3801 S Ocean Dr, Hollywood, FL 33019
$-2,116
Cash flow
-22.1%
Cash-on-Cash Return
1.1%
Cap rate
0.6%
Rent to Value Ratio
Active
$450,000
1
bds
|
2
ba
|
905
sqft
|
built
1963
4001 S Ocean Dr, Hollywood, FL 33019
$-2,044
Cash flow
-23.7%
Cash-on-Cash Return
0.7%
Cap rate
0.8%
Rent to Value Ratio

Active
$420,000
2
bds
|
2
ba
|
1,252
sqft
|
built
1969
1400 S Ocean Dr, Hollywood, FL 33019
$-1,530
Cash flow
-19.0%
Cash-on-Cash Return
1.8%
Cap rate
0.7%
Rent to Value Ratio
Active
$547,500
2
bds
|
2
ba
|
1,400
sqft
|
built
1980
2401 S Ocean Dr, Hollywood, FL 33019
$-2,294
Cash flow
-21.9%
Cash-on-Cash Return
1.1%
Cap rate
0.7%
Rent to Value Ratio

Active
$6,500,000
bds
|
0
ba
|
8,240
sqft
|
built
1979
2205 N Surf Rd, Hollywood, FL 33019
$-37,285
Cash flow
-29.9%
Cash-on-Cash Return
-0.7%
Cap rate
0.1%
Rent to Value Ratio
Active
$650,000
2
bds
|
2
ba
|
1,173
sqft
|
built
1969
3801 S Ocean Dr, Hollywood, FL 33019
$-2,091
Cash flow
-16.8%
Cash-on-Cash Return
2.3%
Cap rate
0.8%
Rent to Value Ratio

Active
$760,000
2
bds
|
2
ba
|
1,055
sqft
|
built
2019
4010 S Ocean Dr, Hollywood, FL 33019
$-3,139
Cash flow
-21.5%
Cash-on-Cash Return
1.2%
Cap rate
0.7%
Rent to Value Ratio

Active
$503,000
2
bds
|
2
ba
|
1,270
sqft
|
built
1973
3800 S Ocean Dr, Hollywood, FL 33019
$-2,044
Cash flow
-21.2%
Cash-on-Cash Return
1.3%
Cap rate
0.7%
Rent to Value Ratio

Active
$399,000
2
bds
|
2
ba
|
1,202
sqft
|
built
1973
3800 S Ocean Dr, Hollywood, FL 33019
$-1,624
Cash flow
-21.2%
Cash-on-Cash Return
1.3%
Cap rate
0.7%
Rent to Value Ratio
Active
$439,000
2
bds
|
2
ba
|
1,240
sqft
|
built
1978
2301 S Ocean Dr, Hollywood, FL 33019
$-2,253
Cash flow
-26.8%
Cash-on-Cash Return
0.0%
Cap rate
0.7%
Rent to Value Ratio
Active
$635,000
2
bds
|
2
ba
|
1,050
sqft
|
built
1974
2201 S Ocean Dr, Hollywood, FL 33019
$-1,803
Cash flow
-14.8%
Cash-on-Cash Return
2.7%
Cap rate
0.7%
Rent to Value Ratio

Active
$384,000
1
bds
|
1
ba
|
724
sqft
|
built
2017
777 N Ocean Dr, Hollywood, FL 33019
$-1,674
Cash flow
-22.7%
Cash-on-Cash Return
0.9%
Cap rate
0.8%
Rent to Value Ratio
Active
$1,449,000
3
bds
|
4
ba
|
2,857
sqft
|
built
2006
3535 S Ocean Dr, Hollywood, FL 33019
$-7,154
Cash flow
-25.8%
Cash-on-Cash Return
0.2%
Cap rate
0.6%
Rent to Value Ratio

Active
$393,000
2
bds
|
2
ba
|
1,334
sqft
|
built
1973
3800 S Ocean Dr, Hollywood, FL 33019
$-1,434
Cash flow
-19.0%
Cash-on-Cash Return
1.8%
Cap rate
0.8%
Rent to Value Ratio

Active
$532,000
2
bds
|
2
ba
|
1,334
sqft
|
built
1973
3800 S Ocean Dr, Hollywood, FL 33019
$-1,765
Cash flow
-17.3%
Cash-on-Cash Return
2.2%
Cap rate
0.7%
Rent to Value Ratio

Active
$550,000
2
bds
|
2
ba
|
1,333
sqft
|
built
1973
3800 S Ocean Dr, Hollywood, FL 33019
$-2,288
Cash flow
-21.7%
Cash-on-Cash Return
1.2%
Cap rate
0.6%
Rent to Value Ratio

Active
$580,000
1
bds
|
1
ba
|
874
sqft
|
built
1969
3801 S Ocean Dr, Hollywood, FL 33019
$-2,235
Cash flow
-20.1%
Cash-on-Cash Return
1.5%
Cap rate
0.6%
Rent to Value Ratio

Active
$700,000
2
bds
|
2
ba
|
1,570
sqft
|
built
1982
1201 S Ocean Dr, Hollywood, FL 33019
$-3,440
Cash flow
-25.6%
Cash-on-Cash Return
0.3%
Cap rate
0.6%
Rent to Value Ratio

Active
$799,000
2
bds
|
2
ba
|
1,055
sqft
|
built
2019
4010 S Ocean Dr, Hollywood, FL 33019
$-2,221
Cash flow
-14.5%
Cash-on-Cash Return
2.8%
Cap rate
0.9%
Rent to Value Ratio

Active
$390,000
1
bds
|
1
ba
|
874
sqft
|
built
1969
3901 S Ocean Dr, Hollywood, FL 33019
$-1,719
Cash flow
-23.0%
Cash-on-Cash Return
0.9%
Cap rate
0.6%
Rent to Value Ratio

Active
$380,000
2
bds
|
2
ba
|
1,291
sqft
|
built
1973
3800 S Ocean Dr, Hollywood, FL 33019
$-2,082
Cash flow
-28.6%
Cash-on-Cash Return
-0.4%
Cap rate
0.6%
Rent to Value Ratio

Active
$469,000
1
bds
|
1
ba
|
874
sqft
|
built
1969
3801 S Ocean Dr, Hollywood, FL 33019
$-2,306
Cash flow
-25.7%
Cash-on-Cash Return
0.2%
Cap rate
0.6%
Rent to Value Ratio

Active
$600,000
1
bds
|
1
ba
|
435
sqft
|
built
1939
1908 N Ocean Dr, Hollywood, FL 33019
$-2,677
Cash flow
-23.3%
Cash-on-Cash Return
0.8%
Cap rate
0.3%
Rent to Value Ratio

Active
$440,000
2
bds
|
2
ba
|
1,110
sqft
|
built
1964
3505 S Ocean Dr, Hollywood, FL 33019
$-1,766
Cash flow
-20.9%
Cash-on-Cash Return
1.3%
Cap rate
0.7%
Rent to Value Ratio
Active
$2,290,000
3
bds
|
3
ba
|
2,088
sqft
|
built
2009
2711 S Ocean Dr, Hollywood, FL 33019
$-9,036
Cash flow
-20.6%
Cash-on-Cash Return
1.4%
Cap rate
0.4%
Rent to Value Ratio
Active
$2,100,000
3
bds
|
3
ba
|
2,193
sqft
|
built
2016
2101 S Surf Rd, Hollywood, FL 33019
$-10,351
Cash flow
-25.7%
Cash-on-Cash Return
0.2%
Cap rate
0.4%
Rent to Value Ratio

Active
$554,000
2
bds
|
2
ba
|
1,333
sqft
|
built
1973
3800 S Ocean Dr, Hollywood, FL 33019
$-2,510
Cash flow
-23.6%
Cash-on-Cash Return
0.7%
Cap rate
0.6%
Rent to Value Ratio

Active
$439,000
2
bds
|
2
ba
|
1,291
sqft
|
built
1973
3800 S Ocean Dr, Hollywood, FL 33019
$-1,995
Cash flow
-23.7%
Cash-on-Cash Return
0.7%
Cap rate
0.6%
Rent to Value Ratio

Active
$598,500
2
bds
|
2
ba
|
1,173
sqft
|
built
1969
3901 S Ocean Dr, Hollywood, FL 33019
$-2,421
Cash flow
-21.1%
Cash-on-Cash Return
1.3%
Cap rate
0.7%
Rent to Value Ratio

Active
$481,000
1
bds
|
1
ba
|
874
sqft
|
built
1969
3901 S Ocean Dr, Hollywood, FL 33019
$-1,924
Cash flow
-20.9%
Cash-on-Cash Return
1.3%
Cap rate
0.6%
Rent to Value Ratio
Active
$1,590,000
4
bds
|
4
ba
|
3,120
sqft
|
built
1950
1154 Jefferson St, Hollywood, FL 33019
$-3,293
Cash flow
-10.8%
Cash-on-Cash Return
3.7%
Cap rate
0.6%
Rent to Value Ratio