33132 Investment Properties for Sale
Browse homes for sale and investment properties in 33132. Refine your search by price, property type, or more.
Best cash flowing properties in 33132
Active
$550,000
2
bds
|
2
ba
|
1,048
sqft
|
built
2008
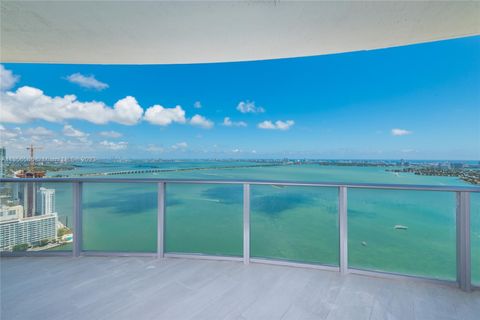
1750 N Bayshore Dr, Miami, FL 33132
$-936
Cash flow
-8.9%
Cash-on-Cash Return
4.1%
Cap rate
0.6%
Rent to Value Ratio
Active
$349,500
1
bds
|
1
ba
|
734
sqft
|
built
2005
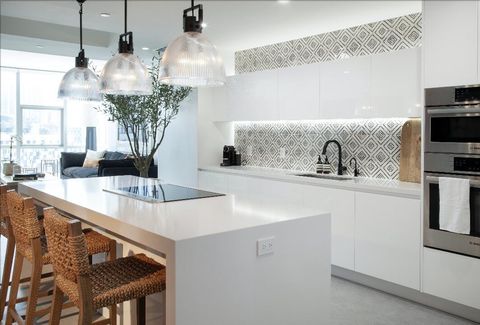
275 NE 18th St, Miami, FL 33132
$-1,141
Cash flow
-17.0%
Cash-on-Cash Return
2.2%
Cap rate
0.7%
Rent to Value Ratio
396 out of 477 properties for sale in 33132
Limited Results Shown
Create a free account, or log in to reveal all property listings and enjoy the complete experience.

Active
$344,500
1
bds
|
1
ba
|
825
sqft
|
built
2008
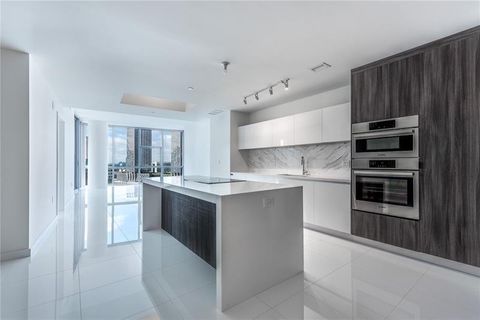
1750 N Bayshore Dr, Miami, FL 33132
$-1,733
Cash flow
-26.2%
Cash-on-Cash Return
0.1%
Cap rate
0.9%
Rent to Value Ratio
Active
$414,999
1
bds
|
1
ba
|
825
sqft
|
built
2008
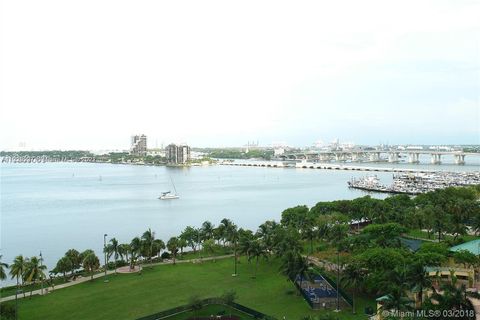
1750 N Bayshore Dr, Miami, FL 33132
$-1,748
Cash flow
-22.0%
Cash-on-Cash Return
1.1%
Cap rate
0.7%
Rent to Value Ratio
Active
$7,100,000
4
bds
|
6
ba
|
4,600
sqft
|
built
2019
1000 Biscayne Blvd, Miami, FL 33132
$-48,750
Cash flow
-35.8%
Cash-on-Cash Return
-2.1%
Cap rate
0.1%
Rent to Value Ratio
Active
$1,250,000
3
bds
|
3
ba
|
1,795
sqft
|
built
2008
253 NE 2nd St, Miami, FL 33132
$-5,764
Cash flow
-24.1%
Cash-on-Cash Return
0.6%
Cap rate
0.5%
Rent to Value Ratio
Active
$7,200,000
4
bds
|
6
ba
|
4,600
sqft
|
built
2019
1000 Biscayne Blvd, Miami, FL 33132
$-49,178
Cash flow
-35.6%
Cash-on-Cash Return
-2.0%
Cap rate
0.1%
Rent to Value Ratio
Active
$599,000
2
bds
|
2
ba
|
1,048
sqft
|
built
2007
1750 N Bayshore Dr, Miami, FL 33132
$-3,172
Cash flow
-27.6%
Cash-on-Cash Return
-0.2%
Cap rate
0.6%
Rent to Value Ratio
Active
$520,000
2
bds
|
2
ba
|
1,018
sqft
|
built
2018
1600 NE 1st Ave, Miami, FL 33132
$-1,687
Cash flow
-16.9%
Cash-on-Cash Return
2.3%
Cap rate
0.7%
Rent to Value Ratio
Active
$2,500,000
3
bds
|
4
ba
|
2,018
sqft
|
built
2018
488 NE 18th St, Miami, FL 33132
$-10,237
Cash flow
-21.4%
Cash-on-Cash Return
1.2%
Cap rate
0.4%
Rent to Value Ratio
Active
$490,000
2
bds
|
2
ba
|
1,048
sqft
|
built
2007
1750 N Bayshore Dr, Miami, FL 33132
$-2,431
Cash flow
-25.9%
Cash-on-Cash Return
0.2%
Cap rate
0.8%
Rent to Value Ratio
Active
$450,301
1
bds
|
1
ba
|
791
sqft
|
built
2008
1750 N Bayshore Dr, Miami, FL 33132
$-2,402
Cash flow
-27.8%
Cash-on-Cash Return
-0.3%
Cap rate
0.6%
Rent to Value Ratio
Active
$399,000
1
bds
|
1
ba
|
821
sqft
|
built
2007
1750 N Bayshore Dr, Miami, FL 33132
$-1,288
Cash flow
-16.8%
Cash-on-Cash Return
2.3%
Cap rate
1.0%
Rent to Value Ratio
Active
$574,698
2
bds
|
2
ba
|
1,048
sqft
|
built
2008
1750 N Bayshore Dr, Miami, FL 33132
$-2,826
Cash flow
-25.7%
Cash-on-Cash Return
0.2%
Cap rate
0.7%
Rent to Value Ratio
Active
$590,462
2
bds
|
2
ba
|
1,048
sqft
|
built
2008
1750 N Bayshore Dr, Miami, FL 33132
$-2,912
Cash flow
-25.7%
Cash-on-Cash Return
0.2%
Cap rate
0.7%
Rent to Value Ratio
Active
$310,045
bds
|
1
ba
|
508
sqft
|
built
2008
1750 N Bayshore Dr, Miami, FL 33132
$-1,436
Cash flow
-24.2%
Cash-on-Cash Return
0.6%
Cap rate
0.7%
Rent to Value Ratio
Active
$6,200,000
4
bds
|
6
ba
|
4,600
sqft
|
built
2019
1000 Biscayne Blvd, Miami, FL 33132
$-43,962
Cash flow
-37.0%
Cash-on-Cash Return
-2.4%
Cap rate
0.1%
Rent to Value Ratio
Active
$350,000
1
bds
|
1
ba
|
763
sqft
|
built
2005
275 NE 18th St, Miami, FL 33132
$-1,285
Cash flow
-19.2%
Cash-on-Cash Return
1.7%
Cap rate
0.7%
Rent to Value Ratio
Active
$1,300,000
3
bds
|
4
ba
|
1,592
sqft
|
built
2018
488 NE 18th St, Miami, FL 33132
$-4,202
Cash flow
-16.9%
Cash-on-Cash Return
2.3%
Cap rate
0.6%
Rent to Value Ratio
Active
$620,000
bds
|
1
ba
|
357
sqft
|
built
2022
398 NE 5th St, Miami, FL 33132
$-1,368
Cash flow
-11.5%
Cash-on-Cash Return
3.5%
Cap rate
0.6%
Rent to Value Ratio
Active
$768,000
1
bds
|
2
ba
|
1,173
sqft
|
built
2019
851 NE 1st Ave, Miami, FL 33132
$-4,177
Cash flow
-28.4%
Cash-on-Cash Return
-0.4%
Cap rate
0.6%
Rent to Value Ratio
Active
$23,750,000
5
bds
|
7
ba
|
9,200
sqft
|
built
2019
1000 Biscayne Blvd, Miami, FL 33132
$-158,732
Cash flow
-34.9%
Cash-on-Cash Return
-1.9%
Cap rate
0.0%
Rent to Value Ratio
Active
$455,000
1
bds
|
1
ba
|
829
sqft
|
built
2008
1900 N Bayshore Dr, Miami, FL 33132
$-1,466
Cash flow
-16.8%
Cash-on-Cash Return
2.3%
Cap rate
0.7%
Rent to Value Ratio

Active
$745,000
1
bds
|
1
ba
|
443
sqft
|
built
2022
398 NE 5th St, Miami, FL 33132
$-1,905
Cash flow
-13.3%
Cash-on-Cash Return
3.1%
Cap rate
0.7%
Rent to Value Ratio
Active
$789,000
1
bds
|
3
ba
|
938
sqft
|
built
2008
900 Biscayne Blvd, Miami, FL 33132
$-2,039
Cash flow
-13.5%
Cash-on-Cash Return
3.0%
Cap rate
0.5%
Rent to Value Ratio
Active
$950,000
2
bds
|
3
ba
|
1,498
sqft
|
built
2009
1100 Biscayne Blvd, Miami, FL 33132
$-3,524
Cash flow
-19.4%
Cash-on-Cash Return
1.7%
Cap rate
0.6%
Rent to Value Ratio
Active
$750,000
2
bds
|
2
ba
|
1,256
sqft
|
built
2007
50 Biscayne Blvd, Miami, FL 33132
$-2,997
Cash flow
-20.8%
Cash-on-Cash Return
1.4%
Cap rate
0.6%
Rent to Value Ratio
Active
$958,800
1
bds
|
2
ba
|
665
sqft
|
built
2022
398 NE 5th St, Miami, FL 33132
$-1,643
Cash flow
-8.9%
Cash-on-Cash Return
4.1%
Cap rate
0.6%
Rent to Value Ratio
Active
$399,000
1
bds
|
2
ba
|
860
sqft
|
built
1980
555 NE 15th St, Miami, FL 33132
$-1,621
Cash flow
-21.2%
Cash-on-Cash Return
1.3%
Cap rate
0.7%
Rent to Value Ratio
Active
$679,000
1
bds
|
2
ba
|
937
sqft
|
built
2019
851 NE 1st St, Miami, FL 33132
$-1,805
Cash flow
-13.9%
Cash-on-Cash Return
3.0%
Cap rate
0.6%
Rent to Value Ratio
Active
$2,400,000
3
bds
|
4
ba
|
2,018
sqft
|
built
2018
488 NE 18th St, Miami, FL 33132
$-9,943
Cash flow
-21.6%
Cash-on-Cash Return
1.2%
Cap rate
0.4%
Rent to Value Ratio
Active
$1,975,000
3
bds
|
4
ba
|
2,321
sqft
|
built
2019
851 NE 1st Ave, Miami, FL 33132
$-7,243
Cash flow
-19.1%
Cash-on-Cash Return
1.7%
Cap rate
0.5%
Rent to Value Ratio
Active
$1,835,000
3
bds
|
4
ba
|
2,165
sqft
|
built
2019
851 NE 1st Ave, Miami, FL 33132
$-7,079
Cash flow
-20.1%
Cash-on-Cash Return
1.5%
Cap rate
0.5%
Rent to Value Ratio
Active
$689,000
2
bds
|
3
ba
|
1,162
sqft
|
built
2008
1900 N Bayshore Dr, Miami, FL 33132
$-2,149
Cash flow
-16.3%
Cash-on-Cash Return
2.4%
Cap rate
0.7%
Rent to Value Ratio
Active
$420,000
1
bds
|
1
ba
|
821
sqft
|
built
2007
1750 N Bayshore Dr, Miami, FL 33132
$-1,255
Cash flow
-15.6%
Cash-on-Cash Return
2.6%
Cap rate
0.7%
Rent to Value Ratio
Active
$2,599,900
3
bds
|
4
ba
|
2,365
sqft
|
built
2018
488 NE 18th St, Miami, FL 33132
$-11,224
Cash flow
-22.5%
Cash-on-Cash Return
1.0%
Cap rate
0.4%
Rent to Value Ratio