33141 Investment Properties for Sale
Browse homes for sale and investment properties in 33141. Refine your search by price, property type, or more.
Best cash flowing properties in 33141
Active
$259,000
1
bds
|
1
ba
|
519
sqft
|
built
1948
6767 Indian Creek Dr, Miami Beach, FL 33141
$-349
Cash flow
-7.0%
Cash-on-Cash Return
4.5%
Cap rate
0.8%
Rent to Value Ratio

Active
$175,000
0
bds
|
1
ba
|
445
sqft
|
built
1963
7904 West Dr, North Bay Village, FL 33141
$-446
Cash flow
-13.3%
Cash-on-Cash Return
3.1%
Cap rate
1.0%
Rent to Value Ratio
375 out of 417 properties for sale in 33141
Limited Results Shown
Create a free account, or log in to reveal all property listings and enjoy the complete experience.
Active
$312,000
2
bds
|
1
ba
|
860
sqft
|
built
1957
1265 Marseille Dr, Miami Beach, FL 33141
$-981
Cash flow
-16.4%
Cash-on-Cash Return
2.4%
Cap rate
0.8%
Rent to Value Ratio
Active
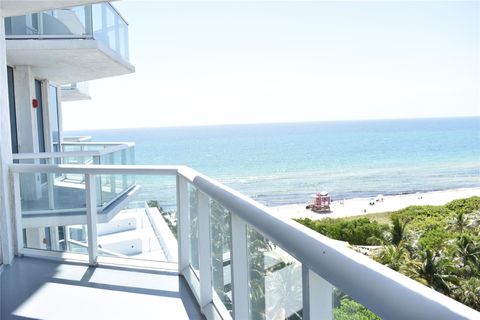
$1,625,000
2
bds
|
2
ba
|
1,128
sqft
|
built
2004
6515 Collins Ave, Miami Beach, FL 33141
$-6,639
Cash flow
-21.3%
Cash-on-Cash Return
1.2%
Cap rate
0.4%
Rent to Value Ratio
Active
$170,000
bds
|
1
ba
|
398
sqft
|
built
1963
7904 West Dr, North Bay Village, FL 33141
$-465
Cash flow
-14.3%
Cash-on-Cash Return
2.9%
Cap rate
1.0%
Rent to Value Ratio
Active
$259,000
1
bds
|
1
ba
|
750
sqft
|
built
1965
8000 Harding Ave, Miami Beach, FL 33141
$-523
Cash flow
-10.5%
Cash-on-Cash Return
3.7%
Cap rate
0.8%
Rent to Value Ratio
Active
$2,190,000
2
bds
|
2
ba
|
1,290
sqft
|
built
2008
6899 Collins Ave, Miami Beach, FL 33141
$-11,100
Cash flow
-26.4%
Cash-on-Cash Return
0.1%
Cap rate
0.4%
Rent to Value Ratio
Active
$269,000
1
bds
|
2
ba
|
780
sqft
|
built
1973
6900 Bay Dr, Miami Beach, FL 33141
$-859
Cash flow
-16.7%
Cash-on-Cash Return
2.3%
Cap rate
0.9%
Rent to Value Ratio
Active
$260,000
1
bds
|
1
ba
|
827
sqft
|
built
1966
1455 N Treasure Dr, North Bay Village, FL 33141
$-1,009
Cash flow
-20.2%
Cash-on-Cash Return
1.5%
Cap rate
0.8%
Rent to Value Ratio
Active
$9,950,000
5
bds
|
6
ba
|
4,473
sqft
|
built
2016
1825 Cleveland Rd, Miami Beach, FL 33141
$-51,137
Cash flow
-26.8%
Cash-on-Cash Return
0.0%
Cap rate
0.1%
Rent to Value Ratio
Active
$1,599,000
bds
|
0
ba
|
4,429
sqft
|
built
1947
8031 Hawthorne Ave, Miami Beach, FL 33141
$-8,166
Cash flow
-26.6%
Cash-on-Cash Return
0.0%
Cap rate
0.1%
Rent to Value Ratio
Active
$335,000
1
bds
|
1
ba
|
750
sqft
|
built
1965
8000 Harding Ave, Miami Beach, FL 33141
$-666
Cash flow
-10.4%
Cash-on-Cash Return
3.8%
Cap rate
0.7%
Rent to Value Ratio
Active
$369,000
2
bds
|
2
ba
|
1,130
sqft
|
built
1965
7501 E Treasure Dr, North Bay Village, FL 33141
$-1,329
Cash flow
-18.8%
Cash-on-Cash Return
1.8%
Cap rate
0.8%
Rent to Value Ratio
Active
$342,500
1
bds
|
1
ba
|
697
sqft
|
built
1948
6767 Indian Creek Dr, Miami Beach, FL 33141
$-756
Cash flow
-11.5%
Cash-on-Cash Return
3.5%
Cap rate
0.7%
Rent to Value Ratio
Active
$449,000
2
bds
|
3
ba
|
1,170
sqft
|
built
1973
6900 Bay Dr, Miami Beach, FL 33141
$-1,994
Cash flow
-23.2%
Cash-on-Cash Return
0.8%
Cap rate
0.6%
Rent to Value Ratio
Active
$2,225,000
2
bds
|
2
ba
|
1,290
sqft
|
built
2008
6899 Collins Ave, Miami Beach, FL 33141
$-6,748
Cash flow
-15.8%
Cash-on-Cash Return
2.5%
Cap rate
0.4%
Rent to Value Ratio
Active
$253,000
1
bds
|
1
ba
|
763
sqft
|
built
1955
350 75th St, Miami Beach, FL 33141
$-521
Cash flow
-10.7%
Cash-on-Cash Return
3.7%
Cap rate
0.9%
Rent to Value Ratio
Active
$1,100,000
3
bds
|
2
ba
|
1,579
sqft
|
built
1950
7528 Hispanola Ave, North Bay Village, FL 33141
$-2,127
Cash flow
-10.1%
Cash-on-Cash Return
3.8%
Cap rate
0.5%
Rent to Value Ratio
Active
$1,695,000
4
bds
|
3
ba
|
1,760
sqft
|
built
1939
1221 Biarritz Dr, Miami Beach, FL 33141
$-5,504
Cash flow
-16.9%
Cash-on-Cash Return
2.3%
Cap rate
0.4%
Rent to Value Ratio
Active
$492,000
1
bds
|
2
ba
|
857
sqft
|
built
2004
7600 Collins Ave, Miami Beach, FL 33141
$-1,250
Cash flow
-13.3%
Cash-on-Cash Return
3.1%
Cap rate
0.7%
Rent to Value Ratio
Active
$890,000
2
bds
|
2
ba
|
942
sqft
|
built
2013
6700 Indian Creek Dr, Miami Beach, FL 33141
$-4,118
Cash flow
-24.1%
Cash-on-Cash Return
0.6%
Cap rate
0.6%
Rent to Value Ratio
Active
$649,000
1
bds
|
2
ba
|
1,133
sqft
|
built
1963
900 Bay Dr, Miami Beach, FL 33141
$-2,906
Cash flow
-23.4%
Cash-on-Cash Return
0.8%
Cap rate
0.5%
Rent to Value Ratio
Active
$275,900
1
bds
|
1
ba
|
940
sqft
|
built
1952
1865 79th Street Cswy, North Bay Village, FL 33141
$-1,327
Cash flow
-25.1%
Cash-on-Cash Return
0.4%
Cap rate
0.7%
Rent to Value Ratio
Active
$1,250,000
6
bds
|
0
ba
|
3,425
sqft
|
built
1951
7710 Carlyle Ave, Miami Beach, FL 33141
$-4,325
Cash flow
-18.1%
Cash-on-Cash Return
2.0%
Cap rate
0.4%
Rent to Value Ratio
Active
$1,100,000
4
bds
|
3
ba
|
0
sqft
|
built
1951
7517 Hispanola Ave, North Bay Village, FL 33141
$-2,580
Cash flow
-12.2%
Cash-on-Cash Return
3.3%
Cap rate
0.6%
Rent to Value Ratio
Active
$549,900
2
bds
|
2
ba
|
1,030
sqft
|
built
1987
7601 E Treasure Dr, North Bay Village, FL 33141
$-2,068
Cash flow
-19.6%
Cash-on-Cash Return
1.6%
Cap rate
0.6%
Rent to Value Ratio
Active
$453,000
2
bds
|
2
ba
|
984
sqft
|
built
2003
1625 Kennedy Cswy, North Bay Village, FL 33141
$-1,541
Cash flow
-17.7%
Cash-on-Cash Return
2.1%
Cap rate
0.7%
Rent to Value Ratio
Active
$259,000
2
bds
|
2
ba
|
900
sqft
|
built
1972
1801 S Treasure Dr, North Bay Village, FL 33141
$-892
Cash flow
-18.0%
Cash-on-Cash Return
2.0%
Cap rate
0.9%
Rent to Value Ratio
Active
$595,000
1
bds
|
1
ba
|
662
sqft
|
built
2008
6801 Collins Ave, Miami Beach, FL 33141
$-1,612
Cash flow
-14.1%
Cash-on-Cash Return
2.9%
Cap rate
1.1%
Rent to Value Ratio
Active
$499,000
1
bds
|
1
ba
|
614
sqft
|
built
2016
6620 Indian Creek Dr, Miami Beach, FL 33141
$-2,030
Cash flow
-21.2%
Cash-on-Cash Return
1.3%
Cap rate
0.6%
Rent to Value Ratio
Active
$275,000
2
bds
|
2
ba
|
845
sqft
|
built
1940
1016 71st St, Miami Beach, FL 33141
$-951
Cash flow
-18.0%
Cash-on-Cash Return
2.0%
Cap rate
0.9%
Rent to Value Ratio
Active
$998,000
2
bds
|
2
ba
|
1,097
sqft
|
built
2004
6515 Collins Ave, Miami Beach, FL 33141
$-5,175
Cash flow
-27.1%
Cash-on-Cash Return
-0.1%
Cap rate
0.5%
Rent to Value Ratio
Active
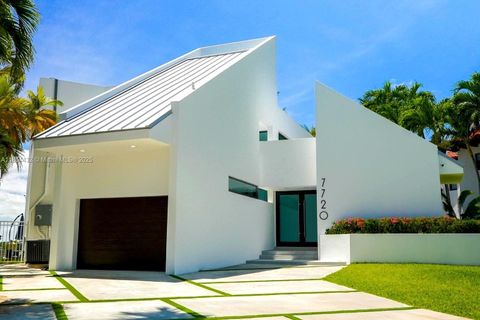
$9,799,000
5
bds
|
4
ba
|
3,758
sqft
|
built
1981
7720 Miami View Dr, North Bay Village, FL 33141
$-49,593
Cash flow
-26.4%
Cash-on-Cash Return
0.1%
Cap rate
0.1%
Rent to Value Ratio
Active
$800,000
2
bds
|
2
ba
|
1,220
sqft
|
built
1995
6301 Collins Ave, Miami Beach, FL 33141
$-3,573
Cash flow
-23.3%
Cash-on-Cash Return
0.8%
Cap rate
0.5%
Rent to Value Ratio
Active
$250,000
1
bds
|
1
ba
|
666
sqft
|
built
1960
1185 Marseille Dr, Miami Beach, FL 33141
$-937
Cash flow
-19.6%
Cash-on-Cash Return
1.7%
Cap rate
0.8%
Rent to Value Ratio
Active
$699,000
1
bds
|
2
ba
|
871
sqft
|
built
2008
6799 Collins Ave, Miami Beach, FL 33141
$-3,473
Cash flow
-25.9%
Cash-on-Cash Return
0.2%
Cap rate
0.9%
Rent to Value Ratio
Active
$599,000
2
bds
|
2
ba
|
1,061
sqft
|
built
1987
7601 E Treasure Dr, North Bay Village, FL 33141
$-2,007
Cash flow
-17.5%
Cash-on-Cash Return
2.1%
Cap rate
0.6%
Rent to Value Ratio
Active
$308,000
1
bds
|
2
ba
|
910
sqft
|
built
1968
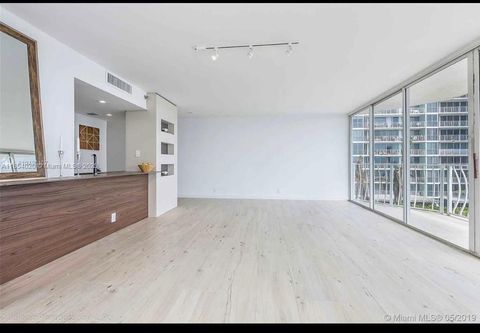
6770 Indian Creek Dr, Miami Beach, FL 33141
$-1,318
Cash flow
-22.3%
Cash-on-Cash Return
1.0%
Cap rate
0.7%
Rent to Value Ratio
Active
$465,000
1
bds
|
1
ba
|
772
sqft
|
built
2008
6801 Collins Ave, Miami Beach, FL 33141
$-2,929
Cash flow
-32.9%
Cash-on-Cash Return
-1.4%
Cap rate
0.9%
Rent to Value Ratio
Active
$339,000
2
bds
|
2
ba
|
1,175
sqft
|
built
1967
6855 Abbott Ave, Miami Beach, FL 33141
$-1,156
Cash flow
-17.8%
Cash-on-Cash Return
2.1%
Cap rate
0.9%
Rent to Value Ratio