33141 Investment Properties for Sale
Browse homes for sale and investment properties in 33141. Refine your search by price, property type, or more.
Best cash flowing properties in 33141

Active
$179,003
1
bds
|
1
ba
|
465
sqft
|
built
1966
1140 71st St, Miami Beach, FL 33141
$-155
Cash flow
-4.5%
Cash-on-Cash Return
5.1%
Cap rate
1.0%
Rent to Value Ratio
Active
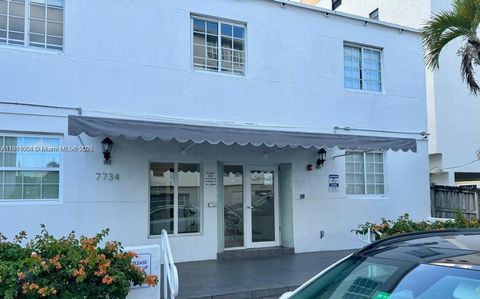
$198,000
1
bds
|
1
ba
|
570
sqft
|
built
1940
7734 Abbott Ave, Miami Beach, FL 33141
$-429
Cash flow
-11.3%
Cash-on-Cash Return
3.5%
Cap rate
0.9%
Rent to Value Ratio
456 out of 502 properties for sale in 33141
Limited Results Shown
Create a free account, or log in to reveal all property listings and enjoy the complete experience.

Active
$396,000
2
bds
|
2
ba
|
1,326
sqft
|
built
1968
6770 Indian Creek Dr, Miami Beach, FL 33141
$-1,843
Cash flow
-24.3%
Cash-on-Cash Return
0.6%
Cap rate
0.8%
Rent to Value Ratio
Active
$345,999
1
bds
|
2
ba
|
1,057
sqft
|
built
1952
1865 79th Street Cswy, North Bay Village, FL 33141
$-1,505
Cash flow
-22.7%
Cash-on-Cash Return
0.9%
Cap rate
0.8%
Rent to Value Ratio

Active
$1,150,000
2
bds
|
2
ba
|
1,340
sqft
|
built
1995
6301 Collins Ave, Miami Beach, FL 33141
$-5,628
Cash flow
-25.5%
Cash-on-Cash Return
0.3%
Cap rate
0.4%
Rent to Value Ratio

Active
$493,500
1
bds
|
1
ba
|
642
sqft
|
built
2016
6620 Indian Creek Dr, Miami Beach, FL 33141
$-1,773
Cash flow
-18.7%
Cash-on-Cash Return
1.8%
Cap rate
0.7%
Rent to Value Ratio

Active
$3,300,000
4
bds
|
2
ba
|
1,696
sqft
|
built
1949
833 86th St, Miami Beach, FL 33141
$-14,774
Cash flow
-23.4%
Cash-on-Cash Return
0.8%
Cap rate
0.2%
Rent to Value Ratio

Active
$429,000
0
bds
|
0
ba
|
247
sqft
|
built
1963
900 Bay Dr, Miami Beach, FL 33141
$-652
Cash flow
-7.9%
Cash-on-Cash Return
4.3%
Cap rate
0.7%
Rent to Value Ratio

Active
$3,750,000
3
bds
|
3
ba
|
1,860
sqft
|
built
2008
6799 Collins Ave, Miami Beach, FL 33141
$-21,366
Cash flow
-29.7%
Cash-on-Cash Return
-0.7%
Cap rate
0.2%
Rent to Value Ratio

Active
$299,000
1
bds
|
2
ba
|
920
sqft
|
built
1963
900 Bay Dr, Miami Beach, FL 33141
$-1,463
Cash flow
-25.5%
Cash-on-Cash Return
0.3%
Cap rate
0.8%
Rent to Value Ratio

Active
$2,550,000
8
bds
|
0
ba
|
4,524
sqft
|
built
1947
7115 Rue Granville, Miami Beach, FL 33141
$-12,602
Cash flow
-25.8%
Cash-on-Cash Return
0.2%
Cap rate
0.1%
Rent to Value Ratio
Active
$877,000
2
bds
|
2
ba
|
1,805
sqft
|
built
1976
6423 Collins Ave, Miami Beach, FL 33141
$-2,882
Cash flow
-17.1%
Cash-on-Cash Return
2.2%
Cap rate
0.6%
Rent to Value Ratio
Active
$370,000
2
bds
|
2
ba
|
1,178
sqft
|
built
1966
1455 N Treasure Dr, North Bay Village, FL 33141
$-1,657
Cash flow
-23.4%
Cash-on-Cash Return
0.8%
Cap rate
0.7%
Rent to Value Ratio

Active
$2,150,000
5
bds
|
5
ba
|
2,474
sqft
|
built
1952
420 N Shore Dr, Miami Beach, FL 33141
$-4,197
Cash flow
-10.2%
Cash-on-Cash Return
3.8%
Cap rate
0.5%
Rent to Value Ratio
Active
$295,000
1
bds
|
1
ba
|
1,005
sqft
|
built
1973
6900 Bay Dr, Miami Beach, FL 33141
$-1,225
Cash flow
-21.7%
Cash-on-Cash Return
1.2%
Cap rate
0.9%
Rent to Value Ratio
Active
$579,000
3
bds
|
2
ba
|
0
sqft
|
built
1948
759 85th St, Miami Beach, FL 33141
$-997
Cash flow
-9.0%
Cash-on-Cash Return
4.1%
Cap rate
0.6%
Rent to Value Ratio

Active
$325,000
2
bds
|
2
ba
|
1,100
sqft
|
built
1966
2016 Bay Dr, Miami Beach, FL 33141
$-1,375
Cash flow
-22.1%
Cash-on-Cash Return
1.1%
Cap rate
0.9%
Rent to Value Ratio
Active
$1,890,000
3
bds
|
3
ba
|
1,505
sqft
|
built
1947
1201 S Biscayne Point Rd, Miami Beach, FL 33141
$-7,578
Cash flow
-20.9%
Cash-on-Cash Return
1.3%
Cap rate
0.3%
Rent to Value Ratio
Active
$440,000
1
bds
|
1
ba
|
940
sqft
|
built
1952
1865 79th Street Cswy, North Bay Village, FL 33141
$-1,699
Cash flow
-20.1%
Cash-on-Cash Return
1.5%
Cap rate
0.6%
Rent to Value Ratio
Active
$305,000
2
bds
|
1
ba
|
931
sqft
|
built
1955
340 84th St, Miami Beach, FL 33141
$-842
Cash flow
-14.4%
Cash-on-Cash Return
2.8%
Cap rate
0.8%
Rent to Value Ratio
Active
$450,000
2
bds
|
2
ba
|
1,030
sqft
|
built
1987
7601 E Treasure Dr, North Bay Village, FL 33141
$-1,017
Cash flow
-11.8%
Cash-on-Cash Return
3.4%
Cap rate
0.8%
Rent to Value Ratio

Active
$829,000
1
bds
|
2
ba
|
819
sqft
|
built
2004
6515 Collins Ave, Miami Beach, FL 33141
$-3,649
Cash flow
-23.0%
Cash-on-Cash Return
0.9%
Cap rate
0.5%
Rent to Value Ratio
Active
$265,000
1
bds
|
1
ba
|
817
sqft
|
built
1966
1455 N Treasure Dr, North Bay Village, FL 33141
$-1,022
Cash flow
-20.1%
Cash-on-Cash Return
1.5%
Cap rate
0.8%
Rent to Value Ratio
Active
$6,450,000
4
bds
|
4
ba
|
4,502
sqft
|
built
1951
425 N Shore Dr, Miami Beach, FL 33141
$-31,482
Cash flow
-25.5%
Cash-on-Cash Return
0.3%
Cap rate
0.1%
Rent to Value Ratio

Active
$295,000
1
bds
|
1
ba
|
921
sqft
|
built
1970
401 69th St, Miami Beach, FL 33141
$-1,155
Cash flow
-20.4%
Cash-on-Cash Return
1.4%
Cap rate
0.8%
Rent to Value Ratio

Active
$489,000
1
bds
|
2
ba
|
1,075
sqft
|
built
1963
900 Bay Dr, Miami Beach, FL 33141
$-829
Cash flow
-8.8%
Cash-on-Cash Return
4.1%
Cap rate
0.6%
Rent to Value Ratio

Active
$699,999
1
bds
|
2
ba
|
1,503
sqft
|
built
1976
6423 Collins Ave, Miami Beach, FL 33141
$-2,379
Cash flow
-17.7%
Cash-on-Cash Return
2.1%
Cap rate
0.7%
Rent to Value Ratio

Active
$245,000
1
bds
|
2
ba
|
794
sqft
|
built
1970
7850 Byron Ave, Miami Beach, FL 33141
$-674
Cash flow
-14.4%
Cash-on-Cash Return
2.8%
Cap rate
0.9%
Rent to Value Ratio

Active
$330,000
1
bds
|
1
ba
|
452
sqft
|
built
1940
7326 Collins Ave, Miami Beach, FL 33141
$-1,144
Cash flow
-18.1%
Cash-on-Cash Return
2.0%
Cap rate
0.6%
Rent to Value Ratio

Active
$319,000
1
bds
|
2
ba
|
910
sqft
|
built
1968
6770 Indian Creek Dr, Miami Beach, FL 33141
$-1,185
Cash flow
-19.4%
Cash-on-Cash Return
1.7%
Cap rate
0.8%
Rent to Value Ratio

Active
$190,000
0
bds
|
1
ba
|
465
sqft
|
built
1957
8080 Tatum Waterway Dr, Miami Beach, FL 33141
$-560
Cash flow
-15.4%
Cash-on-Cash Return
2.6%
Cap rate
0.8%
Rent to Value Ratio
Active
$529,000
2
bds
|
2
ba
|
1,030
sqft
|
built
1987
7601 E Treasure Dr, North Bay Village, FL 33141
$-1,852
Cash flow
-18.3%
Cash-on-Cash Return
1.9%
Cap rate
0.6%
Rent to Value Ratio

Active
$1,799,900
6
bds
|
0
ba
|
2,668
sqft
|
built
1946
7411 Carlyle Ave, Miami Beach, FL 33141
$-9,346
Cash flow
-27.1%
Cash-on-Cash Return
-0.1%
Cap rate
0.1%
Rent to Value Ratio

Active
$439,000
2
bds
|
2
ba
|
1,326
sqft
|
built
1968
6770 Indian Creek Dr, Miami Beach, FL 33141
$-1,910
Cash flow
-22.7%
Cash-on-Cash Return
0.9%
Cap rate
0.7%
Rent to Value Ratio

Active
$535,000
1
bds
|
2
ba
|
912
sqft
|
built
1970
7135 Collins Ave, Miami Beach, FL 33141
$-2,214
Cash flow
-21.6%
Cash-on-Cash Return
1.2%
Cap rate
0.5%
Rent to Value Ratio

Active
$750,000
2
bds
|
2
ba
|
890
sqft
|
built
1951
1795 Calais Dr, Miami Beach, FL 33141
$-2,595
Cash flow
-18.1%
Cash-on-Cash Return
2.0%
Cap rate
0.3%
Rent to Value Ratio

Active
$750,000
2
bds
|
2
ba
|
870
sqft
|
built
1951
1795 Calais Dr, Miami Beach, FL 33141
$-2,334
Cash flow
-16.2%
Cash-on-Cash Return
2.4%
Cap rate
0.3%
Rent to Value Ratio

Active
$355,000
bds
|
1
ba
|
400
sqft
|
built
1948
6345 Collins Ave, Miami Beach, FL 33141
$-1,359
Cash flow
-20.0%
Cash-on-Cash Return
1.6%
Cap rate
0.6%
Rent to Value Ratio

Active
$750,000
2
bds
|
2
ba
|
890
sqft
|
built
1951
1785 Calais Dr, Miami Beach, FL 33141
$-2,299
Cash flow
-16.0%
Cash-on-Cash Return
2.5%
Cap rate
0.4%
Rent to Value Ratio

Active
$750,000
2
bds
|
2
ba
|
890
sqft
|
built
1951
1795 Calais Dr, Miami Beach, FL 33141
$-1,481
Cash flow
-10.3%
Cash-on-Cash Return
3.8%
Cap rate
0.6%
Rent to Value Ratio