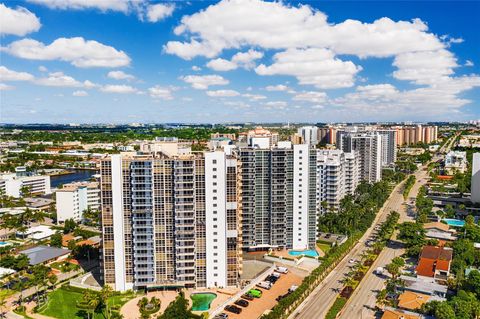
33308 Investment Properties for Sale
Browse homes for sale and investment properties in 33308. Refine your search by price, property type, or more.
Best cash flowing properties in 33308
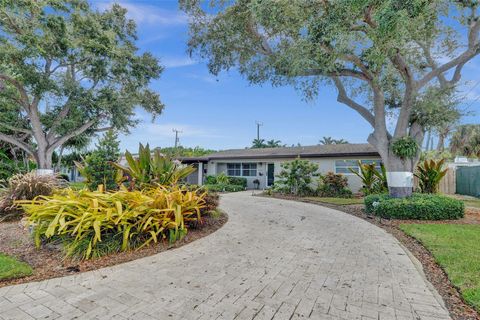
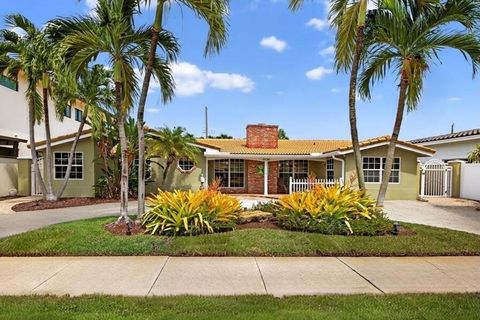
Active
$215,000
1
bds
|
1
ba
|
740
sqft
|
built
1964
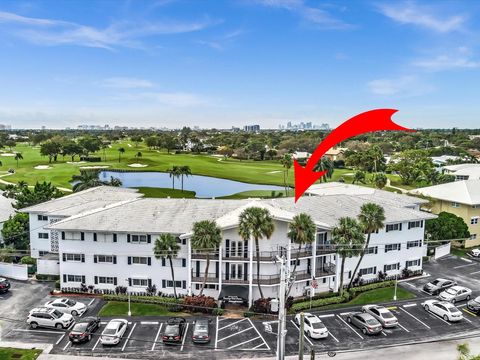
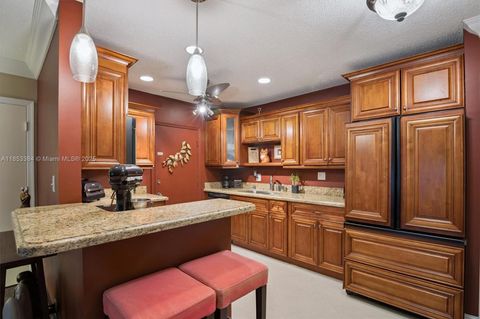
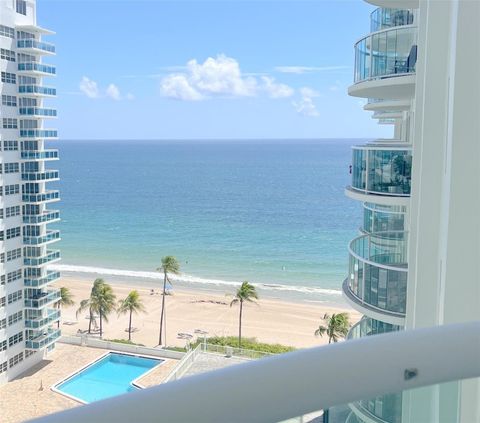
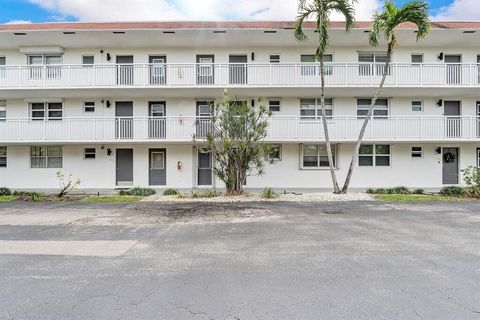
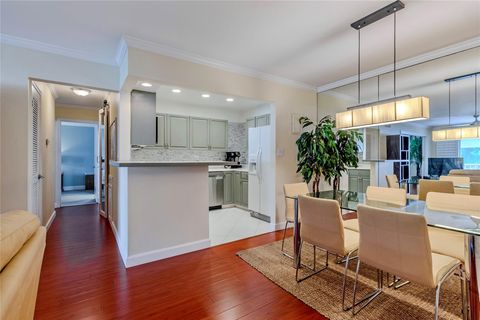
4848 NE 23rd Ave, Fort Lauderdale, FL 33308
$146
Cash flow
3.5%
Cash-on-Cash Return
7.0%
Cap rate
1.0%
Rent to Value Ratio
Active
$193,000
2
bds
|
2
ba
|
875
sqft
|
built
1971
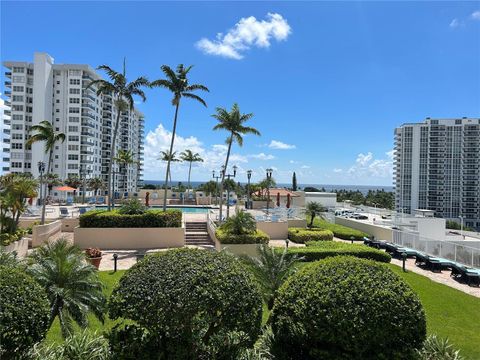
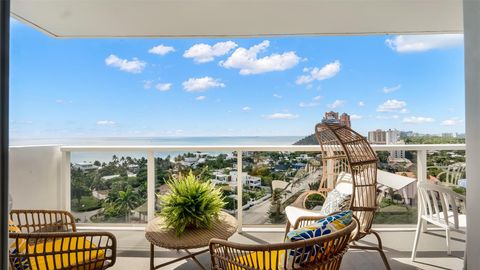
5900 NE 22nd Way, Fort Lauderdale, FL 33308
$-174
Cash flow
-4.7%
Cash-on-Cash Return
5.1%
Cap rate
1.1%
Rent to Value Ratio
394 out of 494 properties for sale in 33308
Limited Results Shown
Create a free account, or log in to reveal all property listings and enjoy the complete experience.
Active
$389,900
1
bds
|
1
ba
|
720
sqft
|
built
2002
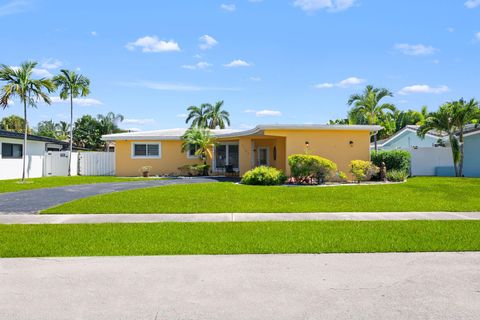
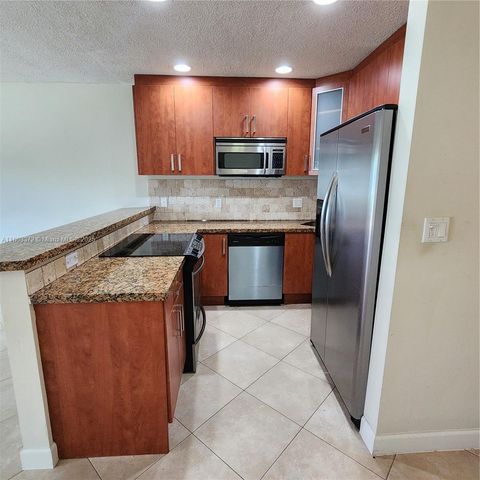
3020 NE 32nd Ave, Fort Lauderdale, FL 33308
$-1,851
Cash flow
-24.8%
Cash-on-Cash Return
0.4%
Cap rate
0.6%
Rent to Value Ratio
Active
$747,000
4
bds
|
2
ba
|
1,723
sqft
|
built
1961
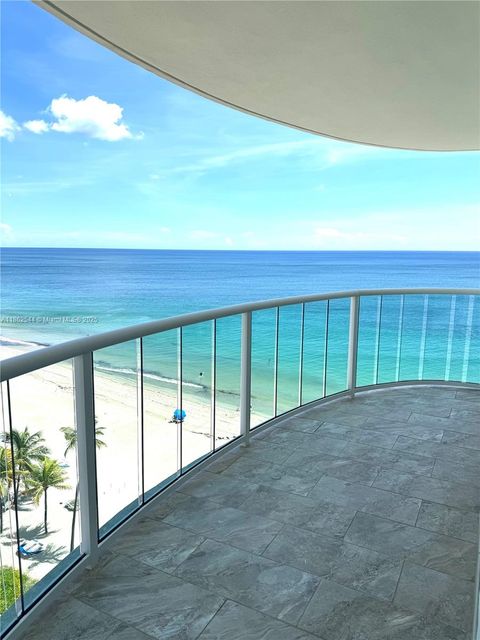
2144 NE 61st Ct, Fort Lauderdale, FL 33308
$-1,019
Cash flow
-7.1%
Cash-on-Cash Return
4.5%
Cap rate
0.7%
Rent to Value Ratio
Active
$1,475,000
2
bds
|
3
ba
|
1,859
sqft
|
built
1974
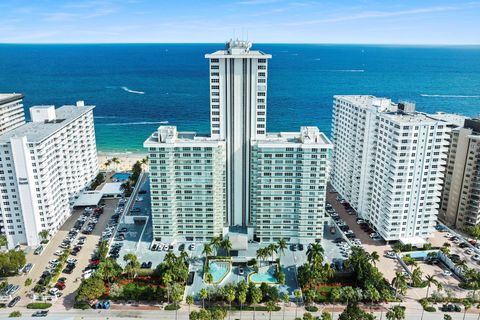
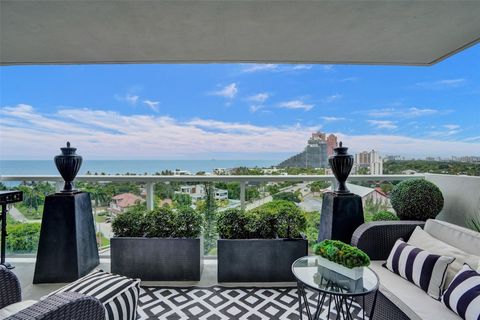
3410 Galt Ocean Dr, Fort Lauderdale, FL 33308
$-5,969
Cash flow
-21.1%
Cash-on-Cash Return
1.3%
Cap rate
0.3%
Rent to Value Ratio
Active
$585,000
2
bds
|
2
ba
|
1,200
sqft
|
built
1972
2701 N Ocean Blvd, Fort Lauderdale, FL 33308
$-2,175
Cash flow
-19.4%
Cash-on-Cash Return
1.7%
Cap rate
0.7%
Rent to Value Ratio
Active
$220,000
1
bds
|
1
ba
|
700
sqft
|
built
1965
2170 NE 51st Ct, Fort Lauderdale, FL 33308
$-389
Cash flow
-9.2%
Cash-on-Cash Return
4.0%
Cap rate
0.8%
Rent to Value Ratio
Active
$1,099,000
3
bds
|
3
ba
|
2,112
sqft
|
built
1974
3410 Galt Ocean Dr, Fort Lauderdale, FL 33308
$-3,398
Cash flow
-16.1%
Cash-on-Cash Return
2.4%
Cap rate
0.6%
Rent to Value Ratio
Active
$839,000
3
bds
|
3
ba
|
1,717
sqft
|
built
1959
4120 NE 20th Ave, Oakland Park, FL 33308
$-1,364
Cash flow
-8.5%
Cash-on-Cash Return
4.2%
Cap rate
0.6%
Rent to Value Ratio
Active
$775,000
2
bds
|
2
ba
|
1,649
sqft
|
built
1975
3900 Galt Ocean Dr, Fort Lauderdale, FL 33308
$-1,431
Cash flow
-9.6%
Cash-on-Cash Return
3.9%
Cap rate
0.6%
Rent to Value Ratio

Active
$179,000
1
bds
|
1
ba
|
700
sqft
|
built
1970
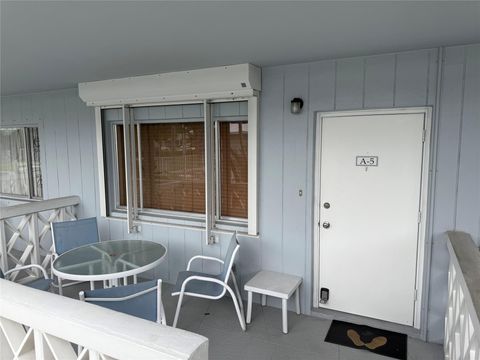
5720 NE 22nd Way, Fort Lauderdale, FL 33308
$-604
Cash flow
-17.6%
Cash-on-Cash Return
2.1%
Cap rate
0.9%
Rent to Value Ratio
Active
$249,000
2
bds
|
2
ba
|
1,065
sqft
|
built
1976
6000 NE 22nd Way, Fort Lauderdale, FL 33308
$-554
Cash flow
-11.6%
Cash-on-Cash Return
3.5%
Cap rate
0.9%
Rent to Value Ratio
Active
$1,849,000
3
bds
|
3
ba
|
2,323
sqft
|
built
1981
2415 NE 35th Dr, Fort Lauderdale, FL 33308
$-6,401
Cash flow
-18.1%
Cash-on-Cash Return
2.0%
Cap rate
0.3%
Rent to Value Ratio
Active
$725,000
3
bds
|
3
ba
|
1,955
sqft
|
built
1992
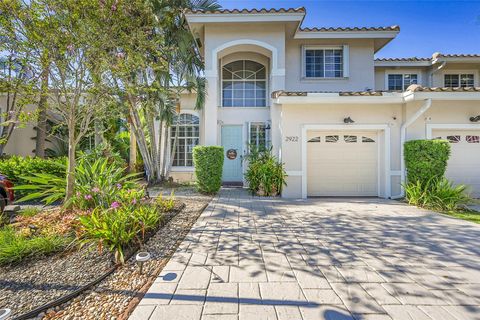
2922 Port Royale Ln S, Fort Lauderdale, FL 33308
$-1,821
Cash flow
-13.1%
Cash-on-Cash Return
3.1%
Cap rate
0.5%
Rent to Value Ratio
Active
$2,999,900
3
bds
|
3
ba
|
2,588
sqft
|
built
1998
3200 N Ocean Blvd, Fort Lauderdale, FL 33308
$-15,302
Cash flow
-26.6%
Cash-on-Cash Return
0.0%
Cap rate
0.3%
Rent to Value Ratio
Active
$560,000
2
bds
|
2
ba
|
1,400
sqft
|
built
1970
3100 NE 49th St, Fort Lauderdale, FL 33308
$-2,386
Cash flow
-22.2%
Cash-on-Cash Return
1.0%
Cap rate
0.6%
Rent to Value Ratio
Active
$520,000
2
bds
|
2
ba
|
1,200
sqft
|
built
1972
2701 N Ocean Blvd, Fort Lauderdale, FL 33308
$-1,936
Cash flow
-19.4%
Cash-on-Cash Return
1.7%
Cap rate
0.8%
Rent to Value Ratio
Active
$1,745,000
3
bds
|
3
ba
|
2,456
sqft
|
built
1962
2510 NE 47th St, Fort Lauderdale, FL 33308
$-3,788
Cash flow
-11.3%
Cash-on-Cash Return
3.5%
Cap rate
0.5%
Rent to Value Ratio

Active
$1,299,900
4
bds
|
3
ba
|
2,161
sqft
|
built
1965
2101 NE 54th Ct, Fort Lauderdale, FL 33308
$-4,562
Cash flow
-18.3%
Cash-on-Cash Return
1.9%
Cap rate
0.4%
Rent to Value Ratio
Active
$449,000
2
bds
|
2
ba
|
1,260
sqft
|
built
1966
3000 NE 48th St, Fort Lauderdale, FL 33308
$-1,333
Cash flow
-15.5%
Cash-on-Cash Return
2.6%
Cap rate
0.7%
Rent to Value Ratio
Active
$1,169,000
3
bds
|
3
ba
|
2,522
sqft
|
built
1977
3100 NE 48th St, Fort Lauderdale, FL 33308
$-3,106
Cash flow
-13.9%
Cash-on-Cash Return
3.0%
Cap rate
0.7%
Rent to Value Ratio
Active
$168,000
2
bds
|
1
ba
|
875
sqft
|
built
1970
2171 NE 66th St, Fort Lauderdale, FL 33308
$-309
Cash flow
-9.6%
Cash-on-Cash Return
3.9%
Cap rate
1.1%
Rent to Value Ratio
Active
$258,900
2
bds
|
2
ba
|
1,100
sqft
|
built
1972
6600 NE 22nd Way, Fort Lauderdale, FL 33308
$-871
Cash flow
-17.6%
Cash-on-Cash Return
2.1%
Cap rate
0.8%
Rent to Value Ratio
Active
$279,000
2
bds
|
1
ba
|
875
sqft
|
built
1965
5208 NE 24th Ter, Fort Lauderdale, FL 33308
$-799
Cash flow
-14.9%
Cash-on-Cash Return
2.7%
Cap rate
0.8%
Rent to Value Ratio
Active
$549,000
1
bds
|
2
ba
|
1,190
sqft
|
built
1967
4100 Galt Ocean Dr, Fort Lauderdale, FL 33308
$-2,238
Cash flow
-21.3%
Cash-on-Cash Return
1.3%
Cap rate
0.6%
Rent to Value Ratio
Active
$1,250,000
4
bds
|
2
ba
|
2,084
sqft
|
built
1976
2331 NE 35th Dr, Fort Lauderdale, FL 33308
$-2,770
Cash flow
-11.6%
Cash-on-Cash Return
3.5%
Cap rate
0.5%
Rent to Value Ratio
Active
$195,000
1
bds
|
2
ba
|
775
sqft
|
built
1966
4025 N Federal Hwy, Oakland Park, FL 33308
$-789
Cash flow
-21.1%
Cash-on-Cash Return
1.3%
Cap rate
0.9%
Rent to Value Ratio
Active
$777,000
2
bds
|
2
ba
|
1,250
sqft
|
built
1972
2701 N Ocean Blvd, Fort Lauderdale, FL 33308
$-3,484
Cash flow
-23.4%
Cash-on-Cash Return
0.8%
Cap rate
0.5%
Rent to Value Ratio
Active
$439,900
2
bds
|
2
ba
|
1,200
sqft
|
built
1973
6437 Bay Club Dr, Fort Lauderdale, FL 33308
$-1,349
Cash flow
-16.0%
Cash-on-Cash Return
2.5%
Cap rate
0.6%
Rent to Value Ratio
Active
$216,000
1
bds
|
1
ba
|
700
sqft
|
built
1965
2170 NE 51st Ct, Fort Lauderdale, FL 33308
$-473
Cash flow
-11.4%
Cash-on-Cash Return
3.5%
Cap rate
0.9%
Rent to Value Ratio
Active
$439,900
1
bds
|
1
ba
|
900
sqft
|
built
1973
2715 N Ocean Blvd, Fort Lauderdale, FL 33308
$-1,705
Cash flow
-20.2%
Cash-on-Cash Return
1.5%
Cap rate
0.6%
Rent to Value Ratio
Active
$212,000
1
bds
|
1
ba
|
700
sqft
|
built
1965
2170 NE 51st Ct, Fort Lauderdale, FL 33308
$-397
Cash flow
-9.8%
Cash-on-Cash Return
3.9%
Cap rate
0.9%
Rent to Value Ratio
Active
$870,000
2
bds
|
2
ba
|
1,650
sqft
|
built
1970
4280 Galt Ocean Dr, Fort Lauderdale, FL 33308
$-2,385
Cash flow
-14.3%
Cash-on-Cash Return
2.9%
Cap rate
0.7%
Rent to Value Ratio
Active
$1,599,000
3
bds
|
3
ba
|
2,455
sqft
|
built
1966
5921 NE 22nd Way, Fort Lauderdale, FL 33308
$-5,584
Cash flow
-18.2%
Cash-on-Cash Return
2.0%
Cap rate
0.3%
Rent to Value Ratio
Active
$849,000
4
bds
|
3
ba
|
2,259
sqft
|
built
1962
5730 NE 21st Rd, Fort Lauderdale, FL 33308
$-1,824
Cash flow
-11.2%
Cash-on-Cash Return
3.6%
Cap rate
0.5%
Rent to Value Ratio

Active
$1,299,000
3
bds
|
2
ba
|
1,973
sqft
|
built
1967
3309 NE 42nd Ct, Fort Lauderdale, FL 33308
$-1,457
Cash flow
-5.9%
Cash-on-Cash Return
4.8%
Cap rate
0.6%
Rent to Value Ratio
Active
$400,000
1
bds
|
1
ba
|
750
sqft
|
built
2002
3020 NE 32nd Ave, Fort Lauderdale, FL 33308
$-1,685
Cash flow
-22.0%
Cash-on-Cash Return
1.1%
Cap rate
0.7%
Rent to Value Ratio
Active
$899,000
3
bds
|
2
ba
|
1,967
sqft
|
built
1961
2185 NE 61st Ct, Fort Lauderdale, FL 33308
$-2,448
Cash flow
-14.2%
Cash-on-Cash Return
2.9%
Cap rate
0.4%
Rent to Value Ratio

Active
$3,398,000
4
bds
|
5
ba
|
3,499
sqft
|
built
1960
3222 NE 40th St, Fort Lauderdale, FL 33308
$-11,903
Cash flow
-18.3%
Cash-on-Cash Return
1.9%
Cap rate
0.3%
Rent to Value Ratio
Active
$315,000
1
bds
|
1
ba
|
850
sqft
|
built
1965
4010 Galt Ocean Dr, Fort Lauderdale, FL 33308
$-1,003
Cash flow
-16.6%
Cash-on-Cash Return
2.3%
Cap rate
0.8%
Rent to Value Ratio