33309 Investment Properties for Sale
Browse homes for sale and investment properties in 33309. Refine your search by price, property type, or more.
Best cash flowing properties in 33309
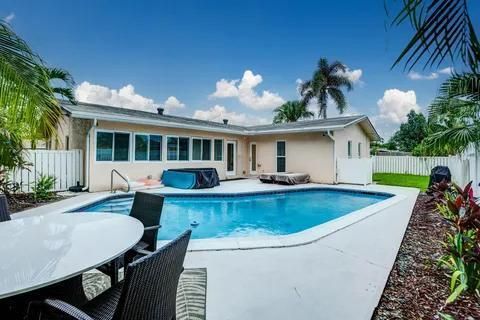
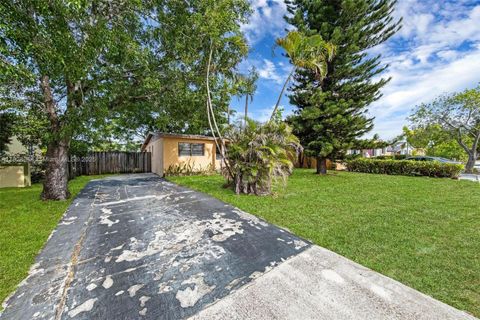
Active
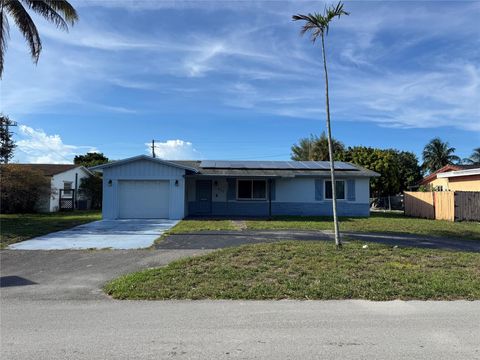
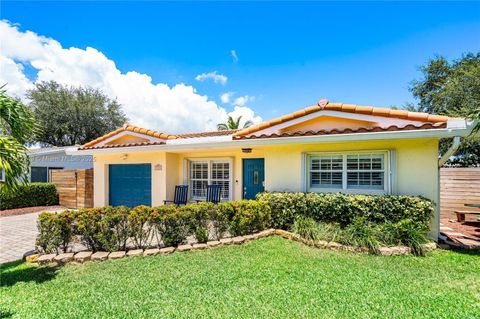
$425,000
3
bds
|
2
ba
|
1,712
sqft
|
built
1970
931 NW 46th St, Fort Lauderdale, FL 33309
$-134
Cash flow
-1.6%
Cash-on-Cash Return
5.8%
Cap rate
0.8%
Rent to Value Ratio
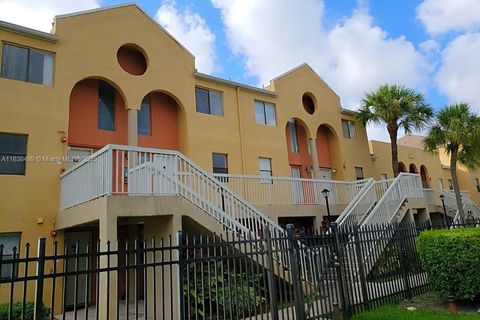
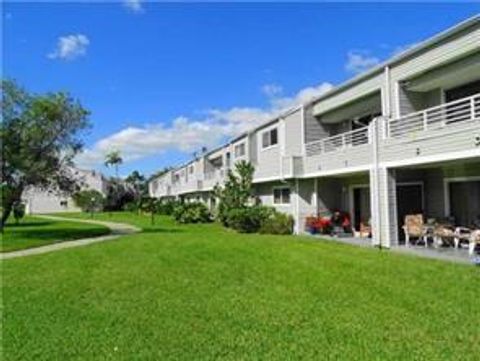
Active
$199,999
2
bds
|
3
ba
|
1,032
sqft
|
built
1987
5200 NW 31st Ave, Fort Lauderdale, FL 33309
$-235
Cash flow
-6.1%
Cash-on-Cash Return
4.7%
Cap rate
1.1%
Rent to Value Ratio
183 out of 276 properties for sale in 33309
Limited Results Shown
Create a free account, or log in to reveal all property listings and enjoy the complete experience.
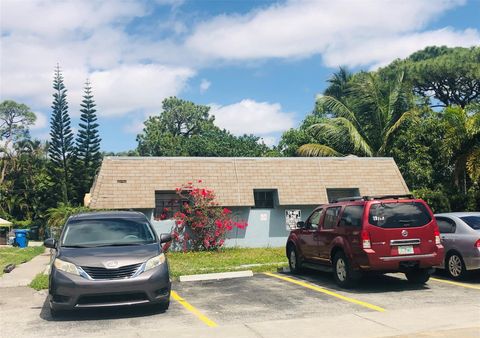
Active
$739,000
bds
|
0
ba
|
2,716
sqft
|
built
1976
575 NW 41st St, Oakland Park, FL 33309
$-3,536
Cash flow
-25.0%
Cash-on-Cash Return
0.4%
Cap rate
0.2%
Rent to Value Ratio
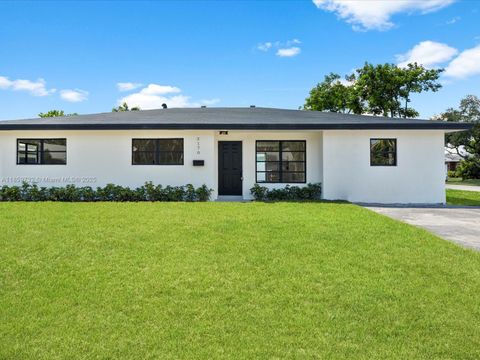
Active
$619,000
4
bds
|
2
ba
|
1,952
sqft
|
built
1972
3170 NW 69th St, Fort Lauderdale, FL 33309
$-1,704
Cash flow
-14.4%
Cash-on-Cash Return
2.8%
Cap rate
0.5%
Rent to Value Ratio
Active
$625,000
4
bds
|
2
ba
|
1,471
sqft
|
built
1972
3127 NW 68th St, Fort Lauderdale, FL 33309
$-1,225
Cash flow
-10.2%
Cash-on-Cash Return
3.8%
Cap rate
0.5%
Rent to Value Ratio

Active
$479,500
3
bds
|
2
ba
|
1,390
sqft
|
built
1978
2900 NW 69th Ct, Fort Lauderdale, FL 33309
$-647
Cash flow
-7.0%
Cash-on-Cash Return
4.5%
Cap rate
0.7%
Rent to Value Ratio
Active
$389,850
2
bds
|
1
ba
|
1,030
sqft
|
built
1968
2400 NW 55th St, Tamarac, FL 33309
$-1,259
Cash flow
-16.8%
Cash-on-Cash Return
2.3%
Cap rate
0.5%
Rent to Value Ratio
Active
$569,000
3
bds
|
2
ba
|
1,708
sqft
|
built
1970
1011 NW 45th Ct, Fort Lauderdale, FL 33309
$-868
Cash flow
-8.0%
Cash-on-Cash Return
4.3%
Cap rate
0.6%
Rent to Value Ratio

Active
$209,900
2
bds
|
2
ba
|
975
sqft
|
built
1974
120 Royal Park Dr, Oakland Park, FL 33309
$-853
Cash flow
-21.2%
Cash-on-Cash Return
1.3%
Cap rate
1.0%
Rent to Value Ratio
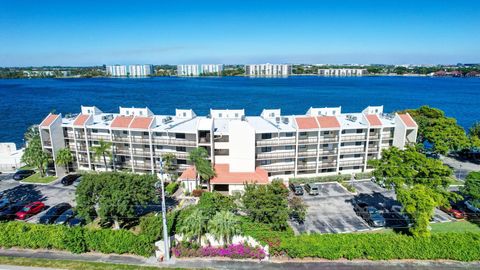
Active
$199,000
2
bds
|
2
ba
|
920
sqft
|
built
1981
109 Lake Emerald Dr, Oakland Park, FL 33309
$-875
Cash flow
-22.9%
Cash-on-Cash Return
0.9%
Cap rate
0.9%
Rent to Value Ratio
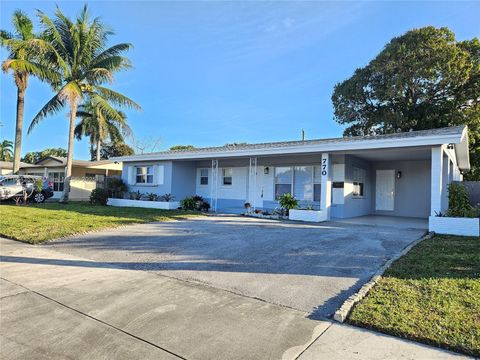
Active
$575,000
4
bds
|
3
ba
|
1,840
sqft
|
built
1956
770 NW 38th St, Oakland Park, FL 33309
$-1,681
Cash flow
-15.3%
Cash-on-Cash Return
2.6%
Cap rate
0.5%
Rent to Value Ratio
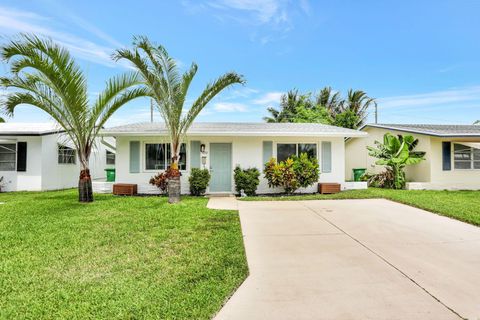
Active
$420,000
3
bds
|
1
ba
|
966
sqft
|
built
1957
121 NW 53rd Ct, Oakland Park, FL 33309
$-435
Cash flow
-5.4%
Cash-on-Cash Return
4.9%
Cap rate
0.8%
Rent to Value Ratio
Active
$395,000
2
bds
|
1
ba
|
966
sqft
|
built
1956
230 NW 52nd Ct, Oakland Park, FL 33309
$-598
Cash flow
-7.9%
Cash-on-Cash Return
4.3%
Cap rate
0.7%
Rent to Value Ratio

Active
$689,000
3
bds
|
2
ba
|
1,115
sqft
|
built
1971
3294 NW 6th Ave, Oakland Park, FL 33309
$-1,123
Cash flow
-8.5%
Cash-on-Cash Return
4.2%
Cap rate
0.7%
Rent to Value Ratio
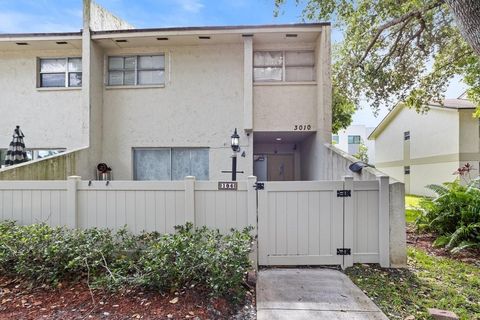
Active
$325,000
4
bds
|
3
ba
|
1,555
sqft
|
built
1982
3010 NW 68th St, Fort Lauderdale, FL 33309
$-629
Cash flow
-10.1%
Cash-on-Cash Return
3.8%
Cap rate
0.9%
Rent to Value Ratio
Active
$630,000
3
bds
|
2
ba
|
1,550
sqft
|
built
1971
6811 NW 32nd Ave, Fort Lauderdale, FL 33309
$-1,406
Cash flow
-11.6%
Cash-on-Cash Return
3.5%
Cap rate
0.5%
Rent to Value Ratio

Active
$680,000
3
bds
|
3
ba
|
1,645
sqft
|
built
1978
6711 NW 26th Ave, Fort Lauderdale, FL 33309
$-1,209
Cash flow
-9.3%
Cash-on-Cash Return
4.0%
Cap rate
0.7%
Rent to Value Ratio
Active
$214,900
2
bds
|
2
ba
|
1,020
sqft
|
built
1988
3453 NW 44th St, Lauderdale Lakes, FL 33309
$-684
Cash flow
-16.6%
Cash-on-Cash Return
2.3%
Cap rate
0.9%
Rent to Value Ratio
Active
$420,000
3
bds
|
3
ba
|
1,514
sqft
|
built
2008
3204 NW 33rd St, Oakland Park, FL 33309
$-932
Cash flow
-11.6%
Cash-on-Cash Return
3.5%
Cap rate
0.7%
Rent to Value Ratio
Active
$549,900
4
bds
|
3
ba
|
1,945
sqft
|
built
1964
3565 Lloyd Dr, Oakland Park, FL 33309
$-576
Cash flow
-5.5%
Cash-on-Cash Return
4.9%
Cap rate
0.7%
Rent to Value Ratio
Active
$648,000
3
bds
|
3
ba
|
1,754
sqft
|
built
2021
2137 Appleton Cir N, Oakland Park, FL 33309
$-1,548
Cash flow
-12.5%
Cash-on-Cash Return
3.3%
Cap rate
0.6%
Rent to Value Ratio
Active
$624,000
3
bds
|
2
ba
|
1,727
sqft
|
built
1964
1736 NW 38th St, Oakland Park, FL 33309
$-1,378
Cash flow
-11.5%
Cash-on-Cash Return
3.5%
Cap rate
0.6%
Rent to Value Ratio
Active
$199,000
3
bds
|
1
ba
|
1,150
sqft
|
built
1973
6930 NW 31st Ave, Fort Lauderdale, FL 33309
$-975
Cash flow
-25.6%
Cash-on-Cash Return
0.3%
Cap rate
1.2%
Rent to Value Ratio
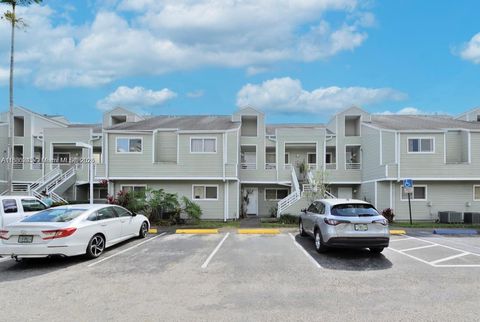
Active
$205,000
1
bds
|
1
ba
|
702
sqft
|
built
1987
5200 NW 31st Ave, Fort Lauderdale, FL 33309
$-442
Cash flow
-11.2%
Cash-on-Cash Return
3.6%
Cap rate
0.9%
Rent to Value Ratio
Active
$209,999
2
bds
|
2
ba
|
920
sqft
|
built
1981
110 Lake Emerald Dr, Oakland Park, FL 33309
$-767
Cash flow
-19.1%
Cash-on-Cash Return
1.8%
Cap rate
1.0%
Rent to Value Ratio
Active
$396,900
3
bds
|
3
ba
|
1,308
sqft
|
built
1995
3263 NW 44th St, Fort Lauderdale, FL 33309
$-867
Cash flow
-11.4%
Cash-on-Cash Return
3.5%
Cap rate
0.7%
Rent to Value Ratio

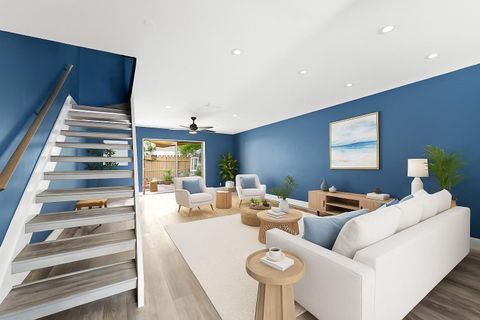
Active
$240,000
2
bds
|
3
ba
|
1,032
sqft
|
built
1987
5200 NW 31st Ave, Fort Lauderdale, FL 33309
$-438
Cash flow
-9.5%
Cash-on-Cash Return
4.0%
Cap rate
0.9%
Rent to Value Ratio
Active
$259,900
2
bds
|
2
ba
|
1,160
sqft
|
built
1986
3001 N Oakland Forest Dr, Oakland Park, FL 33309
$-415
Cash flow
-8.3%
Cash-on-Cash Return
4.2%
Cap rate
0.9%
Rent to Value Ratio
Active
$382,000
2
bds
|
1
ba
|
1,001
sqft
|
built
1956
5456 NW 1st Ave, Fort Lauderdale, FL 33309
$-634
Cash flow
-8.7%
Cash-on-Cash Return
4.2%
Cap rate
0.7%
Rent to Value Ratio
Active
$685,000
4
bds
|
2
ba
|
1,961
sqft
|
built
1972
3170 NW 68th Ct, Fort Lauderdale, FL 33309
$-933
Cash flow
-7.1%
Cash-on-Cash Return
4.5%
Cap rate
0.7%
Rent to Value Ratio
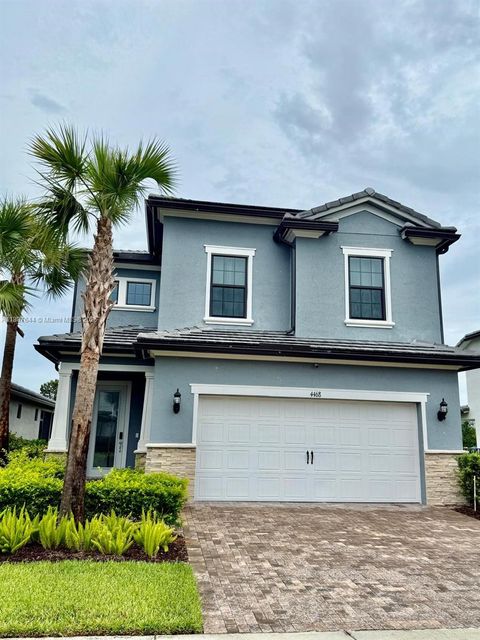
Active
$998,000
4
bds
|
3
ba
|
2,130
sqft
|
built
2023
4468 Spruce Ln, Oakland Park, FL 33309
$-1,489
Cash flow
-7.8%
Cash-on-Cash Return
4.4%
Cap rate
0.8%
Rent to Value Ratio
Active
$230,000
2
bds
|
2
ba
|
920
sqft
|
built
1985
115 Lake Emerald Dr, Oakland Park, FL 33309
$-784
Cash flow
-17.8%
Cash-on-Cash Return
2.1%
Cap rate
1.0%
Rent to Value Ratio
Active
$354,000
2
bds
|
1
ba
|
1,008
sqft
|
built
1967
4902 NW 27th Way, Tamarac, FL 33309
$-632
Cash flow
-9.3%
Cash-on-Cash Return
4.0%
Cap rate
0.7%
Rent to Value Ratio
Active
$210,000
2
bds
|
2
ba
|
1,096
sqft
|
built
1988
3409 NW 44th St, Lauderdale Lakes, FL 33309
$-646
Cash flow
-16.0%
Cash-on-Cash Return
2.5%
Cap rate
1.0%
Rent to Value Ratio

Active
$225,000
1
bds
|
1
ba
|
862
sqft
|
built
1991
2831 N Oakland Forest Dr, Oakland Park, FL 33309
$-603
Cash flow
-14.0%
Cash-on-Cash Return
2.9%
Cap rate
0.8%
Rent to Value Ratio
Active
$406,000
3
bds
|
2
ba
|
1,178
sqft
|
built
1961
4130 NW 12th Ave, Fort Lauderdale, FL 33309
$-778
Cash flow
-10.0%
Cash-on-Cash Return
3.8%
Cap rate
0.7%
Rent to Value Ratio
Active
$210,000
2
bds
|
2
ba
|
1,020
sqft
|
built
1988
3453 NW 44th St, Lauderdale Lakes, FL 33309
$-505
Cash flow
-12.5%
Cash-on-Cash Return
3.3%
Cap rate
1.0%
Rent to Value Ratio
Active
$320,000
2
bds
|
3
ba
|
1,100
sqft
|
built
1988
3082 S Oakland Forest Dr, Oakland Park, FL 33309
$-897
Cash flow
-14.6%
Cash-on-Cash Return
2.8%
Cap rate
0.8%
Rent to Value Ratio
Active
$399,000
2
bds
|
2
ba
|
1,148
sqft
|
built
1967
4249 NW 37th Ter, Lauderdale Lakes, FL 33309
$-374
Cash flow
-4.9%
Cash-on-Cash Return
5.0%
Cap rate
0.7%
Rent to Value Ratio
Active
$498,000
2
bds
|
2
ba
|
1,294
sqft
|
built
1973
3260 NW 66th St, Fort Lauderdale, FL 33309
$-1,123
Cash flow
-11.8%
Cash-on-Cash Return
3.4%
Cap rate
0.6%
Rent to Value Ratio