33309 Investment Properties for Sale
Browse homes for sale and investment properties in 33309. Refine your search by price, property type, or more.
Best cash flowing properties in 33309
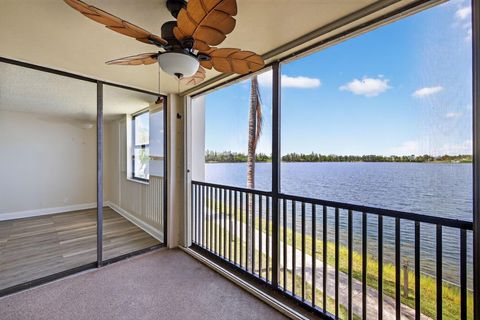
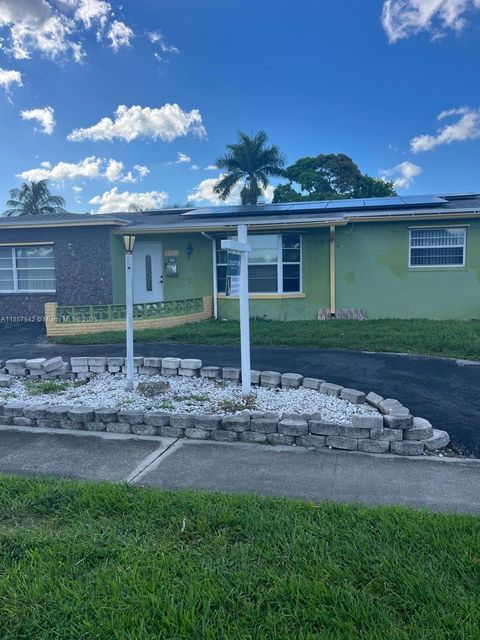
Active
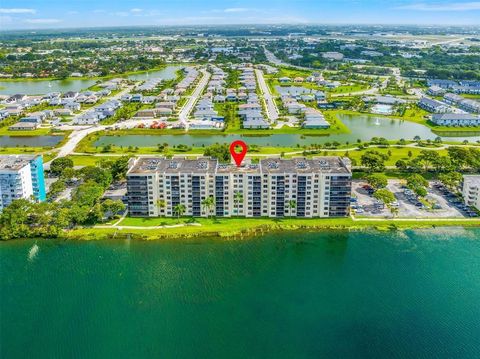
$225,000
2
bds
|
2
ba
|
1,250
sqft
|
built
1982
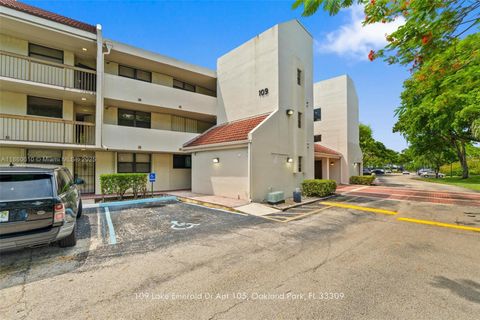
105 Lake Emerald Dr, Oakland Park, FL 33309
$43
Cash flow
1.0%
Cash-on-Cash Return
6.4%
Cap rate
1.4%
Rent to Value Ratio
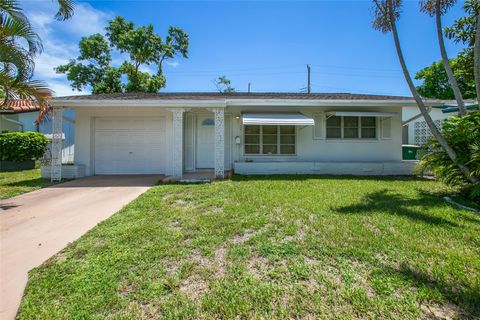
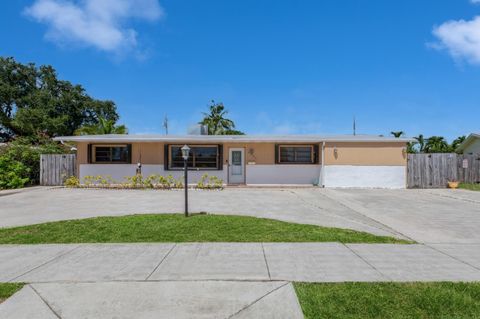
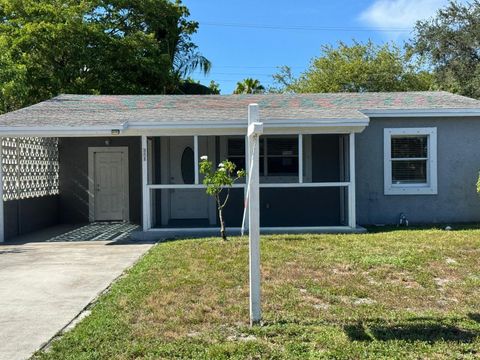
Active
$299,000
2
bds
|
1
ba
|
1,002
sqft
|
built
1968
5402 NW 23rd Ave, Tamarac, FL 33309
$-21
Cash flow
-0.4%
Cash-on-Cash Return
6.1%
Cap rate
0.8%
Rent to Value Ratio
239 out of 261 properties for sale in 33309
Limited Results Shown
Create a free account, or log in to reveal all property listings and enjoy the complete experience.
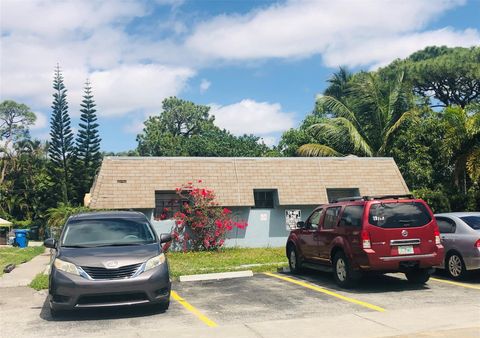
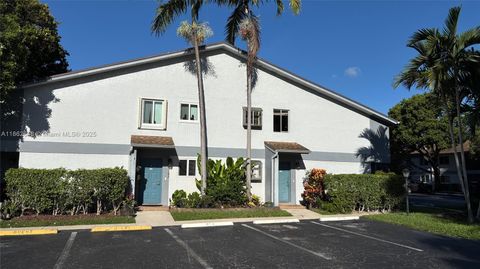
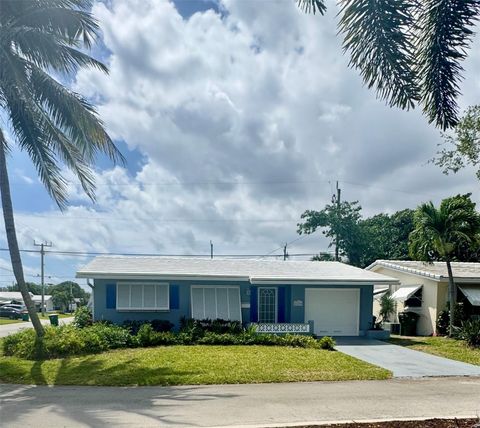
Active
$739,000
bds
|
0
ba
|
2,716
sqft
|
built
1976
575 NW 41st St, Oakland Park, FL 33309
$-3,536
Cash flow
-25.0%
Cash-on-Cash Return
0.4%
Cap rate
0.2%
Rent to Value Ratio
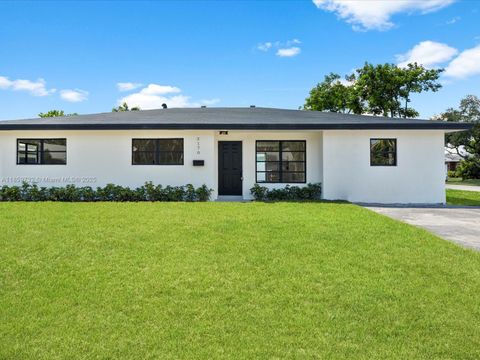
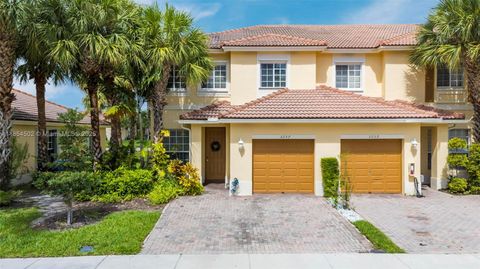
Active
$619,000
4
bds
|
2
ba
|
1,952
sqft
|
built
1972
3170 NW 69th St, Fort Lauderdale, FL 33309
$-1,704
Cash flow
-14.4%
Cash-on-Cash Return
2.8%
Cap rate
0.5%
Rent to Value Ratio
Active
$229,800
2
bds
|
2
ba
|
920
sqft
|
built
1986
117 Lake Emerald Dr, Oakland Park, FL 33309
$-609
Cash flow
-13.8%
Cash-on-Cash Return
3.0%
Cap rate
0.9%
Rent to Value Ratio
Active
$465,000
3
bds
|
2
ba
|
1,956
sqft
|
built
1962
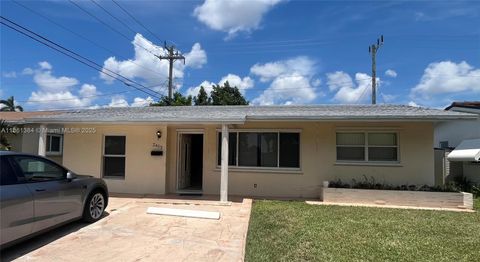
4221 NW 16th Ave, Oakland Park, FL 33309
$-107
Cash flow
-1.2%
Cash-on-Cash Return
5.9%
Cap rate
0.8%
Rent to Value Ratio
Active
$625,000
4
bds
|
2
ba
|
1,471
sqft
|
built
1972
3127 NW 68th St, Fort Lauderdale, FL 33309
$-1,225
Cash flow
-10.2%
Cash-on-Cash Return
3.8%
Cap rate
0.5%
Rent to Value Ratio
Active
$238,000
2
bds
|
1
ba
|
900
sqft
|
built
1984
2761 S Oakland Forest Dr, Oakland Park, FL 33309
$-533
Cash flow
-11.7%
Cash-on-Cash Return
3.5%
Cap rate
0.8%
Rent to Value Ratio
Active
$374,999
3
bds
|
1
ba
|
1,262
sqft
|
built
1967
2403 NW 53rd St, Tamarac, FL 33309
$-867
Cash flow
-12.1%
Cash-on-Cash Return
3.4%
Cap rate
0.7%
Rent to Value Ratio
Active
$247,000
2
bds
|
2
ba
|
1,120
sqft
|
built
1981
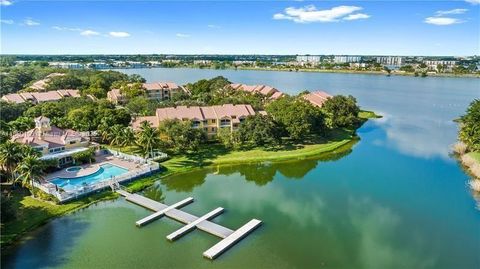
109 Lake Emerald Dr, Oakland Park, FL 33309
$-719
Cash flow
-15.2%
Cash-on-Cash Return
2.7%
Cap rate
0.9%
Rent to Value Ratio
Active
$295,000
2
bds
|
2
ba
|
978
sqft
|
built
1986
3072 S Oakland Forest Dr, Oakland Park, FL 33309
$-583
Cash flow
-10.3%
Cash-on-Cash Return
3.8%
Cap rate
0.7%
Rent to Value Ratio
Active
$269,999
2
bds
|
2
ba
|
1,241
sqft
|
built
1991
2647 NW 33rd St, Oakland Park, FL 33309
$-532
Cash flow
-10.3%
Cash-on-Cash Return
3.8%
Cap rate
0.9%
Rent to Value Ratio

Active
$145,000
1
bds
|
1
ba
|
760
sqft
|
built
1974
3101 Oakland Shores Dr, Oakland Park, FL 33309
$-158
Cash flow
-5.7%
Cash-on-Cash Return
4.8%
Cap rate
1.1%
Rent to Value Ratio

Active
$479,500
3
bds
|
2
ba
|
1,390
sqft
|
built
1978
2900 NW 69th Ct, Fort Lauderdale, FL 33309
$-647
Cash flow
-7.0%
Cash-on-Cash Return
4.5%
Cap rate
0.7%
Rent to Value Ratio
Active
$425,000
3
bds
|
2
ba
|
1,712
sqft
|
built
1970
931 NW 46th St, Fort Lauderdale, FL 33309
$-134
Cash flow
-1.6%
Cash-on-Cash Return
5.8%
Cap rate
0.8%
Rent to Value Ratio
Active
$435,000
3
bds
|
2
ba
|
1,048
sqft
|
built
1960
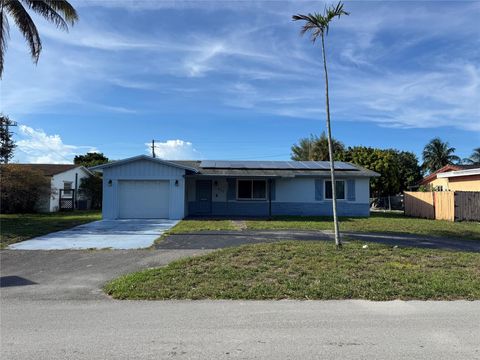
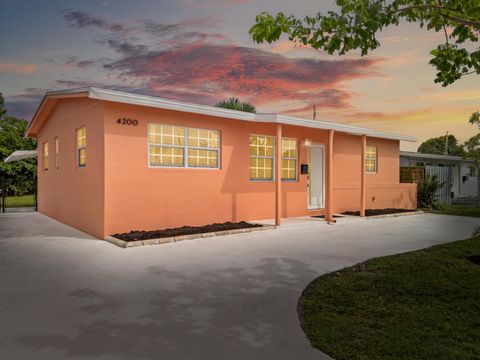
4200 NW 12th Ave, Oakland Park, FL 33309
$-840
Cash flow
-10.1%
Cash-on-Cash Return
3.8%
Cap rate
0.6%
Rent to Value Ratio
Active
$219,900
2
bds
|
2
ba
|
1,075
sqft
|
built
1988
3300 NW 46th St, Oakland Park, FL 33309
$-550
Cash flow
-13.0%
Cash-on-Cash Return
3.1%
Cap rate
0.9%
Rent to Value Ratio
Active
$283,000
2
bds
|
2
ba
|
960
sqft
|
built
1985
3086 S Oakland Forest Dr, Oakland Park, FL 33309
$-672
Cash flow
-12.4%
Cash-on-Cash Return
3.3%
Cap rate
0.8%
Rent to Value Ratio
Active
$490,000
4
bds
|
2
ba
|
2,138
sqft
|
built
1968
3401 NW 40th St, Lauderdale Lakes, FL 33309
$-560
Cash flow
-6.0%
Cash-on-Cash Return
4.8%
Cap rate
0.7%
Rent to Value Ratio
Active
$375,000
2
bds
|
1
ba
|
1,105
sqft
|
built
1961
341 NW 55th St, Oakland Park, FL 33309
$-654
Cash flow
-9.1%
Cash-on-Cash Return
4.1%
Cap rate
0.7%
Rent to Value Ratio
Active
$389,850
2
bds
|
1
ba
|
1,030
sqft
|
built
1968
2400 NW 55th St, Tamarac, FL 33309
$-1,259
Cash flow
-16.8%
Cash-on-Cash Return
2.3%
Cap rate
0.5%
Rent to Value Ratio
Active
$399,000
3
bds
|
3
ba
|
1,514
sqft
|
built
2010
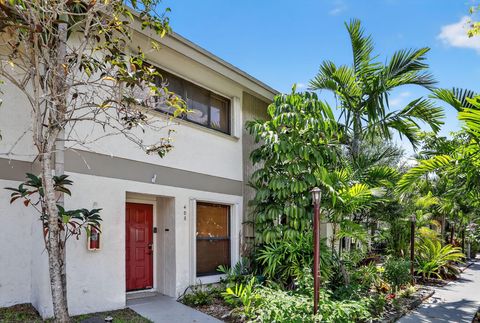
3257 NW 31st Ter, Oakland Park, FL 33309
$-944
Cash flow
-12.3%
Cash-on-Cash Return
3.3%
Cap rate
0.7%
Rent to Value Ratio
Active
$569,000
3
bds
|
2
ba
|
1,708
sqft
|
built
1970
1011 NW 45th Ct, Fort Lauderdale, FL 33309
$-868
Cash flow
-8.0%
Cash-on-Cash Return
4.3%
Cap rate
0.6%
Rent to Value Ratio

Active
$310,000
2
bds
|
3
ba
|
1,436
sqft
|
built
2012
2851 W Prospect Rd, Tamarac, FL 33309
$-796
Cash flow
-13.4%
Cash-on-Cash Return
3.1%
Cap rate
0.8%
Rent to Value Ratio
Active
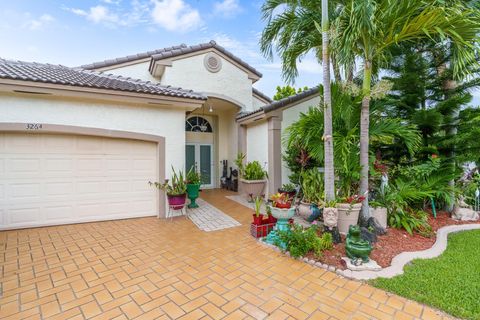
$750,000
3
bds
|
2
ba
|
1,769
sqft
|
built
1993
3264 NW 22nd Ave, Oakland Park, FL 33309
$-1,747
Cash flow
-12.2%
Cash-on-Cash Return
3.4%
Cap rate
0.5%
Rent to Value Ratio

Active
$219,000
2
bds
|
2
ba
|
975
sqft
|
built
1976
111 Royal Park Dr, Oakland Park, FL 33309
$-654
Cash flow
-15.6%
Cash-on-Cash Return
2.6%
Cap rate
1.0%
Rent to Value Ratio

Active
$209,900
2
bds
|
2
ba
|
975
sqft
|
built
1974
120 Royal Park Dr, Oakland Park, FL 33309
$-853
Cash flow
-21.2%
Cash-on-Cash Return
1.3%
Cap rate
1.0%
Rent to Value Ratio
Active
$279,000
2
bds
|
2
ba
|
960
sqft
|
built
1985
3060 S Oakland Forest Dr, Oakland Park, FL 33309
$-854
Cash flow
-16.0%
Cash-on-Cash Return
2.5%
Cap rate
0.8%
Rent to Value Ratio
Active
$179,000
2
bds
|
2
ba
|
1,075
sqft
|
built
1987
3100 NW 46th St, Oakland Park, FL 33309
$-364
Cash flow
-10.6%
Cash-on-Cash Return
3.7%
Cap rate
1.2%
Rent to Value Ratio
Active
$199,000
2
bds
|
2
ba
|
920
sqft
|
built
1981
109 Lake Emerald Dr, Oakland Park, FL 33309
$-875
Cash flow
-22.9%
Cash-on-Cash Return
0.9%
Cap rate
0.9%
Rent to Value Ratio
Active
$169,900
1
bds
|
1
ba
|
760
sqft
|
built
1974
3123 Oakland Shores Dr, Oakland Park, FL 33309
$-433
Cash flow
-13.3%
Cash-on-Cash Return
3.1%
Cap rate
0.9%
Rent to Value Ratio
Active
$559,000
3
bds
|
2
ba
|
1,312
sqft
|
built
1963
2020 NW 33rd Ct, Oakland Park, FL 33309
$-77
Cash flow
-0.7%
Cash-on-Cash Return
6.0%
Cap rate
0.8%
Rent to Value Ratio
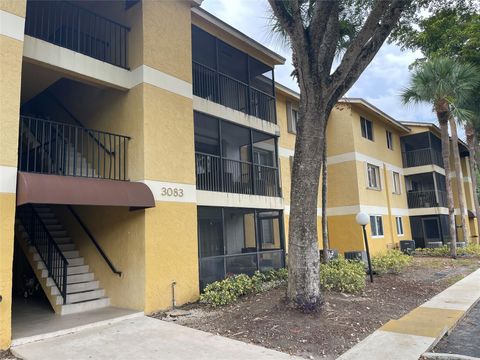
Active
$235,000
3
bds
|
2
ba
|
1,150
sqft
|
built
1986
3083 N Oakland Forest Dr, Oakland Park, FL 33309
$-202
Cash flow
-4.5%
Cash-on-Cash Return
5.1%
Cap rate
0.9%
Rent to Value Ratio
Active
$575,000
4
bds
|
3
ba
|
1,840
sqft
|
built
1956
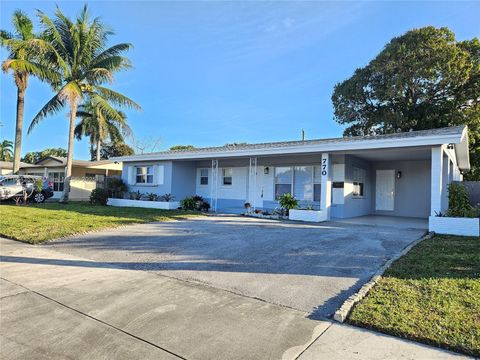
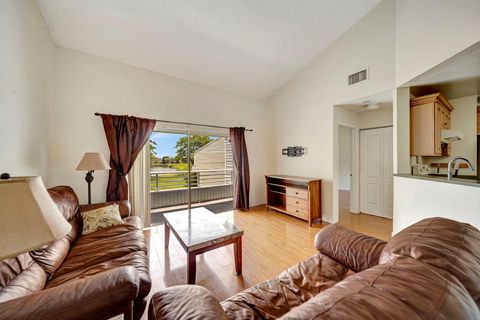
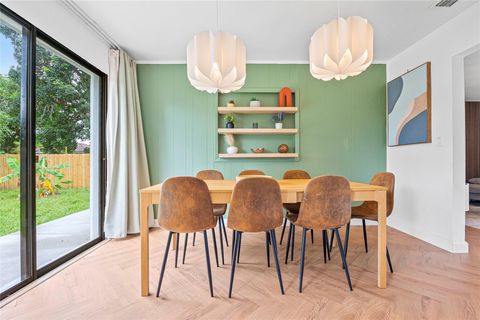
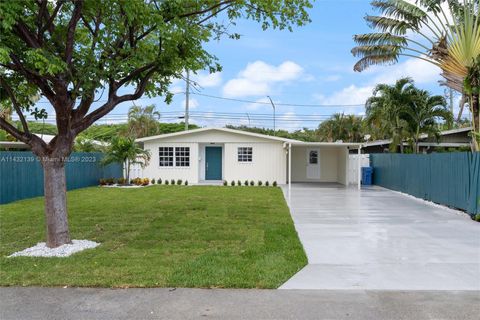
770 NW 38th St, Oakland Park, FL 33309
$-1,681
Cash flow
-15.3%
Cash-on-Cash Return
2.6%
Cap rate
0.5%
Rent to Value Ratio
Active
$220,000
2
bds
|
2
ba
|
1,250
sqft
|
built
1988
3461 NW 44th St, Lauderdale Lakes, FL 33309
$-398
Cash flow
-9.4%
Cash-on-Cash Return
4.0%
Cap rate
1.1%
Rent to Value Ratio
Active
$420,000
3
bds
|
1
ba
|
966
sqft
|
built
1957
121 NW 53rd Ct, Oakland Park, FL 33309
$-435
Cash flow
-5.4%
Cash-on-Cash Return
4.9%
Cap rate
0.8%
Rent to Value Ratio
Active
$467,000
3
bds
|
2
ba
|
1,563
sqft
|
built
1972
377 NW 49th St, Oakland Park, FL 33309
$-413
Cash flow
-4.6%
Cash-on-Cash Return
5.1%
Cap rate
0.8%
Rent to Value Ratio
Active
$395,000
2
bds
|
1
ba
|
966
sqft
|
built
1956
230 NW 52nd Ct, Oakland Park, FL 33309
$-598
Cash flow
-7.9%
Cash-on-Cash Return
4.3%
Cap rate
0.7%
Rent to Value Ratio
Active
$169,000
1
bds
|
2
ba
|
750
sqft
|
built
1974
103 Royal Park Dr, Oakland Park, FL 33309
$-328
Cash flow
-10.1%
Cash-on-Cash Return
3.8%
Cap rate
1.1%
Rent to Value Ratio

Active
$689,000
3
bds
|
2
ba
|
1,115
sqft
|
built
1971
3294 NW 6th Ave, Oakland Park, FL 33309
$-1,123
Cash flow
-8.5%
Cash-on-Cash Return
4.2%
Cap rate
0.7%
Rent to Value Ratio