33309 Investment Properties for Sale
Browse homes for sale and investment properties in 33309. Refine your search by price, property type, or more.
Best cash flowing properties in 33309
Active
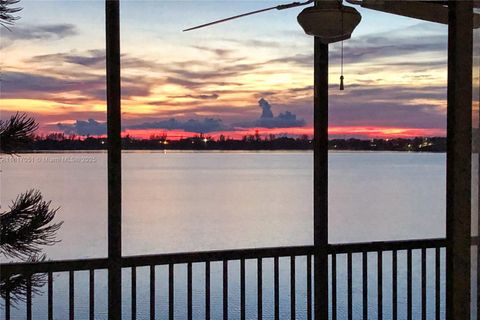
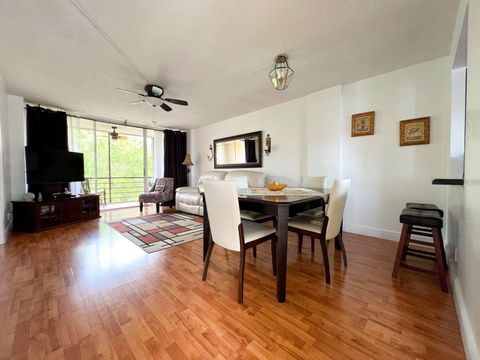
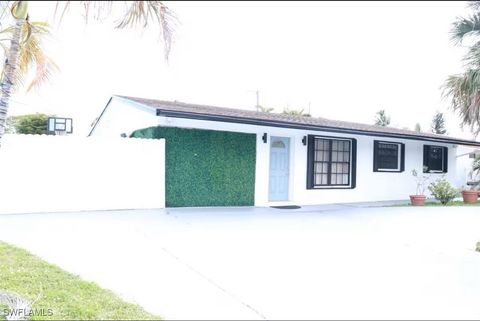
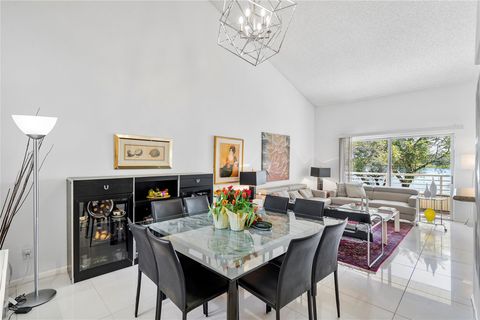
$260,000
2
bds
|
2
ba
|
920
sqft
|
built
1981
111 Lake Emerald Dr, Oakland Park, FL 33309
$-7
Cash flow
-0.1%
Cash-on-Cash Return
6.1%
Cap rate
0.9%
Rent to Value Ratio
Active
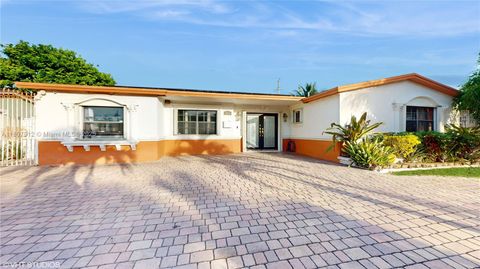
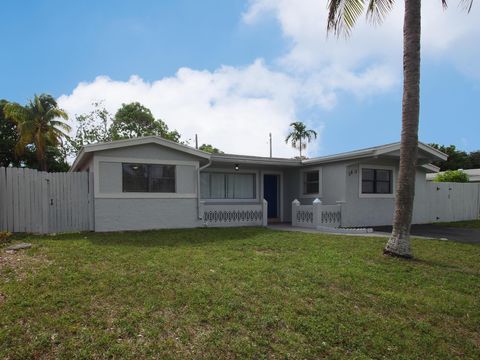
$475,000
3
bds
|
2
ba
|
2,192
sqft
|
built
1965
3920 NW 36th Ave, Lauderdale Lakes, FL 33309
$-133
Cash flow
-1.5%
Cash-on-Cash Return
5.8%
Cap rate
0.9%
Rent to Value Ratio
208 out of 227 properties for sale in 33309
Limited Results Shown
Create a free account, or log in to reveal all property listings and enjoy the complete experience.
Active
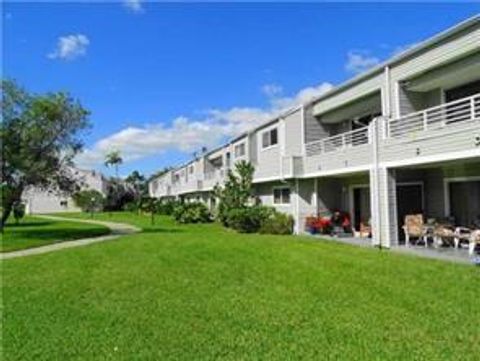
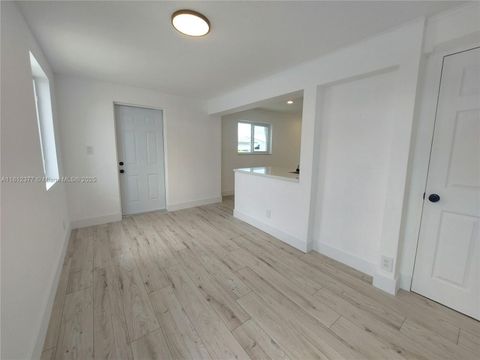
$210,000
2
bds
|
2
ba
|
1,096
sqft
|
built
1988
3409 NW 44th St, Lauderdale Lakes, FL 33309
$-646
Cash flow
-16.0%
Cash-on-Cash Return
2.5%
Cap rate
1.0%
Rent to Value Ratio
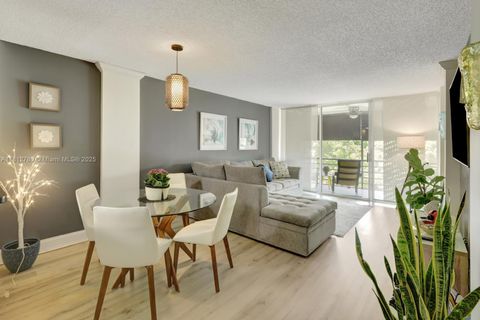
Active
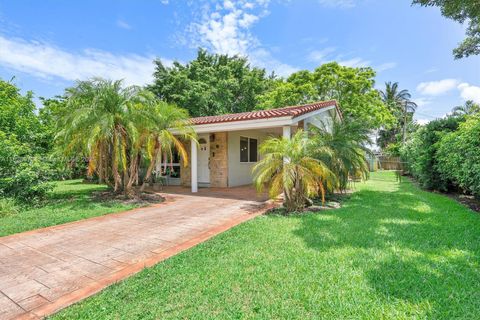
$470,000
2
bds
|
2
ba
|
970
sqft
|
built
1957
220 NW 35th Ct, Oakland Park, FL 33309
$-1,047
Cash flow
-11.6%
Cash-on-Cash Return
3.5%
Cap rate
0.6%
Rent to Value Ratio
Active
$675,000
3
bds
|
3
ba
|
1,774
sqft
|
built
2022
2138 Appleton Cir S, Oakland Park, FL 33309
$-2,165
Cash flow
-16.7%
Cash-on-Cash Return
2.3%
Cap rate
0.6%
Rent to Value Ratio
Active
$219,900
2
bds
|
2
ba
|
1,160
sqft
|
built
1990
3007 N Oakland Forest Dr, Oakland Park, FL 33309
$-603
Cash flow
-14.3%
Cash-on-Cash Return
2.9%
Cap rate
0.9%
Rent to Value Ratio
Active
$410,000
3
bds
|
3
ba
|
1,514
sqft
|
built
2013
3184 NW 32nd St, Oakland Park, FL 33309
$-951
Cash flow
-12.1%
Cash-on-Cash Return
3.4%
Cap rate
0.7%
Rent to Value Ratio
Active
$510,000
2
bds
|
2
ba
|
1,424
sqft
|
built
1963
1680 NW 43rd St, Oakland Park, FL 33309
$-1,612
Cash flow
-16.5%
Cash-on-Cash Return
2.4%
Cap rate
0.5%
Rent to Value Ratio
Active
$289,000
2
bds
|
2
ba
|
983
sqft
|
built
1988
3078 S Oakland Forest Dr, Oakland Park, FL 33309
$-650
Cash flow
-11.7%
Cash-on-Cash Return
3.4%
Cap rate
0.8%
Rent to Value Ratio
Active
$406,000
3
bds
|
2
ba
|
1,178
sqft
|
built
1961
4130 NW 12th Ave, Fort Lauderdale, FL 33309
$-778
Cash flow
-10.0%
Cash-on-Cash Return
3.8%
Cap rate
0.7%
Rent to Value Ratio
Active
$469,900
3
bds
|
2
ba
|
1,550
sqft
|
built
1969
3301 NW 42nd St, Lauderdale Lakes, FL 33309
$-1,114
Cash flow
-12.4%
Cash-on-Cash Return
3.3%
Cap rate
0.7%
Rent to Value Ratio
Active
$210,000
2
bds
|
2
ba
|
1,020
sqft
|
built
1988
3453 NW 44th St, Lauderdale Lakes, FL 33309
$-505
Cash flow
-12.5%
Cash-on-Cash Return
3.3%
Cap rate
1.0%
Rent to Value Ratio
Active
$299,999
2
bds
|
1
ba
|
999
sqft
|
built
1967
2309 NW 54th St, Tamarac, FL 33309
$-677
Cash flow
-11.8%
Cash-on-Cash Return
3.4%
Cap rate
0.7%
Rent to Value Ratio
Active
$320,000
2
bds
|
3
ba
|
1,100
sqft
|
built
1988
3082 S Oakland Forest Dr, Oakland Park, FL 33309
$-897
Cash flow
-14.6%
Cash-on-Cash Return
2.8%
Cap rate
0.8%
Rent to Value Ratio

Active
$399,000
2
bds
|
2
ba
|
1,148
sqft
|
built
1967
4249 NW 37th Ter, Lauderdale Lakes, FL 33309
$-374
Cash flow
-4.9%
Cash-on-Cash Return
5.0%
Cap rate
0.7%
Rent to Value Ratio
Active
$498,000
2
bds
|
2
ba
|
1,294
sqft
|
built
1973
3260 NW 66th St, Fort Lauderdale, FL 33309
$-1,123
Cash flow
-11.8%
Cash-on-Cash Return
3.4%
Cap rate
0.6%
Rent to Value Ratio
Active
$472,000
3
bds
|
2
ba
|
1,520
sqft
|
built
1967
4290 NW 38th Ave, Fort Lauderdale, FL 33309
$-1,037
Cash flow
-11.5%
Cash-on-Cash Return
3.5%
Cap rate
0.6%
Rent to Value Ratio
Active
$345,000
3
bds
|
2
ba
|
1,250
sqft
|
built
1986
3074 S Oakland Forest Dr, Oakland Park, FL 33309
$-915
Cash flow
-13.8%
Cash-on-Cash Return
3.0%
Cap rate
0.8%
Rent to Value Ratio
Active
$224,000
1
bds
|
1
ba
|
804
sqft
|
built
1992
2820 N Oakland Forest Dr, Oakland Park, FL 33309
$-553
Cash flow
-12.9%
Cash-on-Cash Return
3.2%
Cap rate
0.8%
Rent to Value Ratio
Active
$195,000
2
bds
|
2
ba
|
910
sqft
|
built
1981
201 Lake Pointe Dr, Oakland Park, FL 33309
$-454
Cash flow
-12.1%
Cash-on-Cash Return
3.4%
Cap rate
1.0%
Rent to Value Ratio
Active
$377,500
2
bds
|
1
ba
|
828
sqft
|
built
1956
5288 N Andrews Ave, Fort Lauderdale, FL 33309
$-722
Cash flow
-10.0%
Cash-on-Cash Return
3.9%
Cap rate
0.7%
Rent to Value Ratio
Active
$199,000
2
bds
|
2
ba
|
920
sqft
|
built
1981
109 Lake Emerald Dr, Oakland Park, FL 33309
$-796
Cash flow
-20.9%
Cash-on-Cash Return
1.3%
Cap rate
1.0%
Rent to Value Ratio
Active
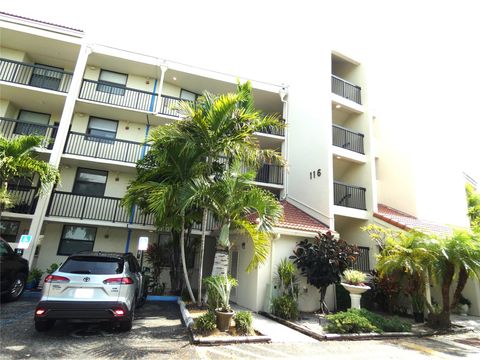
$175,000
2
bds
|
2
ba
|
920
sqft
|
built
1985
116 Lake Emerald Dr, Oakland Park, FL 33309
$-407
Cash flow
-12.1%
Cash-on-Cash Return
3.4%
Cap rate
1.1%
Rent to Value Ratio
Active
$229,900
1
bds
|
2
ba
|
990
sqft
|
built
1981
106 Lake Emerald Dr, Oakland Park, FL 33309
$-890
Cash flow
-20.2%
Cash-on-Cash Return
1.5%
Cap rate
0.9%
Rent to Value Ratio
Active
$125,000
1
bds
|
1
ba
|
750
sqft
|
built
1976
116 Royal Park Dr, Oakland Park, FL 33309
$-390
Cash flow
-16.3%
Cash-on-Cash Return
2.4%
Cap rate
1.4%
Rent to Value Ratio
Active
$237,000
2
bds
|
2
ba
|
975
sqft
|
built
1976
113 Royal Park Dr, Oakland Park, FL 33309
$-506
Cash flow
-11.1%
Cash-on-Cash Return
3.6%
Cap rate
0.9%
Rent to Value Ratio
Active
$453,900
4
bds
|
2
ba
|
1,701
sqft
|
built
1961
3611 NW 35th Ave, Lauderdale Lakes, FL 33309
$-1,030
Cash flow
-11.8%
Cash-on-Cash Return
3.4%
Cap rate
0.6%
Rent to Value Ratio
Active
$370,000
2
bds
|
1
ba
|
981
sqft
|
built
1965
4579 NW 16th Way, Tamarac, FL 33309
$-937
Cash flow
-13.2%
Cash-on-Cash Return
3.1%
Cap rate
0.6%
Rent to Value Ratio
Active
$174,000
1
bds
|
1
ba
|
750
sqft
|
built
1974
103 Royal Park Dr, Oakland Park, FL 33309
$-547
Cash flow
-16.4%
Cash-on-Cash Return
2.4%
Cap rate
1.0%
Rent to Value Ratio
Active
$649,900
4
bds
|
3
ba
|
1,260
sqft
|
built
1960
5750 N Andrews Ave, Oakland Park, FL 33309
$-1,224
Cash flow
-9.8%
Cash-on-Cash Return
3.9%
Cap rate
0.7%
Rent to Value Ratio
Active
$328,000
3
bds
|
3
ba
|
1,536
sqft
|
built
2009
2851 W Prospect Rd, Tamarac, FL 33309
$-931
Cash flow
-14.8%
Cash-on-Cash Return
2.7%
Cap rate
0.9%
Rent to Value Ratio
Active
$222,000
1
bds
|
1
ba
|
702
sqft
|
built
1987
5200 NW 31st Ave, Fort Lauderdale, FL 33309
$-412
Cash flow
-9.7%
Cash-on-Cash Return
3.9%
Cap rate
0.8%
Rent to Value Ratio
Active
$315,000
3
bds
|
3
ba
|
1,536
sqft
|
built
2008
2851 W Prospect Rd, Tamarac, FL 33309
$-688
Cash flow
-11.4%
Cash-on-Cash Return
3.5%
Cap rate
0.9%
Rent to Value Ratio
Active
$238,300
2
bds
|
2
ba
|
1,250
sqft
|
built
1988
3457 NW 44th St, Lauderdale Lakes, FL 33309
$-505
Cash flow
-11.1%
Cash-on-Cash Return
3.6%
Cap rate
0.8%
Rent to Value Ratio
Active
$258,000
2
bds
|
2
ba
|
1,020
sqft
|
built
1988
3425 NW 44th St, Lauderdale Lakes, FL 33309
$-893
Cash flow
-18.1%
Cash-on-Cash Return
2.0%
Cap rate
0.8%
Rent to Value Ratio
Active
$900,000
bds
|
0
ba
|
3,780
sqft
|
built
1973
3990 NW 30th Ter, Lauderdale Lakes, FL 33309
$-4,593
Cash flow
-26.6%
Cash-on-Cash Return
0.0%
Cap rate
0.2%
Rent to Value Ratio
Active
$190,000
2
bds
|
2
ba
|
890
sqft
|
built
1986
212 Lake Pointe Dr, Oakland Park, FL 33309
$-363
Cash flow
-10.0%
Cash-on-Cash Return
3.9%
Cap rate
1.1%
Rent to Value Ratio
Active
$145,000
2
bds
|
2
ba
|
920
sqft
|
built
1985
116 Lake Emerald Dr, Oakland Park, FL 33309
$-255
Cash flow
-9.2%
Cash-on-Cash Return
4.0%
Cap rate
1.4%
Rent to Value Ratio
Active
$170,000
2
bds
|
2
ba
|
880
sqft
|
built
1981
203 Lake Pointe Dr, Oakland Park, FL 33309
$-366
Cash flow
-11.2%
Cash-on-Cash Return
3.6%
Cap rate
1.2%
Rent to Value Ratio
Active
$474,000
4
bds
|
2
ba
|
1,846
sqft
|
built
1968
3226 NW 41st St, Lauderdale Lakes, FL 33309
$-1,119
Cash flow
-12.3%
Cash-on-Cash Return
3.3%
Cap rate
0.7%
Rent to Value Ratio