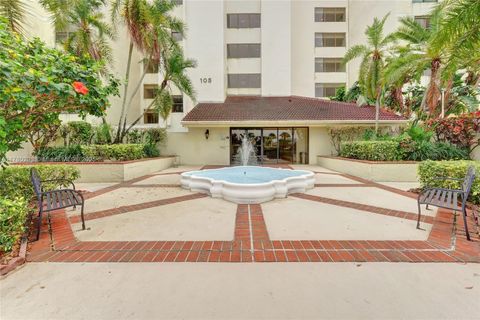
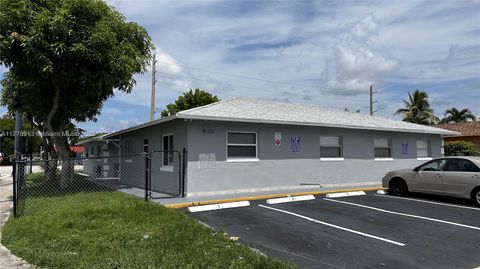
33309 Investment Properties for Sale
Browse homes for sale and investment properties in 33309. Refine your search by price, property type, or more.
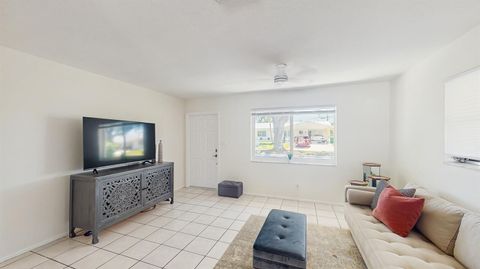
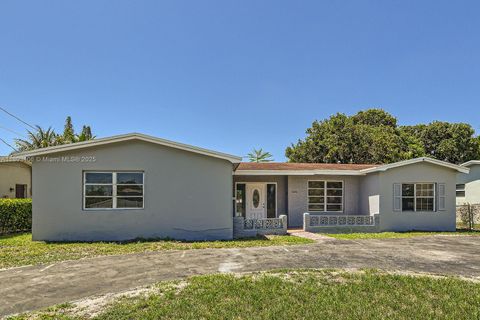
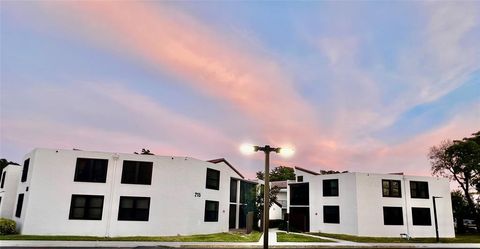
Best cash flowing properties in 33309
Active
$324,999
2
bds
|
1
ba
|
1,008
sqft
|
built
1969
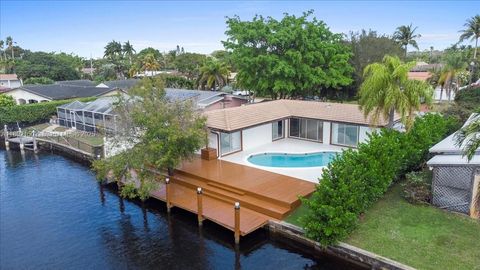
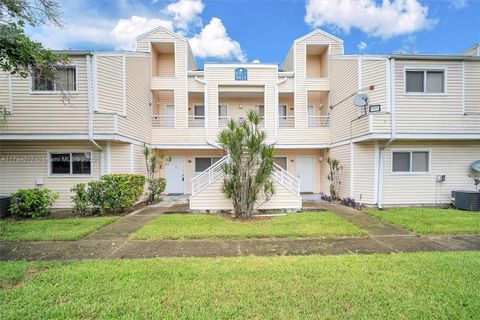
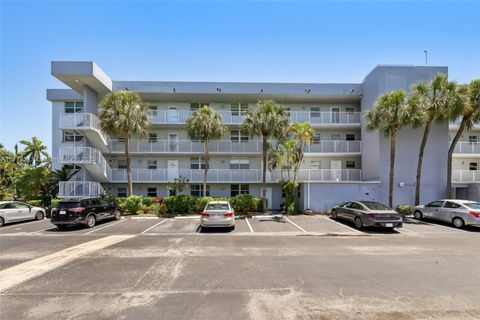
2507 NW 54th St, Tamarac, FL 33309
$-169
Cash flow
-2.7%
Cash-on-Cash Return
5.5%
Cap rate
0.8%
Rent to Value Ratio
Active
$480,000
3
bds
|
2
ba
|
1,194
sqft
|
built
1956
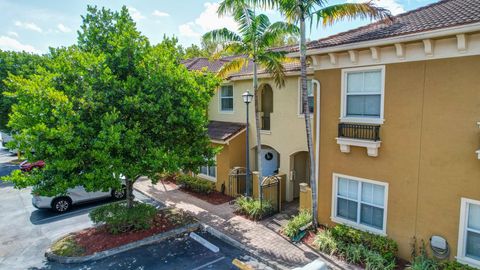
261 NW 47th Ct, Oakland Park, FL 33309
$-221
Cash flow
-2.4%
Cash-on-Cash Return
5.6%
Cap rate
0.7%
Rent to Value Ratio
211 out of 230 properties for sale in 33309
Limited Results Shown
Create a free account, or log in to reveal all property listings and enjoy the complete experience.
Active
$474,000
4
bds
|
2
ba
|
1,846
sqft
|
built
1968
3226 NW 41st St, Lauderdale Lakes, FL 33309
$-1,119
Cash flow
-12.3%
Cash-on-Cash Return
3.3%
Cap rate
0.7%
Rent to Value Ratio
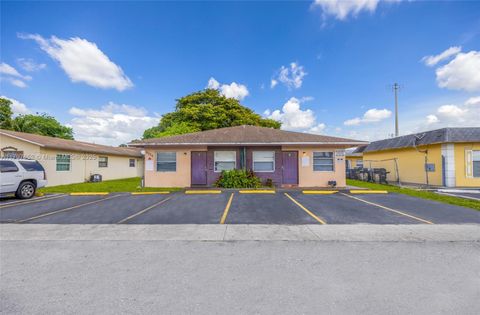
Active
$189,900
2
bds
|
2
ba
|
890
sqft
|
built
1985
212 Lake Pointe Dr, Oakland Park, FL 33309
$-496
Cash flow
-13.6%
Cash-on-Cash Return
3.0%
Cap rate
1.0%
Rent to Value Ratio
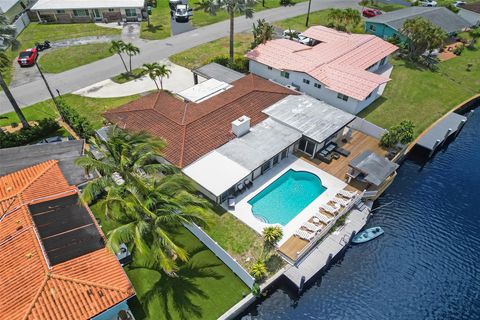
Active
$780,000
3
bds
|
2
ba
|
1,144
sqft
|
built
1963
1910 NW 36th St, Oakland Park, FL 33309
$-1,010
Cash flow
-6.8%
Cash-on-Cash Return
4.6%
Cap rate
0.7%
Rent to Value Ratio
Active
$379,900
3
bds
|
2
ba
|
1,028
sqft
|
built
1965
4556 NW 16th Way, Tamarac, FL 33309
$-1,038
Cash flow
-14.3%
Cash-on-Cash Return
2.9%
Cap rate
0.5%
Rent to Value Ratio
Active
$185,000
2
bds
|
2
ba
|
890
sqft
|
built
1984
210 Lake Pointe Dr, Oakland Park, FL 33309
$-482
Cash flow
-13.6%
Cash-on-Cash Return
3.0%
Cap rate
1.1%
Rent to Value Ratio
Active
$404,000
3
bds
|
2
ba
|
1,128
sqft
|
built
1962
4138 NW 12th Ter, Oakland Park, FL 33309
$-796
Cash flow
-10.3%
Cash-on-Cash Return
3.8%
Cap rate
0.7%
Rent to Value Ratio
Active
$840,000
5
bds
|
3
ba
|
2,471
sqft
|
built
1961
1961 NW 33rd St, Oakland Park, FL 33309
$-1,696
Cash flow
-10.5%
Cash-on-Cash Return
3.7%
Cap rate
0.7%
Rent to Value Ratio
Active
$969,000
bds
|
0
ba
|
3,400
sqft
|
built
1973
4020 NW 30th Ter, Lauderdale Lakes, FL 33309
$-4,783
Cash flow
-25.8%
Cash-on-Cash Return
0.2%
Cap rate
0.2%
Rent to Value Ratio
Active
$269,000
2
bds
|
2
ba
|
1,241
sqft
|
built
2006
2371 NW 33rd St, Oakland Park, FL 33309
$-681
Cash flow
-13.2%
Cash-on-Cash Return
3.1%
Cap rate
0.8%
Rent to Value Ratio
Active
$349,999
3
bds
|
1
ba
|
1,181
sqft
|
built
1965
4563 NW 16th Ter, Tamarac, FL 33309
$-361
Cash flow
-5.4%
Cash-on-Cash Return
4.9%
Cap rate
0.7%
Rent to Value Ratio
Active
$350,000
3
bds
|
3
ba
|
1,536
sqft
|
built
2007
2851 W Prospect Rd, Tamarac, FL 33309
$-1,049
Cash flow
-15.6%
Cash-on-Cash Return
2.6%
Cap rate
0.8%
Rent to Value Ratio
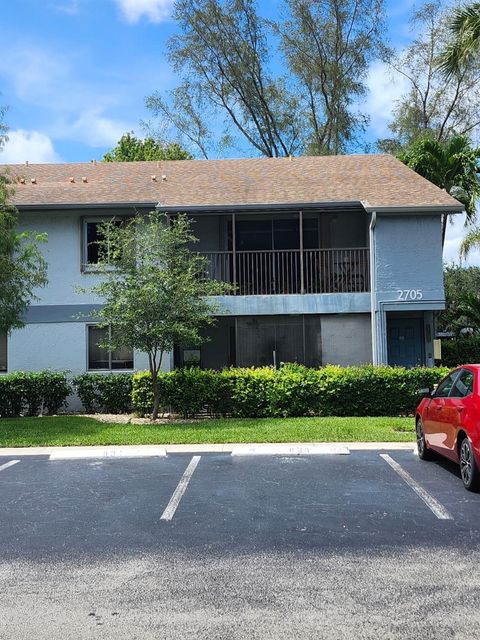
Active
$189,000
2
bds
|
2
ba
|
1,050
sqft
|
built
1984
2705 S Oakland Forest Dr, Oakland Park, FL 33309
$-284
Cash flow
-7.8%
Cash-on-Cash Return
4.3%
Cap rate
1.1%
Rent to Value Ratio
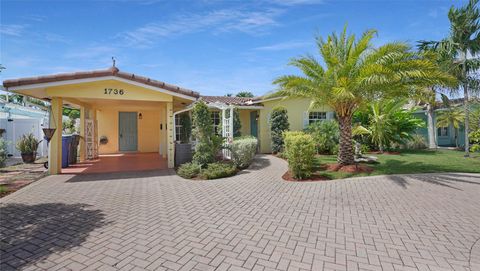
Active
$625,000
2
bds
|
2
ba
|
1,536
sqft
|
built
1964
1736 NW 39th St, Oakland Park, FL 33309
$-1,006
Cash flow
-8.4%
Cash-on-Cash Return
4.2%
Cap rate
0.6%
Rent to Value Ratio
Active
$177,000
2
bds
|
2
ba
|
890
sqft
|
built
1984
211 Lake Pointe Dr, Oakland Park, FL 33309
$-432
Cash flow
-12.7%
Cash-on-Cash Return
3.2%
Cap rate
1.0%
Rent to Value Ratio
Active
$159,000
2
bds
|
2
ba
|
975
sqft
|
built
1974
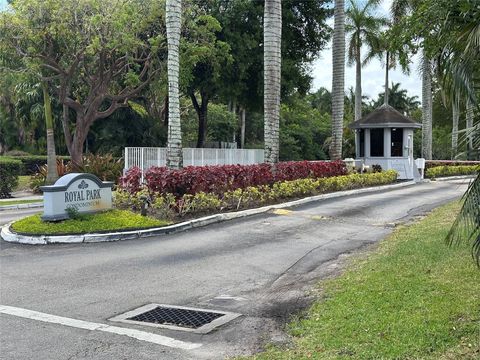
117 Royal Park Dr, Oakland Park, FL 33309
$-367
Cash flow
-12.0%
Cash-on-Cash Return
3.4%
Cap rate
1.3%
Rent to Value Ratio
Active
$220,000
2
bds
|
2
ba
|
1,020
sqft
|
built
2006
3449 NW 44th St, Lauderdale Lakes, FL 33309
$-636
Cash flow
-15.1%
Cash-on-Cash Return
2.7%
Cap rate
0.9%
Rent to Value Ratio
Active
$330,000
2
bds
|
3
ba
|
1,430
sqft
|
built
2008
2851 W Prospect Rd, Tamarac, FL 33309
$-1,029
Cash flow
-16.3%
Cash-on-Cash Return
2.4%
Cap rate
0.7%
Rent to Value Ratio
Active
$325,000
3
bds
|
3
ba
|
1,536
sqft
|
built
2009
2851 W Prospect Rd, Fort Lauderdale, FL 33309
$-912
Cash flow
-14.6%
Cash-on-Cash Return
2.8%
Cap rate
0.9%
Rent to Value Ratio
Active
$220,000
2
bds
|
2
ba
|
975
sqft
|
built
1976
114 Royal Park Dr, Oakland Park, FL 33309
$-342
Cash flow
-8.1%
Cash-on-Cash Return
4.3%
Cap rate
1.1%
Rent to Value Ratio
Active
$174,900
2
bds
|
2
ba
|
975
sqft
|
built
1974
113 Royal Park Dr, Oakland Park, FL 33309
$-643
Cash flow
-19.2%
Cash-on-Cash Return
1.7%
Cap rate
1.1%
Rent to Value Ratio
Active
$549,000
3
bds
|
2
ba
|
1,397
sqft
|
built
1956
81 NW 37th St, Oakland Park, FL 33309
$-1,058
Cash flow
-10.1%
Cash-on-Cash Return
3.8%
Cap rate
0.7%
Rent to Value Ratio
Active
$185,000
2
bds
|
2
ba
|
880
sqft
|
built
1981
202 Lake Pointe Dr, Oakland Park, FL 33309
$-417
Cash flow
-11.8%
Cash-on-Cash Return
3.4%
Cap rate
1.1%
Rent to Value Ratio
Active
$174,500
1
bds
|
1
ba
|
750
sqft
|
built
1974
101 Royal Park Dr, Oakland Park, FL 33309
$-549
Cash flow
-16.4%
Cash-on-Cash Return
2.4%
Cap rate
1.0%
Rent to Value Ratio
Active
$252,000
2
bds
|
2
ba
|
1,120
sqft
|
built
1981
111 Lake Emerald Dr, Oakland Park, FL 33309
$-703
Cash flow
-14.6%
Cash-on-Cash Return
2.8%
Cap rate
1.0%
Rent to Value Ratio
Active
$280,000
2
bds
|
2
ba
|
975
sqft
|
built
1976
112 Royal Park Dr, Oakland Park, FL 33309
$-978
Cash flow
-18.2%
Cash-on-Cash Return
2.0%
Cap rate
0.8%
Rent to Value Ratio
Active
$220,000
2
bds
|
2
ba
|
920
sqft
|
built
1981
110 Lake Emerald Dr, Oakland Park, FL 33309
$-859
Cash flow
-20.4%
Cash-on-Cash Return
1.5%
Cap rate
0.9%
Rent to Value Ratio
Active
$255,000
2
bds
|
2
ba
|
1,250
sqft
|
built
1982
105 Lake Emerald Dr, Oakland Park, FL 33309
$-912
Cash flow
-18.7%
Cash-on-Cash Return
1.9%
Cap rate
0.9%
Rent to Value Ratio
Active
$1,300,000
bds
|
0
ba
|
3,345
sqft
|
built
1973
4101 NW 30th Ter, Lauderdale Lakes, FL 33309
$-6,820
Cash flow
-27.4%
Cash-on-Cash Return
-0.1%
Cap rate
0.1%
Rent to Value Ratio
Active
$195,000
2
bds
|
2
ba
|
1,300
sqft
|
built
1981
106 Lake Emerald Dr, Oakland Park, FL 33309
$-877
Cash flow
-23.5%
Cash-on-Cash Return
0.8%
Cap rate
1.1%
Rent to Value Ratio
Active
$261,000
2
bds
|
2
ba
|
1,241
sqft
|
built
1991
2440 NW 33rd St, Oakland Park, FL 33309
$-504
Cash flow
-10.1%
Cash-on-Cash Return
3.8%
Cap rate
0.8%
Rent to Value Ratio
Active
$165,000
2
bds
|
2
ba
|
975
sqft
|
built
1976
113 Royal Park Dr, Oakland Park, FL 33309
$-366
Cash flow
-11.6%
Cash-on-Cash Return
3.5%
Cap rate
1.2%
Rent to Value Ratio
Active
$155,000
2
bds
|
2
ba
|
920
sqft
|
built
1981
109 Lake Emerald Dr, Oakland Park, FL 33309
$-422
Cash flow
-14.2%
Cash-on-Cash Return
2.9%
Cap rate
1.3%
Rent to Value Ratio
Active
$248,900
2
bds
|
1
ba
|
1,100
sqft
|
built
1972
3005 1/2 NW 68th St, Fort Lauderdale, FL 33309
$-570
Cash flow
-11.9%
Cash-on-Cash Return
3.4%
Cap rate
0.9%
Rent to Value Ratio
Active
$582,000
3
bds
|
2
ba
|
1,270
sqft
|
built
1959
1401 NW 45th St, Fort Lauderdale, FL 33309
$-1,680
Cash flow
-15.1%
Cash-on-Cash Return
2.7%
Cap rate
0.5%
Rent to Value Ratio
Active
$205,000
1
bds
|
1
ba
|
804
sqft
|
built
2006
2880 N Oakland Forest Dr, Oakland Park, FL 33309
$-482
Cash flow
-12.3%
Cash-on-Cash Return
3.3%
Cap rate
0.9%
Rent to Value Ratio
Active
$445,000
3
bds
|
2
ba
|
1,795
sqft
|
built
1968
3940 NW 34th Ave, Lauderdale Lakes, FL 33309
$-876
Cash flow
-10.3%
Cash-on-Cash Return
3.8%
Cap rate
0.7%
Rent to Value Ratio
Active
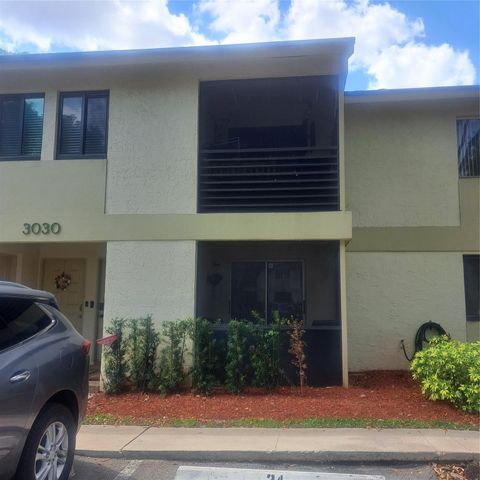
$185,000
2
bds
|
2
ba
|
800
sqft
|
built
1982
3030 NW 68th St, Fort Lauderdale, FL 33309
$-348
Cash flow
-9.8%
Cash-on-Cash Return
3.9%
Cap rate
1.0%
Rent to Value Ratio
Active
$1,199,000
bds
|
0
ba
|
2,484
sqft
|
built
1976
579 NW 41st St, Oakland Park, FL 33309
$-6,166
Cash flow
-26.8%
Cash-on-Cash Return
0.0%
Cap rate
0.2%
Rent to Value Ratio