33565 Investment Properties for Sale
Browse homes for sale and investment properties in 33565. Refine your search by price, property type, or more.
Best cash flowing properties in 33565

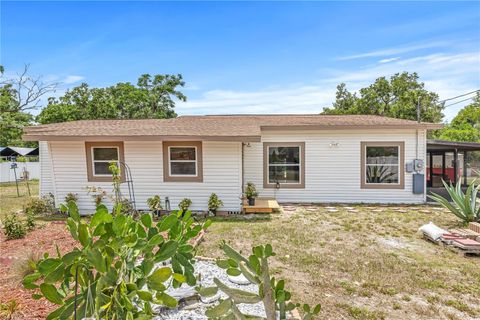
Active
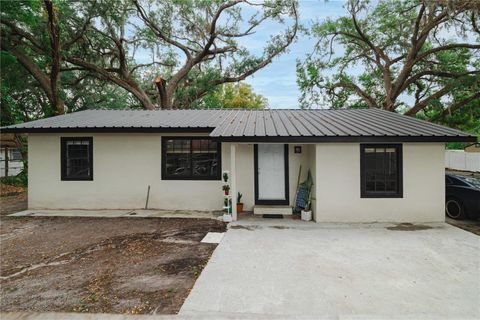
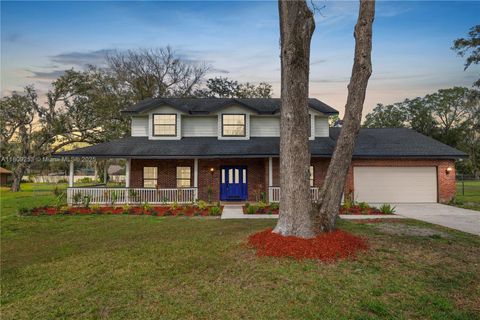
$375,000
4
bds
|
2
ba
|
1,803
sqft
|
built
1983
5602 N Dormany Rd, Plant City, FL 33565
$-160
Cash flow
-2.2%
Cash-on-Cash Return
5.6%
Cap rate
0.7%
Rent to Value Ratio
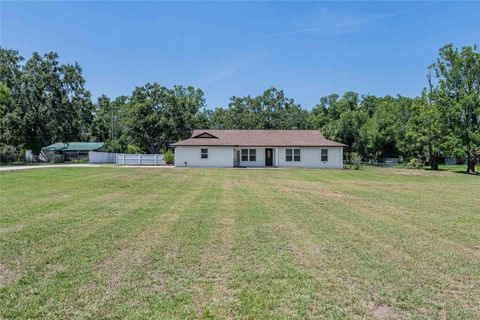
Active
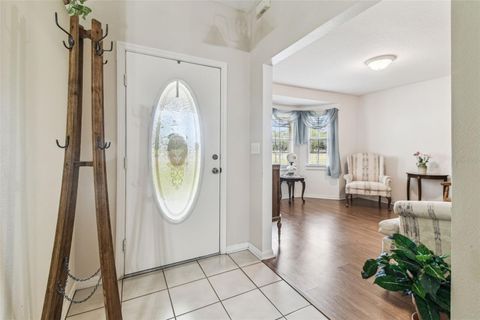
$304,900
3
bds
|
2
ba
|
1,104
sqft
|
built
1957
2804 Robinson Rd, Plant City, FL 33565
$-161
Cash flow
-2.8%
Cash-on-Cash Return
5.5%
Cap rate
0.7%
Rent to Value Ratio
45 out of 53 properties for sale in 33565
Limited Results Shown
Create a free account, or log in to reveal all property listings and enjoy the complete experience.

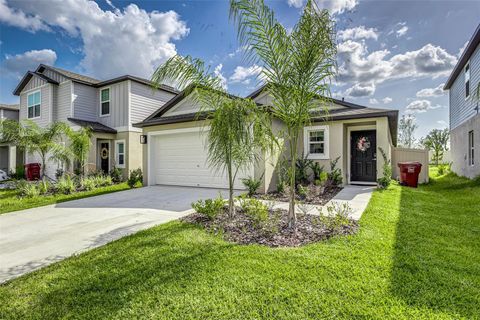
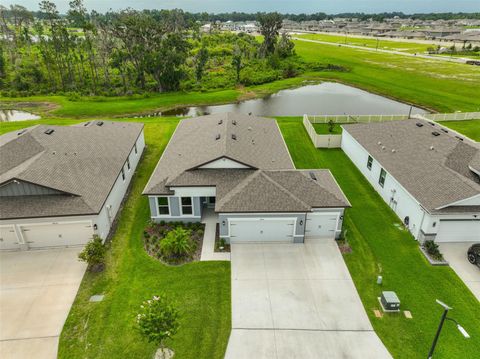
Active
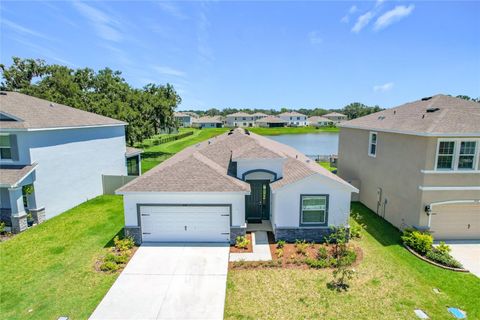
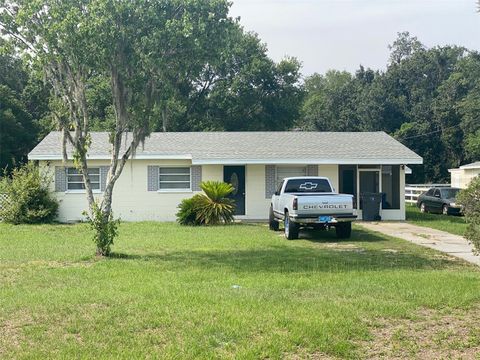
$430,000
4
bds
|
3
ba
|
2,035
sqft
|
built
2023
1505 Tropical Oasis Ave, Plant City, FL 33565
$-968
Cash flow
-11.7%
Cash-on-Cash Return
3.4%
Cap rate
0.7%
Rent to Value Ratio
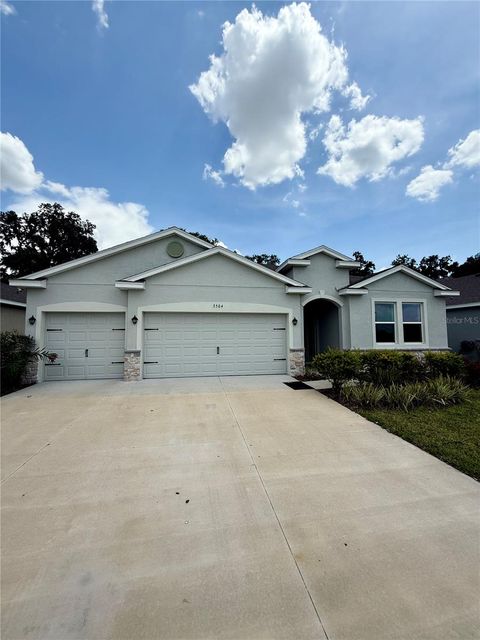
Active
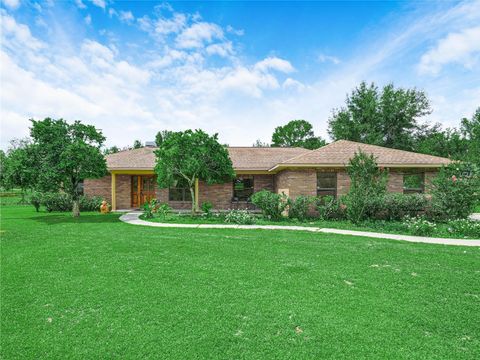
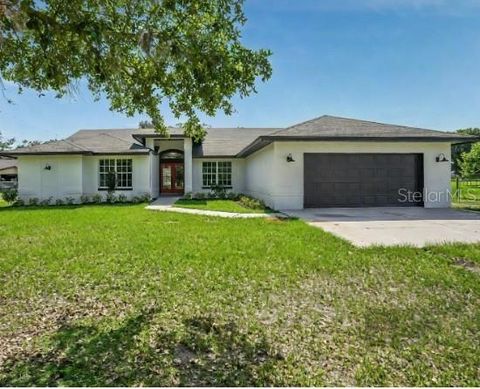
$399,900
4
bds
|
3
ba
|
2,035
sqft
|
built
2023
3508 Crescent Peak Way, Plant City, FL 33565
$-865
Cash flow
-11.3%
Cash-on-Cash Return
3.5%
Cap rate
0.7%
Rent to Value Ratio
Active
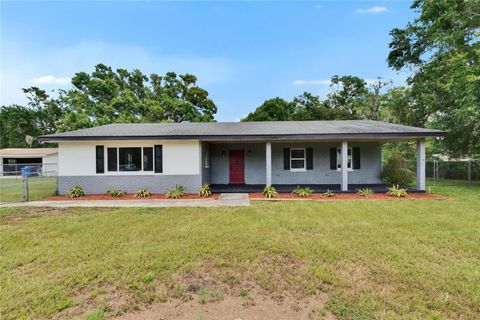
$460,000
3
bds
|
2
ba
|
2,002
sqft
|
built
1993
2815 Kebs Ln, Plant City, FL 33565
$-604
Cash flow
-6.9%
Cash-on-Cash Return
4.6%
Cap rate
0.6%
Rent to Value Ratio
Active
$435,000
4
bds
|
3
ba
|
2,160
sqft
|
built
1952
3212 Cork Rd, Plant City, FL 33565
$-1,223
Cash flow
-14.7%
Cash-on-Cash Return
2.8%
Cap rate
0.5%
Rent to Value Ratio
Active
$749,990
5
bds
|
4
ba
|
3,358
sqft
|
built
1989
5007 Booth Rd, Plant City, FL 33565
$-2,398
Cash flow
-16.7%
Cash-on-Cash Return
2.3%
Cap rate
0.3%
Rent to Value Ratio
Active
$324,000
3
bds
|
2
ba
|
1,461
sqft
|
built
2024
4035 Radiant Mountain Dr, Plant City, FL 33565
$-177
Cash flow
-2.9%
Cash-on-Cash Return
5.5%
Cap rate
0.9%
Rent to Value Ratio
Active
$595,000
4
bds
|
3
ba
|
2,225
sqft
|
built
1996
3018 Pemberton Trace Ct, Plant City, FL 33565
$-1,343
Cash flow
-11.8%
Cash-on-Cash Return
3.4%
Cap rate
0.5%
Rent to Value Ratio

Active
$449,900
5
bds
|
3
ba
|
2,522
sqft
|
built
2023
1680 Hazy Sea Dr, Plant City, FL 33565
$-1,101
Cash flow
-12.8%
Cash-on-Cash Return
3.2%
Cap rate
0.6%
Rent to Value Ratio
Active
$549,900
3
bds
|
2
ba
|
1,756
sqft
|
built
1977
5106 Five Acre Rd, Plant City, FL 33565
$-1,235
Cash flow
-11.7%
Cash-on-Cash Return
3.5%
Cap rate
0.6%
Rent to Value Ratio
Active
$465,000
3
bds
|
3
ba
|
2,228
sqft
|
built
2023
3816 N Maryland Ave, Plant City, FL 33565
$-821
Cash flow
-9.2%
Cash-on-Cash Return
4.0%
Cap rate
0.7%
Rent to Value Ratio

Active
$619,999
3
bds
|
2
ba
|
2,482
sqft
|
built
1995
6411 Barton Rd, Plant City, FL 33565
$-1,074
Cash flow
-9.0%
Cash-on-Cash Return
4.1%
Cap rate
0.6%
Rent to Value Ratio
Active
$414,900
4
bds
|
2
ba
|
2,104
sqft
|
built
1960
2233 Rightaway Ln, Plant City, FL 33565
$-723
Cash flow
-9.1%
Cash-on-Cash Return
4.1%
Cap rate
0.5%
Rent to Value Ratio
Active
$439,900
4
bds
|
3
ba
|
2,310
sqft
|
built
2023
3504 Crooked River Dr, Plant City, FL 33565
$-303
Cash flow
-3.6%
Cash-on-Cash Return
5.3%
Cap rate
0.7%
Rent to Value Ratio
Active
$625,000
4
bds
|
2
ba
|
2,360
sqft
|
built
1979
7608 Franklin Rd, Plant City, FL 33565
$-1,619
Cash flow
-13.5%
Cash-on-Cash Return
3.0%
Cap rate
0.5%
Rent to Value Ratio

Active
$650,000
3
bds
|
2
ba
|
1,904
sqft
|
built
1982
3705 Bruton Rd, Plant City, FL 33565
$-1,797
Cash flow
-14.4%
Cash-on-Cash Return
2.8%
Cap rate
0.4%
Rent to Value Ratio
Active
$669,700
4
bds
|
3
ba
|
0
sqft
|
built
1889
6604 Stafford Terrace Ave, Plant City, FL 33565
$-672
Cash flow
-5.2%
Cash-on-Cash Return
4.9%
Cap rate
0.7%
Rent to Value Ratio
Active
$635,000
3
bds
|
2
ba
|
1,709
sqft
|
built
1997
1202 Williams Rd, Plant City, FL 33565
$-1,506
Cash flow
-12.4%
Cash-on-Cash Return
3.3%
Cap rate
0.4%
Rent to Value Ratio
Active
$895,000
2
bds
|
2
ba
|
1,305
sqft
|
built
1958
4316 E Knights Griffin Rd, Plant City, FL 33565
$-3,372
Cash flow
-19.7%
Cash-on-Cash Return
1.6%
Cap rate
0.3%
Rent to Value Ratio
Active
$699,000
5
bds
|
4
ba
|
3,045
sqft
|
built
1996
1438 Mc Lin Dr, Plant City, FL 33565
$-1,897
Cash flow
-14.2%
Cash-on-Cash Return
2.9%
Cap rate
0.4%
Rent to Value Ratio
Active
$494,900
4
bds
|
4
ba
|
2,794
sqft
|
built
2023
3504 Golden Wheat Ln, Plant City, FL 33565
$-981
Cash flow
-10.3%
Cash-on-Cash Return
3.8%
Cap rate
0.6%
Rent to Value Ratio
Active
$779,900
4
bds
|
2
ba
|
2,708
sqft
|
built
1980
6709 W Knights Griffin Rd, Plant City, FL 33565
$-1,837
Cash flow
-12.3%
Cash-on-Cash Return
3.3%
Cap rate
0.5%
Rent to Value Ratio
Active
$499,000
3
bds
|
2
ba
|
1,908
sqft
|
built
1960
117 Myrtle Ln, Plant City, FL 33565
$-863
Cash flow
-9.0%
Cash-on-Cash Return
4.1%
Cap rate
0.5%
Rent to Value Ratio
Active
$790,000
4
bds
|
3
ba
|
3,100
sqft
|
built
1982
2780 E Sam Allen Rd, Plant City, FL 33565
$-1,509
Cash flow
-10.0%
Cash-on-Cash Return
3.9%
Cap rate
0.6%
Rent to Value Ratio
Active
$629,999
4
bds
|
3
ba
|
2,484
sqft
|
built
1992
7508 W Short Rd, Plant City, FL 33565
$-1,052
Cash flow
-8.7%
Cash-on-Cash Return
4.1%
Cap rate
0.6%
Rent to Value Ratio
Active
$734,900
3
bds
|
3
ba
|
2,456
sqft
|
built
2016
4702 Cypress Serenity Dr, Plant City, FL 33565
$-1,939
Cash flow
-13.8%
Cash-on-Cash Return
3.0%
Cap rate
0.5%
Rent to Value Ratio
Active
$487,950
3
bds
|
2
ba
|
1,695
sqft
|
built
1982
6005 Ike Smith Rd, Plant City, FL 33565
$-594
Cash flow
-6.4%
Cash-on-Cash Return
4.7%
Cap rate
0.6%
Rent to Value Ratio
Active
$490,000
3
bds
|
3
ba
|
2,100
sqft
|
built
1990
7606 Four Pines Rd, Plant City, FL 33565
$-712
Cash flow
-7.6%
Cash-on-Cash Return
4.4%
Cap rate
0.6%
Rent to Value Ratio
Active
$740,000
4
bds
|
3
ba
|
2,193
sqft
|
built
1978
4142 El Shaddiai Sq, Plant City, FL 33565
$-1,999
Cash flow
-14.1%
Cash-on-Cash Return
2.9%
Cap rate
0.4%
Rent to Value Ratio
Active
$2,600,000
5
bds
|
4
ba
|
4,577
sqft
|
built
2015
3709 Gallagher Rd, Plant City, FL 33565
$-11,657
Cash flow
-23.4%
Cash-on-Cash Return
0.8%
Cap rate
0.2%
Rent to Value Ratio
Active
$630,000
5
bds
|
4
ba
|
3,095
sqft
|
built
1976
4902 Five Acre Rd, Plant City, FL 33565
$-1,408
Cash flow
-11.7%
Cash-on-Cash Return
3.5%
Cap rate
0.5%
Rent to Value Ratio
Active
$699,900
3
bds
|
3
ba
|
1,883
sqft
|
built
1970
4814 Knights Loop, Plant City, FL 33565
$-2,103
Cash flow
-15.7%
Cash-on-Cash Return
2.5%
Cap rate
0.4%
Rent to Value Ratio
Active
$695,000
4
bds
|
3
ba
|
2,841
sqft
|
built
1988
7843 Shoupe Rd, Plant City, FL 33565
$-1,613
Cash flow
-12.1%
Cash-on-Cash Return
3.4%
Cap rate
0.5%
Rent to Value Ratio
Active
$470,000
4
bds
|
4
ba
|
2,798
sqft
|
built
2023
3528 Golden Wheat Ln, Plant City, FL 33565
$-1,180
Cash flow
-13.1%
Cash-on-Cash Return
3.1%
Cap rate
0.7%
Rent to Value Ratio
Active
$809,900
5
bds
|
3
ba
|
2,861
sqft
|
built
2002
4411 Miley Rd, Plant City, FL 33565
$-1,961
Cash flow
-12.6%
Cash-on-Cash Return
3.2%
Cap rate
0.5%
Rent to Value Ratio
Active
$415,000
4
bds
|
3
ba
|
2,633
sqft
|
built
2022
1454 Tahitian Sunrise Dr, Plant City, FL 33565
$-795
Cash flow
-10.0%
Cash-on-Cash Return
3.8%
Cap rate
0.7%
Rent to Value Ratio
Active
$745,000
4
bds
|
4
ba
|
3,312
sqft
|
built
1992
7705 Four Pines Rd, Plant City, FL 33565
$-1,593
Cash flow
-11.2%
Cash-on-Cash Return
3.6%
Cap rate
0.5%
Rent to Value Ratio
Active
$525,000
4
bds
|
2
ba
|
2,273
sqft
|
built
1993
6819 Stafford Rd, Plant City, FL 33565
$-699
Cash flow
-6.9%
Cash-on-Cash Return
4.5%
Cap rate
0.6%
Rent to Value Ratio
Active
$350,000
4
bds
|
2
ba
|
1,844
sqft
|
built
2022
3510 N Maryland Ave, Plant City, FL 33565
$-757
Cash flow
-11.3%
Cash-on-Cash Return
3.6%
Cap rate
0.7%
Rent to Value Ratio