43130 Investment Properties for Sale
Browse homes for sale and investment properties in 43130. Refine your search by price, property type, or more.
Best cash flowing properties in 43130

Active
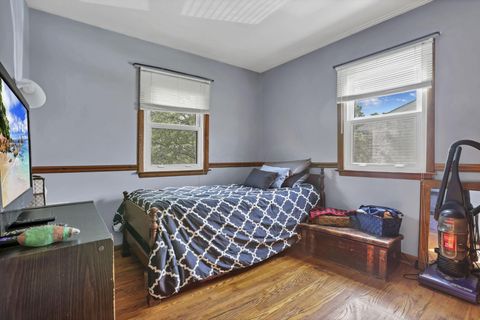
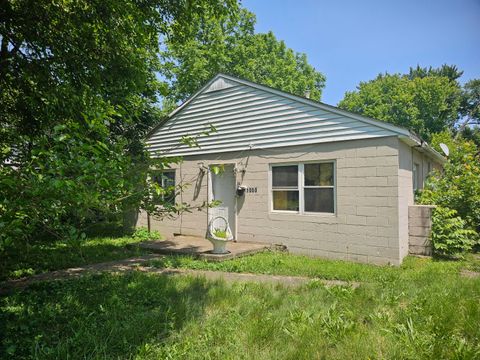
$164,900
3
bds
|
2
ba
|
1,460
sqft
|
built
1900
610 W Wheeling St, Lancaster, OH 43130
$222
Cash flow
7.0%
Cash-on-Cash Return
7.9%
Cap rate
1.1%
Rent to Value Ratio

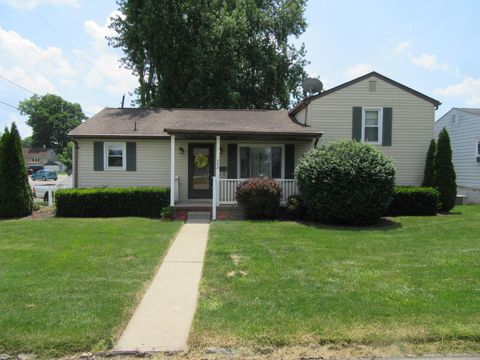
Active
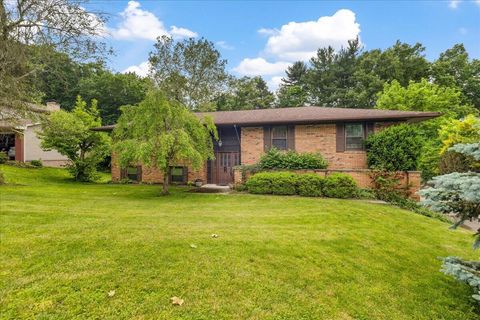
$220,000
2
bds
|
2
ba
|
1,444
sqft
|
built
1900
526 N Columbus St, Lancaster, OH 43130
$117
Cash flow
2.8%
Cash-on-Cash Return
6.9%
Cap rate
0.9%
Rent to Value Ratio
18 out of 82 properties for sale in 43130
Limited Results Shown
Create a free account, or log in to reveal all property listings and enjoy the complete experience.
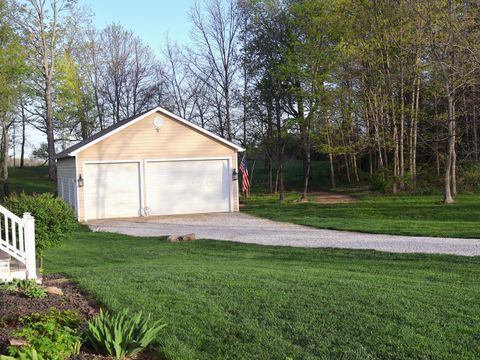
Active
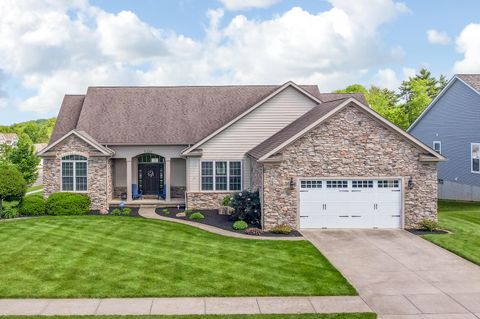
$260,000
4
bds
|
2
ba
|
1,210
sqft
|
built
1965
1636 W Mulberry St, Lancaster, OH 43130
$-272
Cash flow
-5.5%
Cash-on-Cash Return
5.0%
Cap rate
0.7%
Rent to Value Ratio
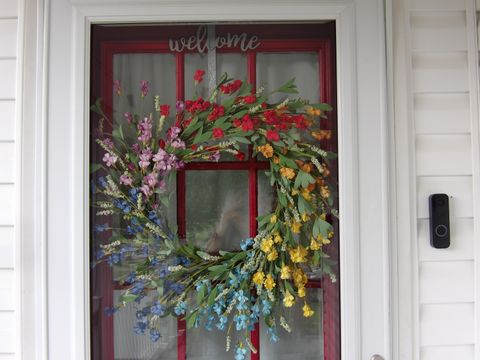
Active
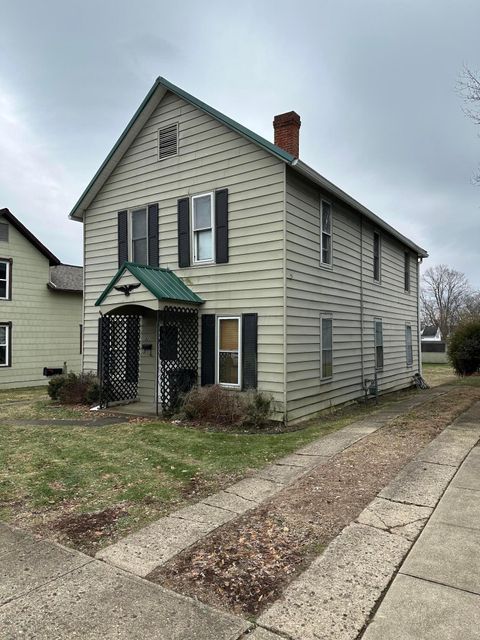
$364,900
3
bds
|
3
ba
|
2,168
sqft
|
built
1974
164 Terrace Ct, Lancaster, OH 43130
$-396
Cash flow
-5.7%
Cash-on-Cash Return
5.0%
Cap rate
0.7%
Rent to Value Ratio
Active
$599,900
4
bds
|
4
ba
|
3,532
sqft
|
built
2009
2036 Amber Wood Pl, Lancaster, OH 43130
$-1,285
Cash flow
-11.2%
Cash-on-Cash Return
3.7%
Cap rate
0.6%
Rent to Value Ratio
Active
$219,900
2
bds
|
0
ba
|
0
sqft
|
built
1900
662 Frederick St, Lancaster, OH 43130
$-427
Cash flow
-10.1%
Cash-on-Cash Return
3.9%
Cap rate
0.5%
Rent to Value Ratio
Active
$106,400
4
bds
|
2
ba
|
812
sqft
|
built
1960
1000 Goodwin Ave, Lancaster, OH 43130
$75
Cash flow
3.7%
Cash-on-Cash Return
7.1%
Cap rate
1.3%
Rent to Value Ratio

Active
$539,900
5
bds
|
2
ba
|
2,863
sqft
|
built
1972
5350 Brook Rd NW, Lancaster, OH 43130
$-1,694
Cash flow
-16.4%
Cash-on-Cash Return
2.5%
Cap rate
0.4%
Rent to Value Ratio
Active
$164,900
3
bds
|
2
ba
|
1,460
sqft
|
built
1900
610 W Wheeling St, Lancaster, OH 43130
$222
Cash flow
7.0%
Cash-on-Cash Return
7.9%
Cap rate
1.1%
Rent to Value Ratio
Active
$229,900
3
bds
|
2
ba
|
1,484
sqft
|
built
1958
302 W Hubert Ave, Lancaster, OH 43130
$-26
Cash flow
-0.6%
Cash-on-Cash Return
6.1%
Cap rate
0.9%
Rent to Value Ratio
Active
$220,000
2
bds
|
2
ba
|
1,444
sqft
|
built
1900
526 N Columbus St, Lancaster, OH 43130
$117
Cash flow
2.8%
Cash-on-Cash Return
6.9%
Cap rate
0.9%
Rent to Value Ratio

Active
$499,900
4
bds
|
3
ba
|
3,868
sqft
|
built
2018
1705 Bent Creek Dr, Lancaster, OH 43130
$-838
Cash flow
-8.7%
Cash-on-Cash Return
4.3%
Cap rate
0.6%
Rent to Value Ratio

Active
$1,499,999
8
bds
|
6
ba
|
8,977
sqft
|
built
1998
2300 Stonewall Cemetery Rd SW, Lancaster, OH 43130
$-5,490
Cash flow
-19.1%
Cash-on-Cash Return
1.9%
Cap rate
0.3%
Rent to Value Ratio
Active
$849,000
5
bds
|
4
ba
|
5,846
sqft
|
built
2014
4225 Election House Rd NW, Lancaster, OH 43130
$-2,457
Cash flow
-15.1%
Cash-on-Cash Return
2.8%
Cap rate
0.5%
Rent to Value Ratio
Active
$229,900
2
bds
|
1
ba
|
1,020
sqft
|
built
1914
1202 W Mulberry St, Lancaster, OH 43130
$-305
Cash flow
-6.9%
Cash-on-Cash Return
4.7%
Cap rate
0.6%
Rent to Value Ratio
Active
$639,900
4
bds
|
4
ba
|
3,780
sqft
|
built
2004
1917 Nichole Cir, Lancaster, OH 43130
$-1,673
Cash flow
-13.6%
Cash-on-Cash Return
3.1%
Cap rate
0.5%
Rent to Value Ratio
Active
$174,900
2
bds
|
1
ba
|
696
sqft
|
built
1950
956 Harrison Ave, Lancaster, OH 43130
$-177
Cash flow
-5.3%
Cash-on-Cash Return
5.0%
Cap rate
0.7%
Rent to Value Ratio
Active
$299,999
3
bds
|
2
ba
|
1,600
sqft
|
built
1939
356 Edgewood Ave, Lancaster, OH 43130
$-733
Cash flow
-12.7%
Cash-on-Cash Return
3.3%
Cap rate
0.5%
Rent to Value Ratio

Active
$574,000
3
bds
|
3
ba
|
1,976
sqft
|
built
1995
43 Blue Valley Rd SW, Lancaster, OH 43130
$-1,661
Cash flow
-15.1%
Cash-on-Cash Return
2.8%
Cap rate
0.4%
Rent to Value Ratio

Active
$106,000
2
bds
|
1
ba
|
468
sqft
|
built
1900
234 Park St, Lancaster, OH 43130
$21
Cash flow
1.0%
Cash-on-Cash Return
6.5%
Cap rate
0.8%
Rent to Value Ratio