46218 Investment Properties for Sale
Browse homes for sale and investment properties in 46218. Refine your search by price, property type, or more.
Best cash flowing properties in 46218

Active
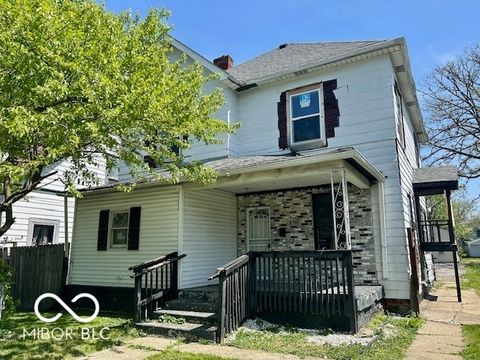
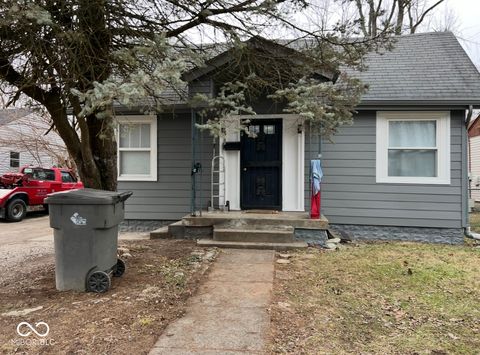
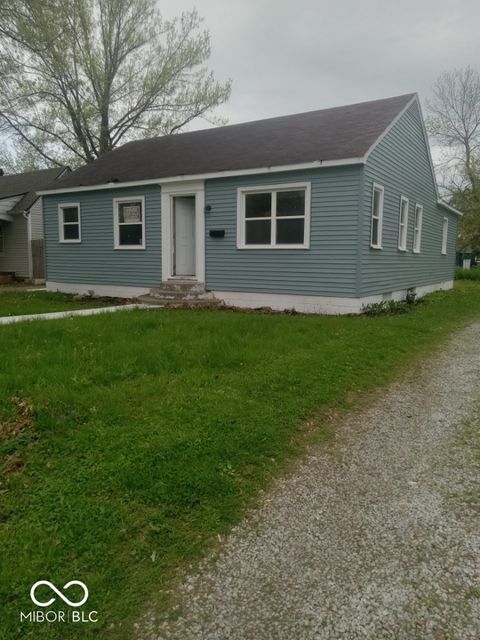
$94,900
2
bds
|
1
ba
|
1,260
sqft
|
built
1947
3101 N Temple Ave, Indianapolis, IN 46218
$402
Cash flow
22.1%
Cash-on-Cash Return
11.3%
Cap rate
1.4%
Rent to Value Ratio
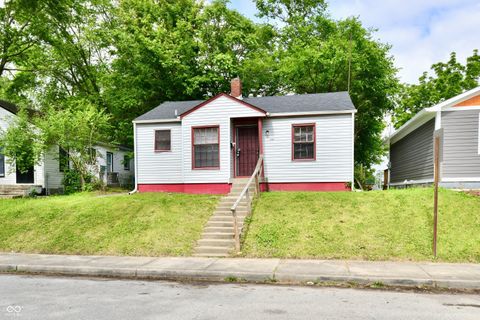
Active
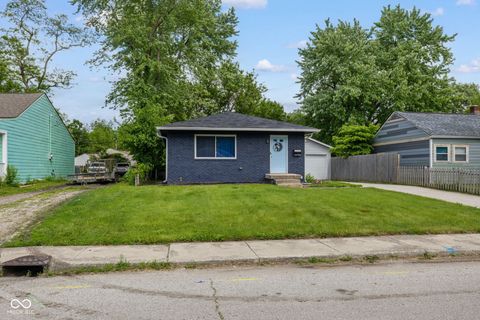
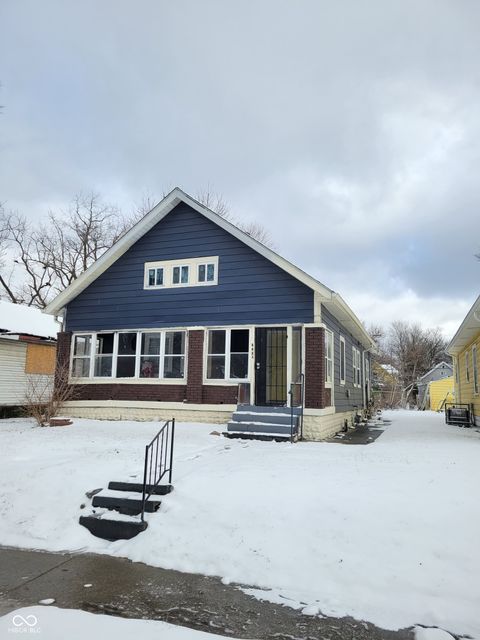
$105,000
4
bds
|
2
ba
|
1,876
sqft
|
built
1876
2701 N Gale St, Indianapolis, IN 46218
$280
Cash flow
13.9%
Cash-on-Cash Return
9.5%
Cap rate
1.1%
Rent to Value Ratio
106 out of 110 properties for sale in 46218
Limited Results Shown
Create a free account, or log in to reveal all property listings and enjoy the complete experience.
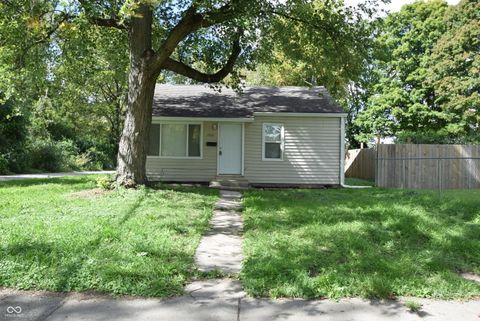
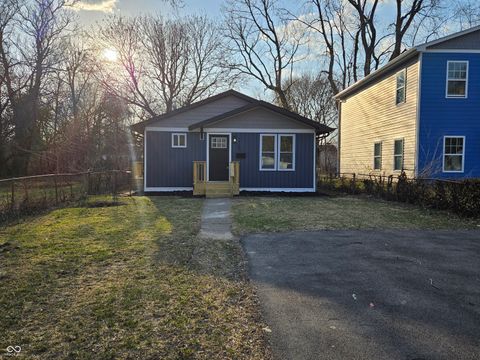
Active
$175,000
3
bds
|
2
ba
|
1,104
sqft
|
built
1970
3125 N Tacoma Ave, Indianapolis, IN 46218
$190
Cash flow
5.7%
Cash-on-Cash Return
7.6%
Cap rate
0.9%
Rent to Value Ratio
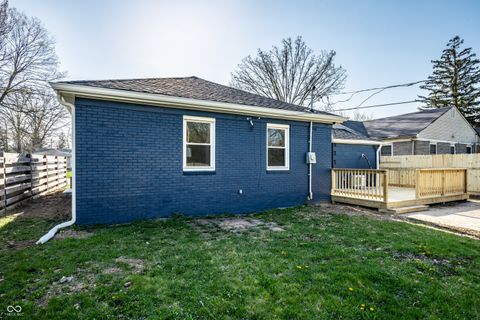
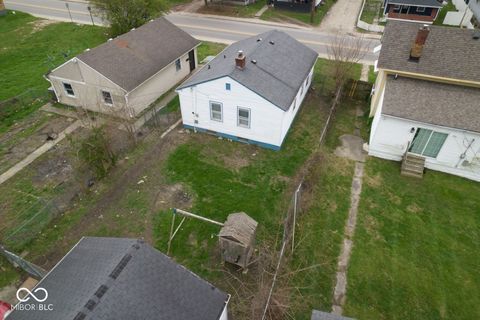
Active
$115,000
2
bds
|
1
ba
|
696
sqft
|
built
1950
1902 N Colorado Ave, Indianapolis, IN 46218
$228
Cash flow
10.3%
Cash-on-Cash Return
8.6%
Cap rate
1.0%
Rent to Value Ratio
Active
$220,000
5
bds
|
2
ba
|
2,280
sqft
|
built
1949
3712 N Olney St, Indianapolis, IN 46218
$-252
Cash flow
-6.0%
Cash-on-Cash Return
4.9%
Cap rate
0.6%
Rent to Value Ratio
Pending
$165,000
3
bds
|
1
ba
|
960
sqft
|
built
1952
1868 N Hawthorne Ln, Indianapolis, IN 46218
$105
Cash flow
3.3%
Cash-on-Cash Return
7.0%
Cap rate
0.8%
Rent to Value Ratio
Active
$209,999
3
bds
|
2
ba
|
1,473
sqft
|
built
1947
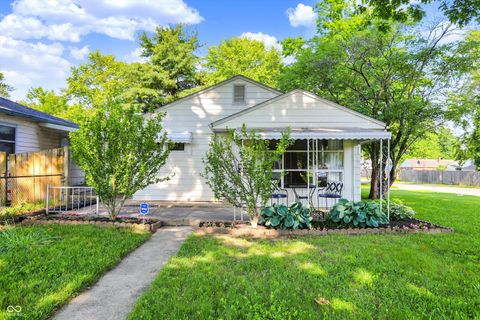
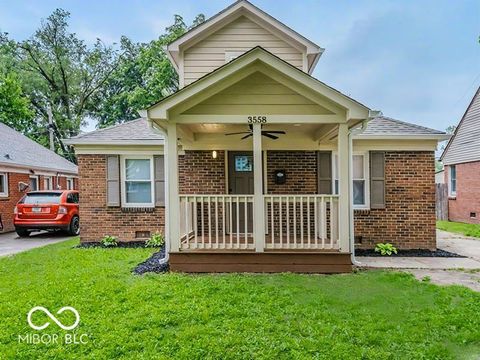
3558 N Gladstone Ave, Indianapolis, IN 46218
$-268
Cash flow
-6.7%
Cash-on-Cash Return
4.7%
Cap rate
0.6%
Rent to Value Ratio
Active
$122,000
3
bds
|
1
ba
|
1,816
sqft
|
built
1950
1741 N Riley Ave, Indianapolis, IN 46218
$260
Cash flow
11.1%
Cash-on-Cash Return
8.8%
Cap rate
1.1%
Rent to Value Ratio

Active
$154,900
3
bds
|
1
ba
|
1,104
sqft
|
built
1971
1948 Bloyd Ave, Indianapolis, IN 46218
$-50
Cash flow
-1.7%
Cash-on-Cash Return
5.9%
Cap rate
0.7%
Rent to Value Ratio
Active
$94,900
2
bds
|
1
ba
|
1,260
sqft
|
built
1947
3101 N Temple Ave, Indianapolis, IN 46218
$402
Cash flow
22.1%
Cash-on-Cash Return
11.3%
Cap rate
1.4%
Rent to Value Ratio
Active
$200,000
2
bds
|
2
ba
|
720
sqft
|
built
1948
1624 N Whittier Pl, Indianapolis, IN 46218
$129
Cash flow
3.4%
Cash-on-Cash Return
7.0%
Cap rate
0.9%
Rent to Value Ratio
Active
$200,000
4
bds
|
2
ba
|
1,752
sqft
|
built
1930
1722 N Parker Ave, Indianapolis, IN 46218
$60
Cash flow
1.6%
Cash-on-Cash Return
6.6%
Cap rate
0.8%
Rent to Value Ratio

Active
$110,000
3
bds
|
1
ba
|
836
sqft
|
built
1910
2221 Langley Ave, Indianapolis, IN 46218
$254
Cash flow
12.0%
Cash-on-Cash Return
9.0%
Cap rate
1.1%
Rent to Value Ratio
Active
$155,000
3
bds
|
1
ba
|
864
sqft
|
built
1956
5778 E 30th St, Indianapolis, IN 46218
$-119
Cash flow
-4.0%
Cash-on-Cash Return
5.3%
Cap rate
0.6%
Rent to Value Ratio
Active
$99,000
2
bds
|
0
ba
|
0
sqft
|
built
1948
2870 Stuart St, Indianapolis, IN 46218
$-103
Cash flow
-5.4%
Cash-on-Cash Return
5.0%
Cap rate
0.6%
Rent to Value Ratio
Active
$105,000
4
bds
|
2
ba
|
1,876
sqft
|
built
1876
2701 N Gale St, Indianapolis, IN 46218
$280
Cash flow
13.9%
Cash-on-Cash Return
9.5%
Cap rate
1.1%
Rent to Value Ratio
Active
$114,900
2
bds
|
1
ba
|
938
sqft
|
built
1928
3031 E 38th St, Indianapolis, IN 46218
$159
Cash flow
7.2%
Cash-on-Cash Return
7.9%
Cap rate
1.0%
Rent to Value Ratio
Active
$139,900
3
bds
|
1
ba
|
1,152
sqft
|
built
1930
3306 N Drexel Ave, Indianapolis, IN 46218
$98
Cash flow
3.7%
Cash-on-Cash Return
7.1%
Cap rate
0.9%
Rent to Value Ratio
Active
$180,000
3
bds
|
2
ba
|
1,528
sqft
|
built
1955
2309 N Dearborn St, Indianapolis, IN 46218
$26
Cash flow
0.8%
Cash-on-Cash Return
6.4%
Cap rate
0.8%
Rent to Value Ratio
Active
$182,500
3
bds
|
2
ba
|
912
sqft
|
built
1962
3262 Orchard Ave, Indianapolis, IN 46218
$13
Cash flow
0.4%
Cash-on-Cash Return
6.4%
Cap rate
0.8%
Rent to Value Ratio
Active
$98,000
2
bds
|
1
ba
|
836
sqft
|
built
1950
3924 E 30th St, Indianapolis, IN 46218
$247
Cash flow
13.1%
Cash-on-Cash Return
9.3%
Cap rate
1.1%
Rent to Value Ratio
Active
$169,999
3
bds
|
1
ba
|
912
sqft
|
built
1954
1844 N Riley Ave, Indianapolis, IN 46218
$78
Cash flow
2.4%
Cash-on-Cash Return
6.8%
Cap rate
0.8%
Rent to Value Ratio
Pending
$170,000
2
bds
|
1
ba
|
720
sqft
|
built
1952
5473 E 18th St, Indianapolis, IN 46218
$216
Cash flow
6.6%
Cash-on-Cash Return
7.8%
Cap rate
0.9%
Rent to Value Ratio
Active
$180,000
3
bds
|
2
ba
|
960
sqft
|
built
1930
2945 N Denny St, Indianapolis, IN 46218
$-43
Cash flow
-1.2%
Cash-on-Cash Return
6.0%
Cap rate
0.7%
Rent to Value Ratio
Active
$129,999
2
bds
|
1
ba
|
672
sqft
|
built
1950
2954 N Drexel Ave, Indianapolis, IN 46218
$80
Cash flow
3.2%
Cash-on-Cash Return
7.0%
Cap rate
0.8%
Rent to Value Ratio

Active
$190,000
3
bds
|
2
ba
|
1,152
sqft
|
built
1971
3026 Stuart St, Indianapolis, IN 46218
$-233
Cash flow
-6.4%
Cash-on-Cash Return
4.8%
Cap rate
0.6%
Rent to Value Ratio
Active
$150,000
3
bds
|
2
ba
|
1,236
sqft
|
built
1940
3626 N Denny St, Indianapolis, IN 46218
$114
Cash flow
4.0%
Cash-on-Cash Return
7.2%
Cap rate
0.9%
Rent to Value Ratio
Active
$125,000
2
bds
|
1
ba
|
720
sqft
|
built
1946
2966 N Olney St, Indianapolis, IN 46218
$37
Cash flow
1.5%
Cash-on-Cash Return
6.6%
Cap rate
0.8%
Rent to Value Ratio