46219 Investment Properties for Sale
Browse homes for sale and investment properties in 46219. Refine your search by price, property type, or more.
Best cash flowing properties in 46219
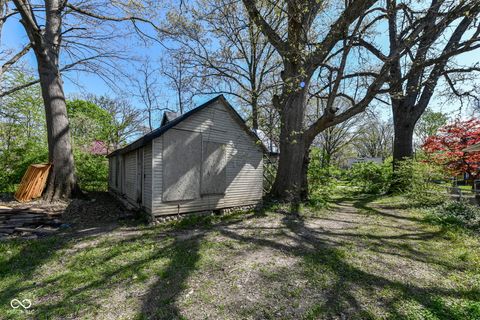
Active
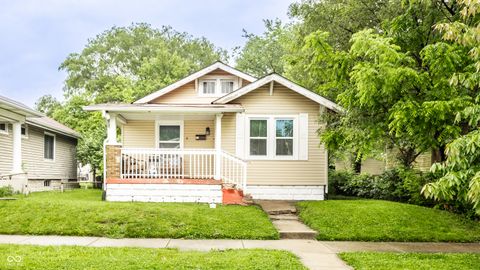
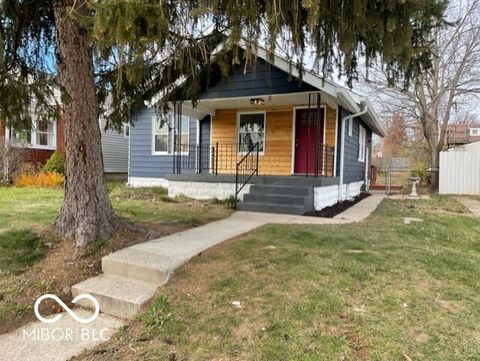
$125,000
2
bds
|
0
ba
|
872
sqft
|
built
1870
324 Burgess Ave, Indianapolis, IN 46219
$326
Cash flow
13.6%
Cash-on-Cash Return
9.3%
Cap rate
1.1%
Rent to Value Ratio
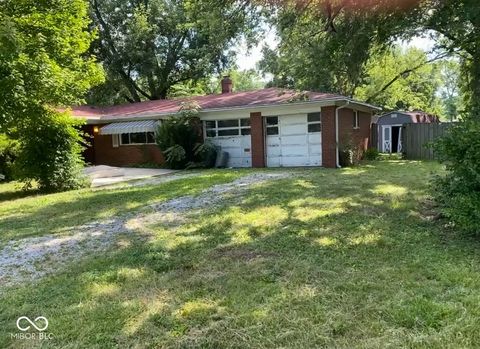
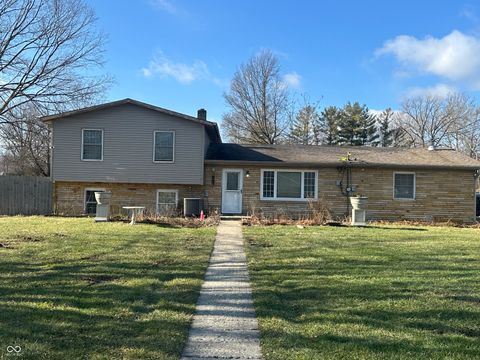
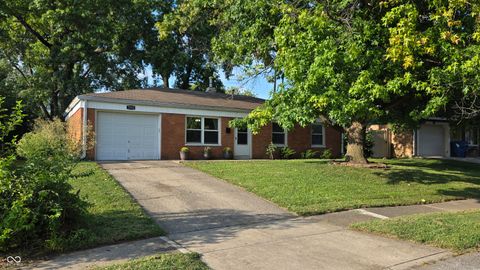
Active
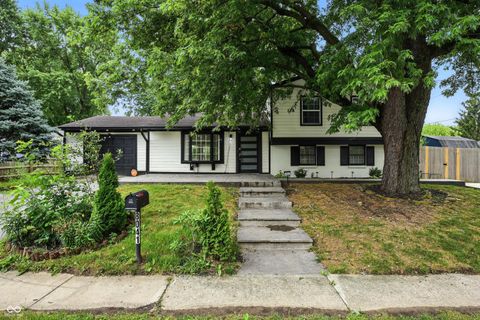
$139,900
3
bds
|
2
ba
|
1,303
sqft
|
built
1961
1819 Englewood Dr, Indianapolis, IN 46219
$318
Cash flow
11.9%
Cash-on-Cash Return
8.9%
Cap rate
1.1%
Rent to Value Ratio
72 out of 82 properties for sale in 46219
Limited Results Shown
Create a free account, or log in to reveal all property listings and enjoy the complete experience.
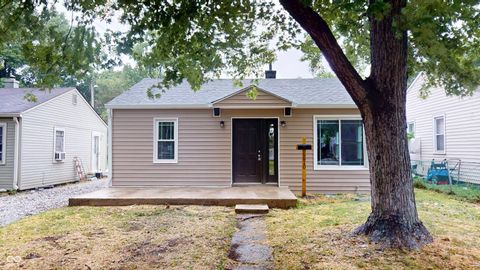
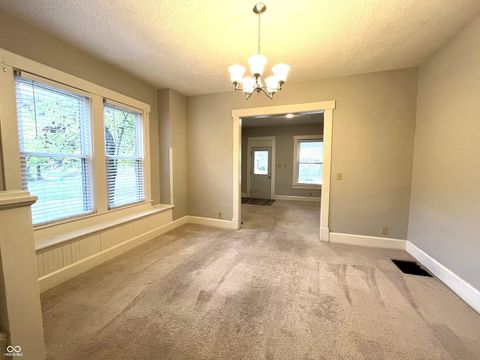
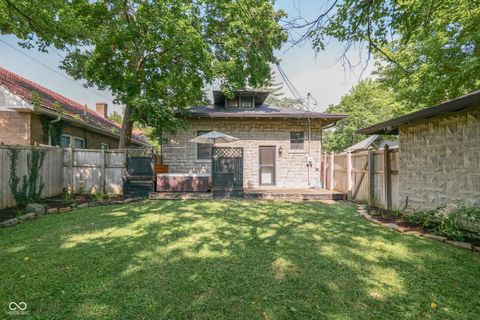
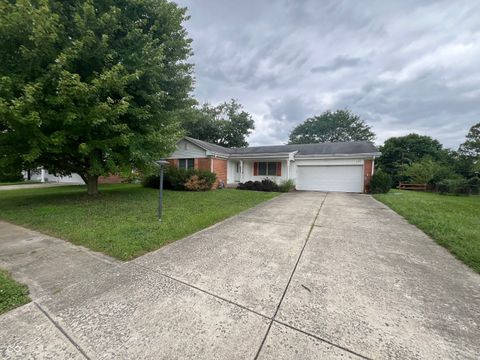
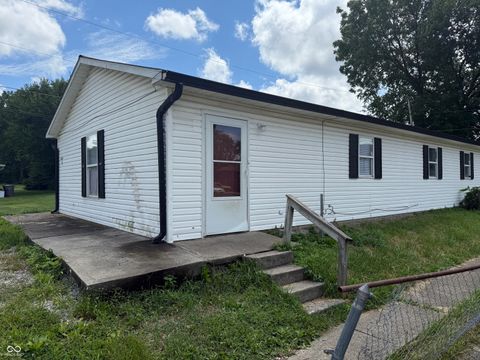
Active
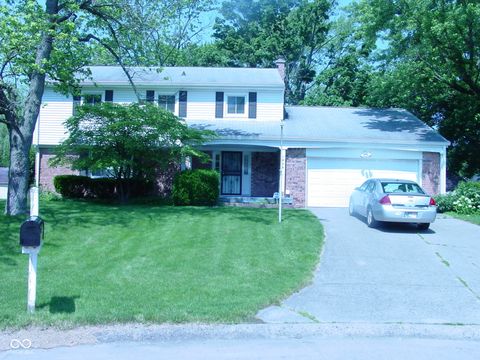
$179,900
3
bds
|
1
ba
|
1,099
sqft
|
built
1949
5810 Greenfield Ave, Indianapolis, IN 46219
$44
Cash flow
1.3%
Cash-on-Cash Return
6.4%
Cap rate
0.8%
Rent to Value Ratio
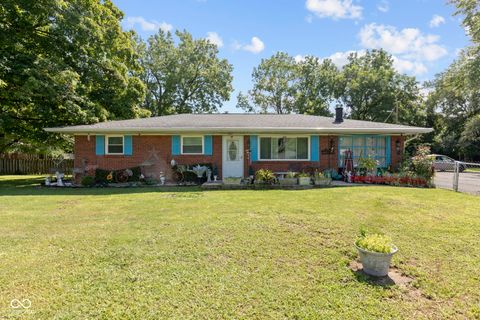
Active
$350,000
4
bds
|
2
ba
|
1,850
sqft
|
built
1959
431 Melvenia St, Indianapolis, IN 46219
$-551
Cash flow
-8.2%
Cash-on-Cash Return
4.3%
Cap rate
0.5%
Rent to Value Ratio
Active
$369,500
3
bds
|
3
ba
|
3,273
sqft
|
built
1928
770 N Arlington Ave, Indianapolis, IN 46219
$-168
Cash flow
-2.4%
Cash-on-Cash Return
5.6%
Cap rate
0.7%
Rent to Value Ratio
Active
$310,000
0
bds
|
0
ba
|
0
sqft
|
built
1916
38 N Irvington Ave, Indianapolis, IN 46219
$-622
Cash flow
-10.5%
Cash-on-Cash Return
3.7%
Cap rate
0.5%
Rent to Value Ratio
Active
$300,000
4
bds
|
2
ba
|
2,258
sqft
|
built
1962
406 S Fenton Ave, Indianapolis, IN 46219
$-640
Cash flow
-11.1%
Cash-on-Cash Return
3.6%
Cap rate
0.4%
Rent to Value Ratio
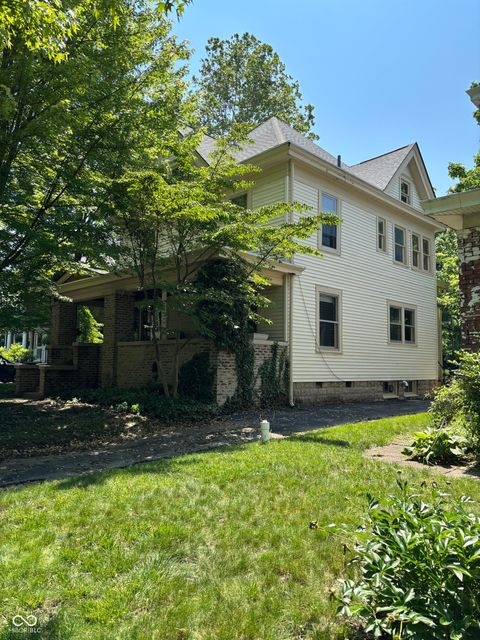
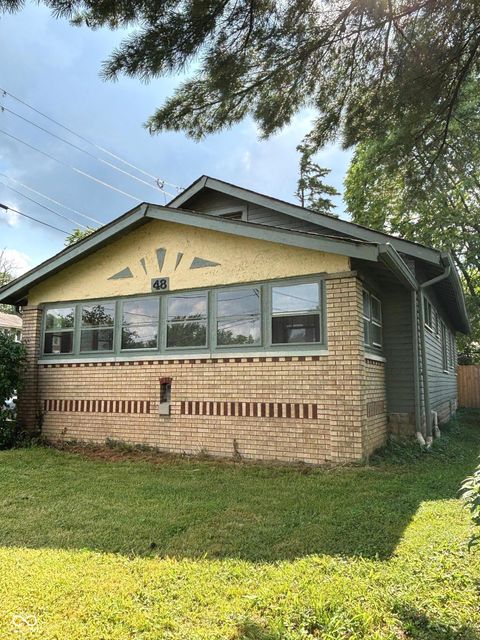
Active
$499,900
4
bds
|
4
ba
|
2,240
sqft
|
built
1910
48 N Audubon Rd, Indianapolis, IN 46219
$-836
Cash flow
-8.7%
Cash-on-Cash Return
4.1%
Cap rate
0.5%
Rent to Value Ratio
Active
$128,000
2
bds
|
1
ba
|
930
sqft
|
built
1920
361 S Spencer Ave, Indianapolis, IN 46219
$310
Cash flow
12.6%
Cash-on-Cash Return
9.1%
Cap rate
1.1%
Rent to Value Ratio
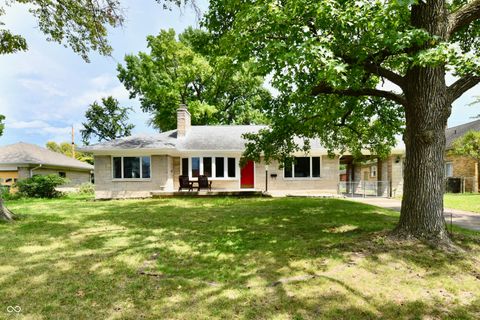
Active
$175,000
3
bds
|
1
ba
|
1,140
sqft
|
built
1959
7822 Wysong Dr, Indianapolis, IN 46219
$208
Cash flow
6.2%
Cash-on-Cash Return
7.6%
Cap rate
0.9%
Rent to Value Ratio
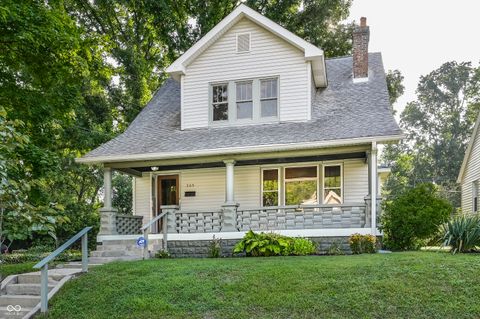
Active
$289,900
2
bds
|
1
ba
|
1,170
sqft
|
built
1923
341 Poplar Rd, Indianapolis, IN 46219
$33
Cash flow
0.6%
Cash-on-Cash Return
6.3%
Cap rate
0.8%
Rent to Value Ratio

Active
$145,000
4
bds
|
1
ba
|
1,139
sqft
|
built
1921
5965 Rawles Ave, Indianapolis, IN 46219
$85
Cash flow
3.1%
Cash-on-Cash Return
6.9%
Cap rate
0.8%
Rent to Value Ratio
Active
$250,000
3
bds
|
1
ba
|
1,579
sqft
|
built
1930
48 S Arlington Ave, Indianapolis, IN 46219
$-315
Cash flow
-6.6%
Cash-on-Cash Return
4.6%
Cap rate
0.6%
Rent to Value Ratio
Active
$175,000
2
bds
|
2
ba
|
1,728
sqft
|
built
1941
35 N Fenton Ave, Indianapolis, IN 46219
$70
Cash flow
2.1%
Cash-on-Cash Return
6.6%
Cap rate
0.8%
Rent to Value Ratio
Active
$269,900
4
bds
|
2
ba
|
1,836
sqft
|
built
1941
155 N Franklin Rd, Indianapolis, IN 46219
$-141
Cash flow
-2.7%
Cash-on-Cash Return
5.5%
Cap rate
0.7%
Rent to Value Ratio
Active
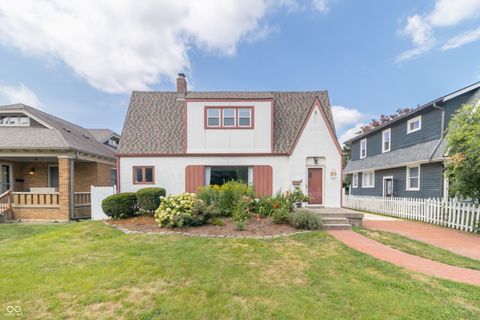
$349,999
4
bds
|
3
ba
|
2,712
sqft
|
built
1898
22 N Bolton Ave, Indianapolis, IN 46219
$139
Cash flow
2.1%
Cash-on-Cash Return
6.6%
Cap rate
0.8%
Rent to Value Ratio
Active
$189,000
4
bds
|
2
ba
|
1,271
sqft
|
built
1943
1141 N Shadeland Ave, Indianapolis, IN 46219
$-209
Cash flow
-5.8%
Cash-on-Cash Return
4.8%
Cap rate
0.6%
Rent to Value Ratio
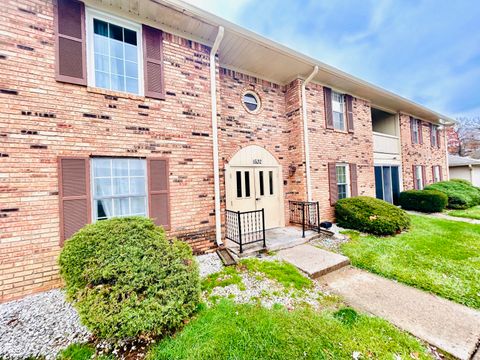
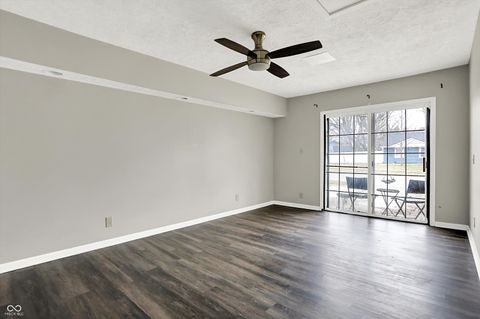
Active
$149,900
2
bds
|
2
ba
|
1,482
sqft
|
built
1974
1632 Wellesley Ct, Indianapolis, IN 46219
$-112
Cash flow
-3.9%
Cash-on-Cash Return
5.3%
Cap rate
0.9%
Rent to Value Ratio
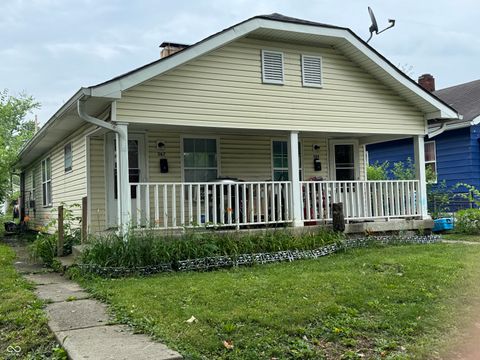
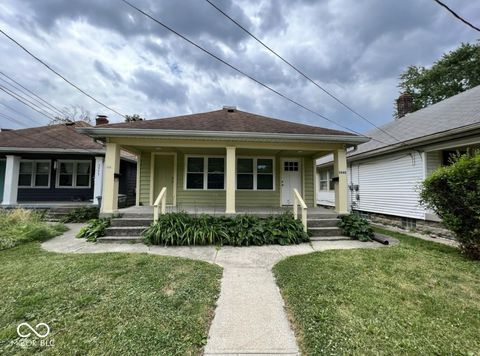
Active
$185,000
3
bds
|
1
ba
|
1,421
sqft
|
built
1961
8902 Carla Dr, Indianapolis, IN 46219
$156
Cash flow
4.4%
Cash-on-Cash Return
7.2%
Cap rate
0.9%
Rent to Value Ratio
Active
$149,000
2
bds
|
0
ba
|
0
sqft
|
built
1928
367 S Butler Ave, Indianapolis, IN 46219
$-73
Cash flow
-2.6%
Cash-on-Cash Return
5.6%
Cap rate
0.7%
Rent to Value Ratio
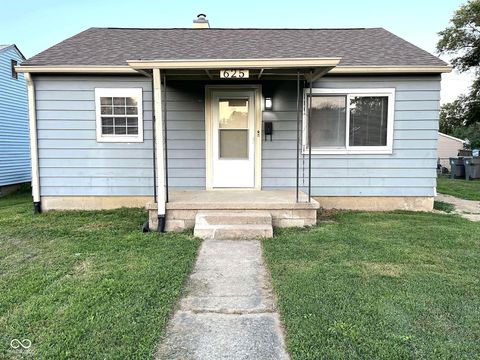
Active
$160,000
2
bds
|
1
ba
|
725
sqft
|
built
1947
625 S Spencer Ave, Indianapolis, IN 46219
$146
Cash flow
4.8%
Cash-on-Cash Return
7.2%
Cap rate
0.9%
Rent to Value Ratio
Active
$220,000
4
bds
|
2
ba
|
2,483
sqft
|
built
1962
1140 N Gibson Ave, Indianapolis, IN 46219
$115
Cash flow
2.7%
Cash-on-Cash Return
6.8%
Cap rate
0.8%
Rent to Value Ratio
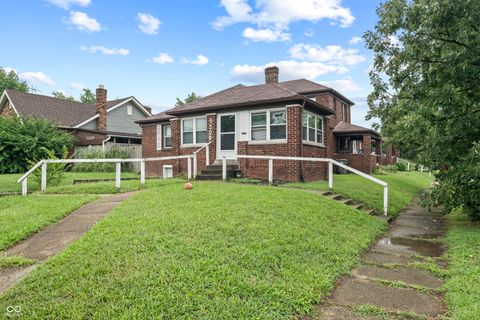
Active
$210,000
3
bds
|
2
ba
|
1,792
sqft
|
built
1910
305 S Emerson Ave, Indianapolis, IN 46219
$28
Cash flow
0.7%
Cash-on-Cash Return
6.3%
Cap rate
0.8%
Rent to Value Ratio
Active
$149,900
0
bds
|
0
ba
|
0
sqft
|
built
1921
5949 Rawles Ave, Indianapolis, IN 46219
$-147
Cash flow
-5.1%
Cash-on-Cash Return
5.0%
Cap rate
0.6%
Rent to Value Ratio
Active
$275,000
0
bds
|
0
ba
|
0
sqft
|
built
1939
5201 E 10th St, Indianapolis, IN 46219
$-719
Cash flow
-13.6%
Cash-on-Cash Return
3.0%
Cap rate
0.4%
Rent to Value Ratio
Active
$395,000
3
bds
|
3
ba
|
2,128
sqft
|
built
1925
5718 E Pleasant Run Parkway North Dr, Indianapolis, IN 46219
$-505
Cash flow
-6.7%
Cash-on-Cash Return
4.6%
Cap rate
0.6%
Rent to Value Ratio
Active
$210,000
0
bds
|
0
ba
|
0
sqft
|
built
1955
7549 E 10th St, Indianapolis, IN 46219
$-317
Cash flow
-7.9%
Cash-on-Cash Return
4.3%
Cap rate
0.5%
Rent to Value Ratio
Active
$219,900
3
bds
|
2
ba
|
1,156
sqft
|
built
1944
701 N Bazil Ave, Indianapolis, IN 46219
$-160
Cash flow
-3.8%
Cash-on-Cash Return
5.3%
Cap rate
0.6%
Rent to Value Ratio
Active
$270,000
0
bds
|
0
ba
|
0
sqft
|
built
1954
6607 Irwin Dr, Indianapolis, IN 46219
$-3
Cash flow
-0.1%
Cash-on-Cash Return
6.1%
Cap rate
0.7%
Rent to Value Ratio
Active
$350,000
3
bds
|
3
ba
|
2,802
sqft
|
built
1950
1309 N Butler Ave, Indianapolis, IN 46219
$-275
Cash flow
-4.1%
Cash-on-Cash Return
5.2%
Cap rate
0.6%
Rent to Value Ratio
Active
$179,900
4
bds
|
2
ba
|
1,736
sqft
|
built
1929
123 S Butler Ave, Indianapolis, IN 46219
$-163
Cash flow
-4.7%
Cash-on-Cash Return
5.1%
Cap rate
0.6%
Rent to Value Ratio
Active
$135,000
2
bds
|
1
ba
|
836
sqft
|
built
1943
921 N Harbison Ave, Indianapolis, IN 46219
$274
Cash flow
10.6%
Cash-on-Cash Return
8.6%
Cap rate
1.0%
Rent to Value Ratio
Active
$222,500
4
bds
|
2
ba
|
1,348
sqft
|
built
1963
1108 N Ridgeview Dr, Indianapolis, IN 46219
$240
Cash flow
5.6%
Cash-on-Cash Return
7.4%
Cap rate
0.9%
Rent to Value Ratio
Active
$185,000
0
bds
|
0
ba
|
0
sqft
|
built
1998
6259 E 11th St, Indianapolis, IN 46219
$-189
Cash flow
-5.3%
Cash-on-Cash Return
4.9%
Cap rate
0.6%
Rent to Value Ratio
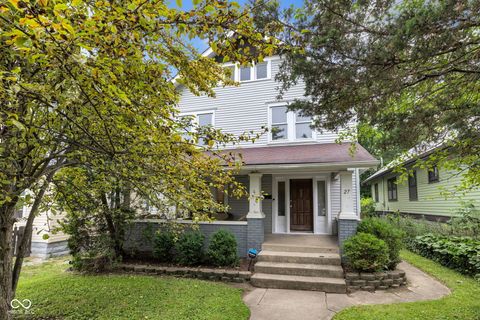
Active
$325,000
4
bds
|
2
ba
|
1,836
sqft
|
built
1910
27 N Hawthorne Ln, Indianapolis, IN 46219
$-78
Cash flow
-1.3%
Cash-on-Cash Return
5.9%
Cap rate
0.7%
Rent to Value Ratio
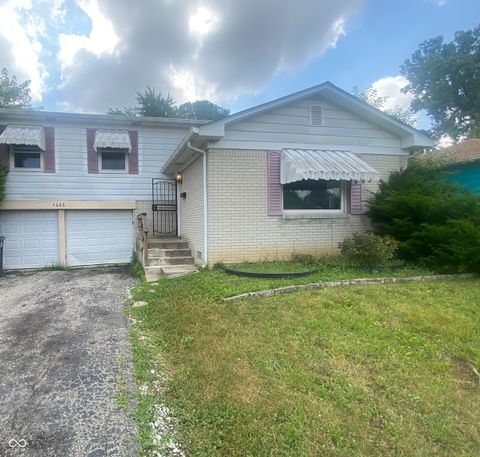
Active
$207,000
3
bds
|
3
ba
|
2,044
sqft
|
built
1966
1425 N Bolton Ave, Indianapolis, IN 46219
$-163
Cash flow
-4.1%
Cash-on-Cash Return
5.2%
Cap rate
0.6%
Rent to Value Ratio
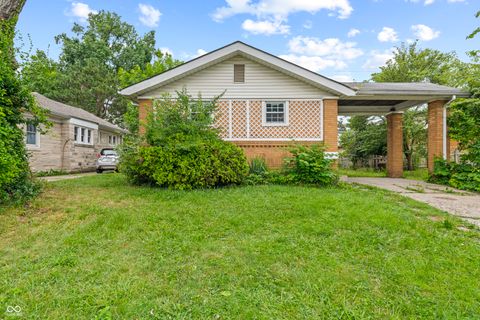
Active
$150,000
3
bds
|
1
ba
|
921
sqft
|
built
1930
50 N Catherwood Ave, Indianapolis, IN 46219
$-9
Cash flow
-0.3%
Cash-on-Cash Return
6.1%
Cap rate
0.7%
Rent to Value Ratio
Active
$183,900
2
bds
|
1
ba
|
832
sqft
|
built
1920
5206 E Saint Clair St, Indianapolis, IN 46219
$162
Cash flow
4.6%
Cash-on-Cash Return
7.2%
Cap rate
0.9%
Rent to Value Ratio
Active
$238,900
4
bds
|
2
ba
|
1,760
sqft
|
built
1959
8041 Barry Rd, Indianapolis, IN 46219
$-396
Cash flow
-8.6%
Cash-on-Cash Return
4.2%
Cap rate
0.5%
Rent to Value Ratio
Active
$299,500
4
bds
|
3
ba
|
2,360
sqft
|
built
1968
1808 Orchid Ct, Indianapolis, IN 46219
$-154
Cash flow
-2.7%
Cash-on-Cash Return
5.5%
Cap rate
0.7%
Rent to Value Ratio