46219 Investment Properties for Sale
Browse homes for sale and investment properties in 46219. Refine your search by price, property type, or more.
Best cash flowing properties in 46219
Active
$125,000
2
bds
|
0
ba
|
872
sqft
|
built
1870
324 Burgess Ave, Indianapolis, IN 46219
$326
Cash flow
13.6%
Cash-on-Cash Return
9.3%
Cap rate
1.1%
Rent to Value Ratio
Active
$159,499
3
bds
|
1
ba
|
1,025
sqft
|
built
1900
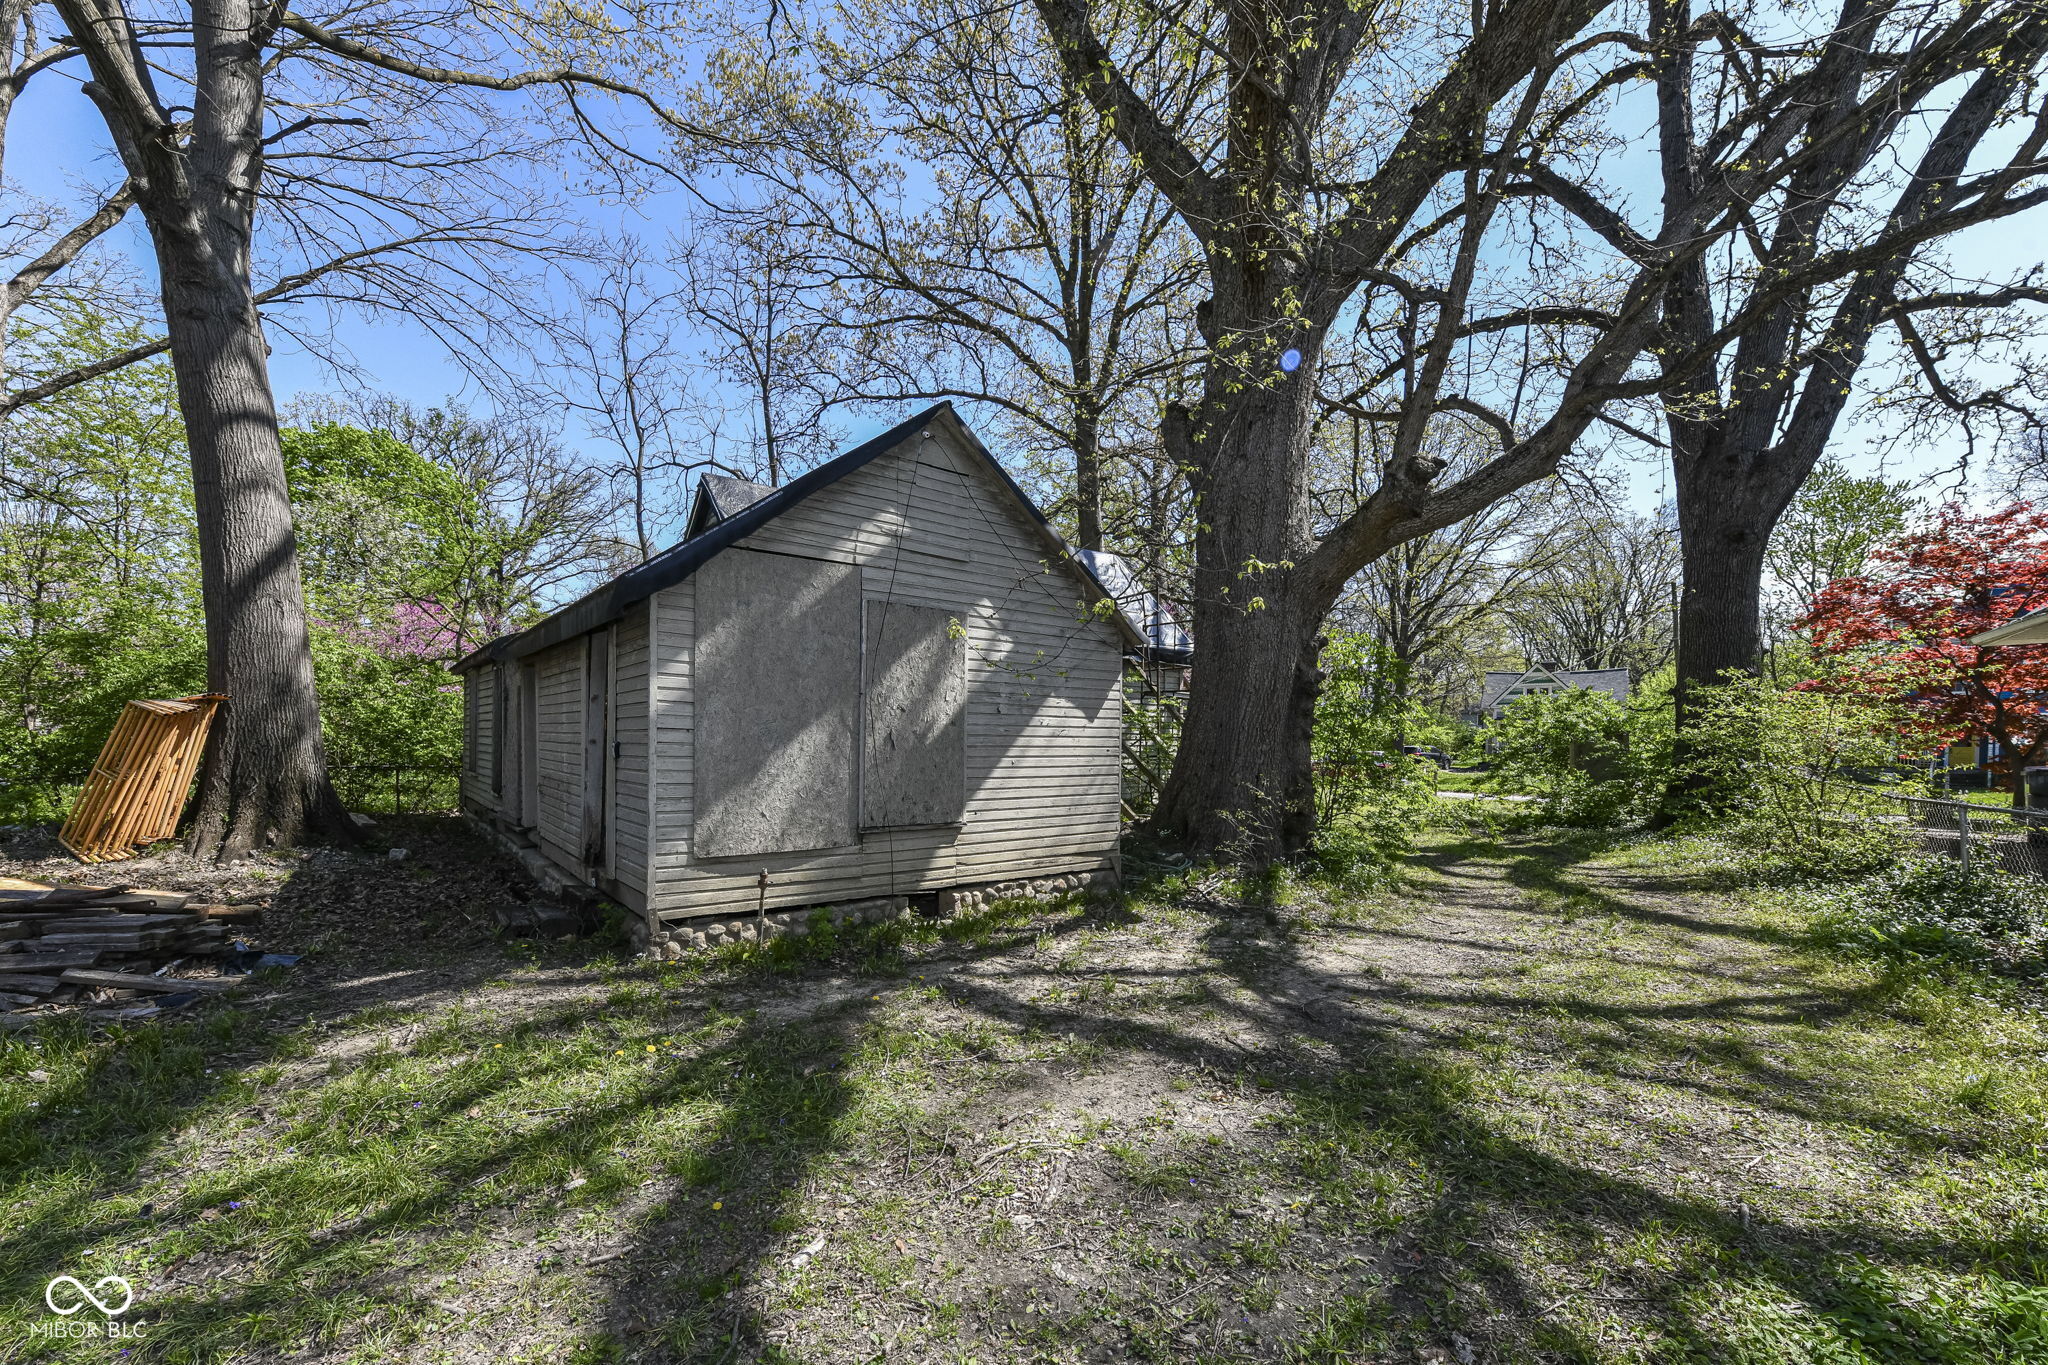
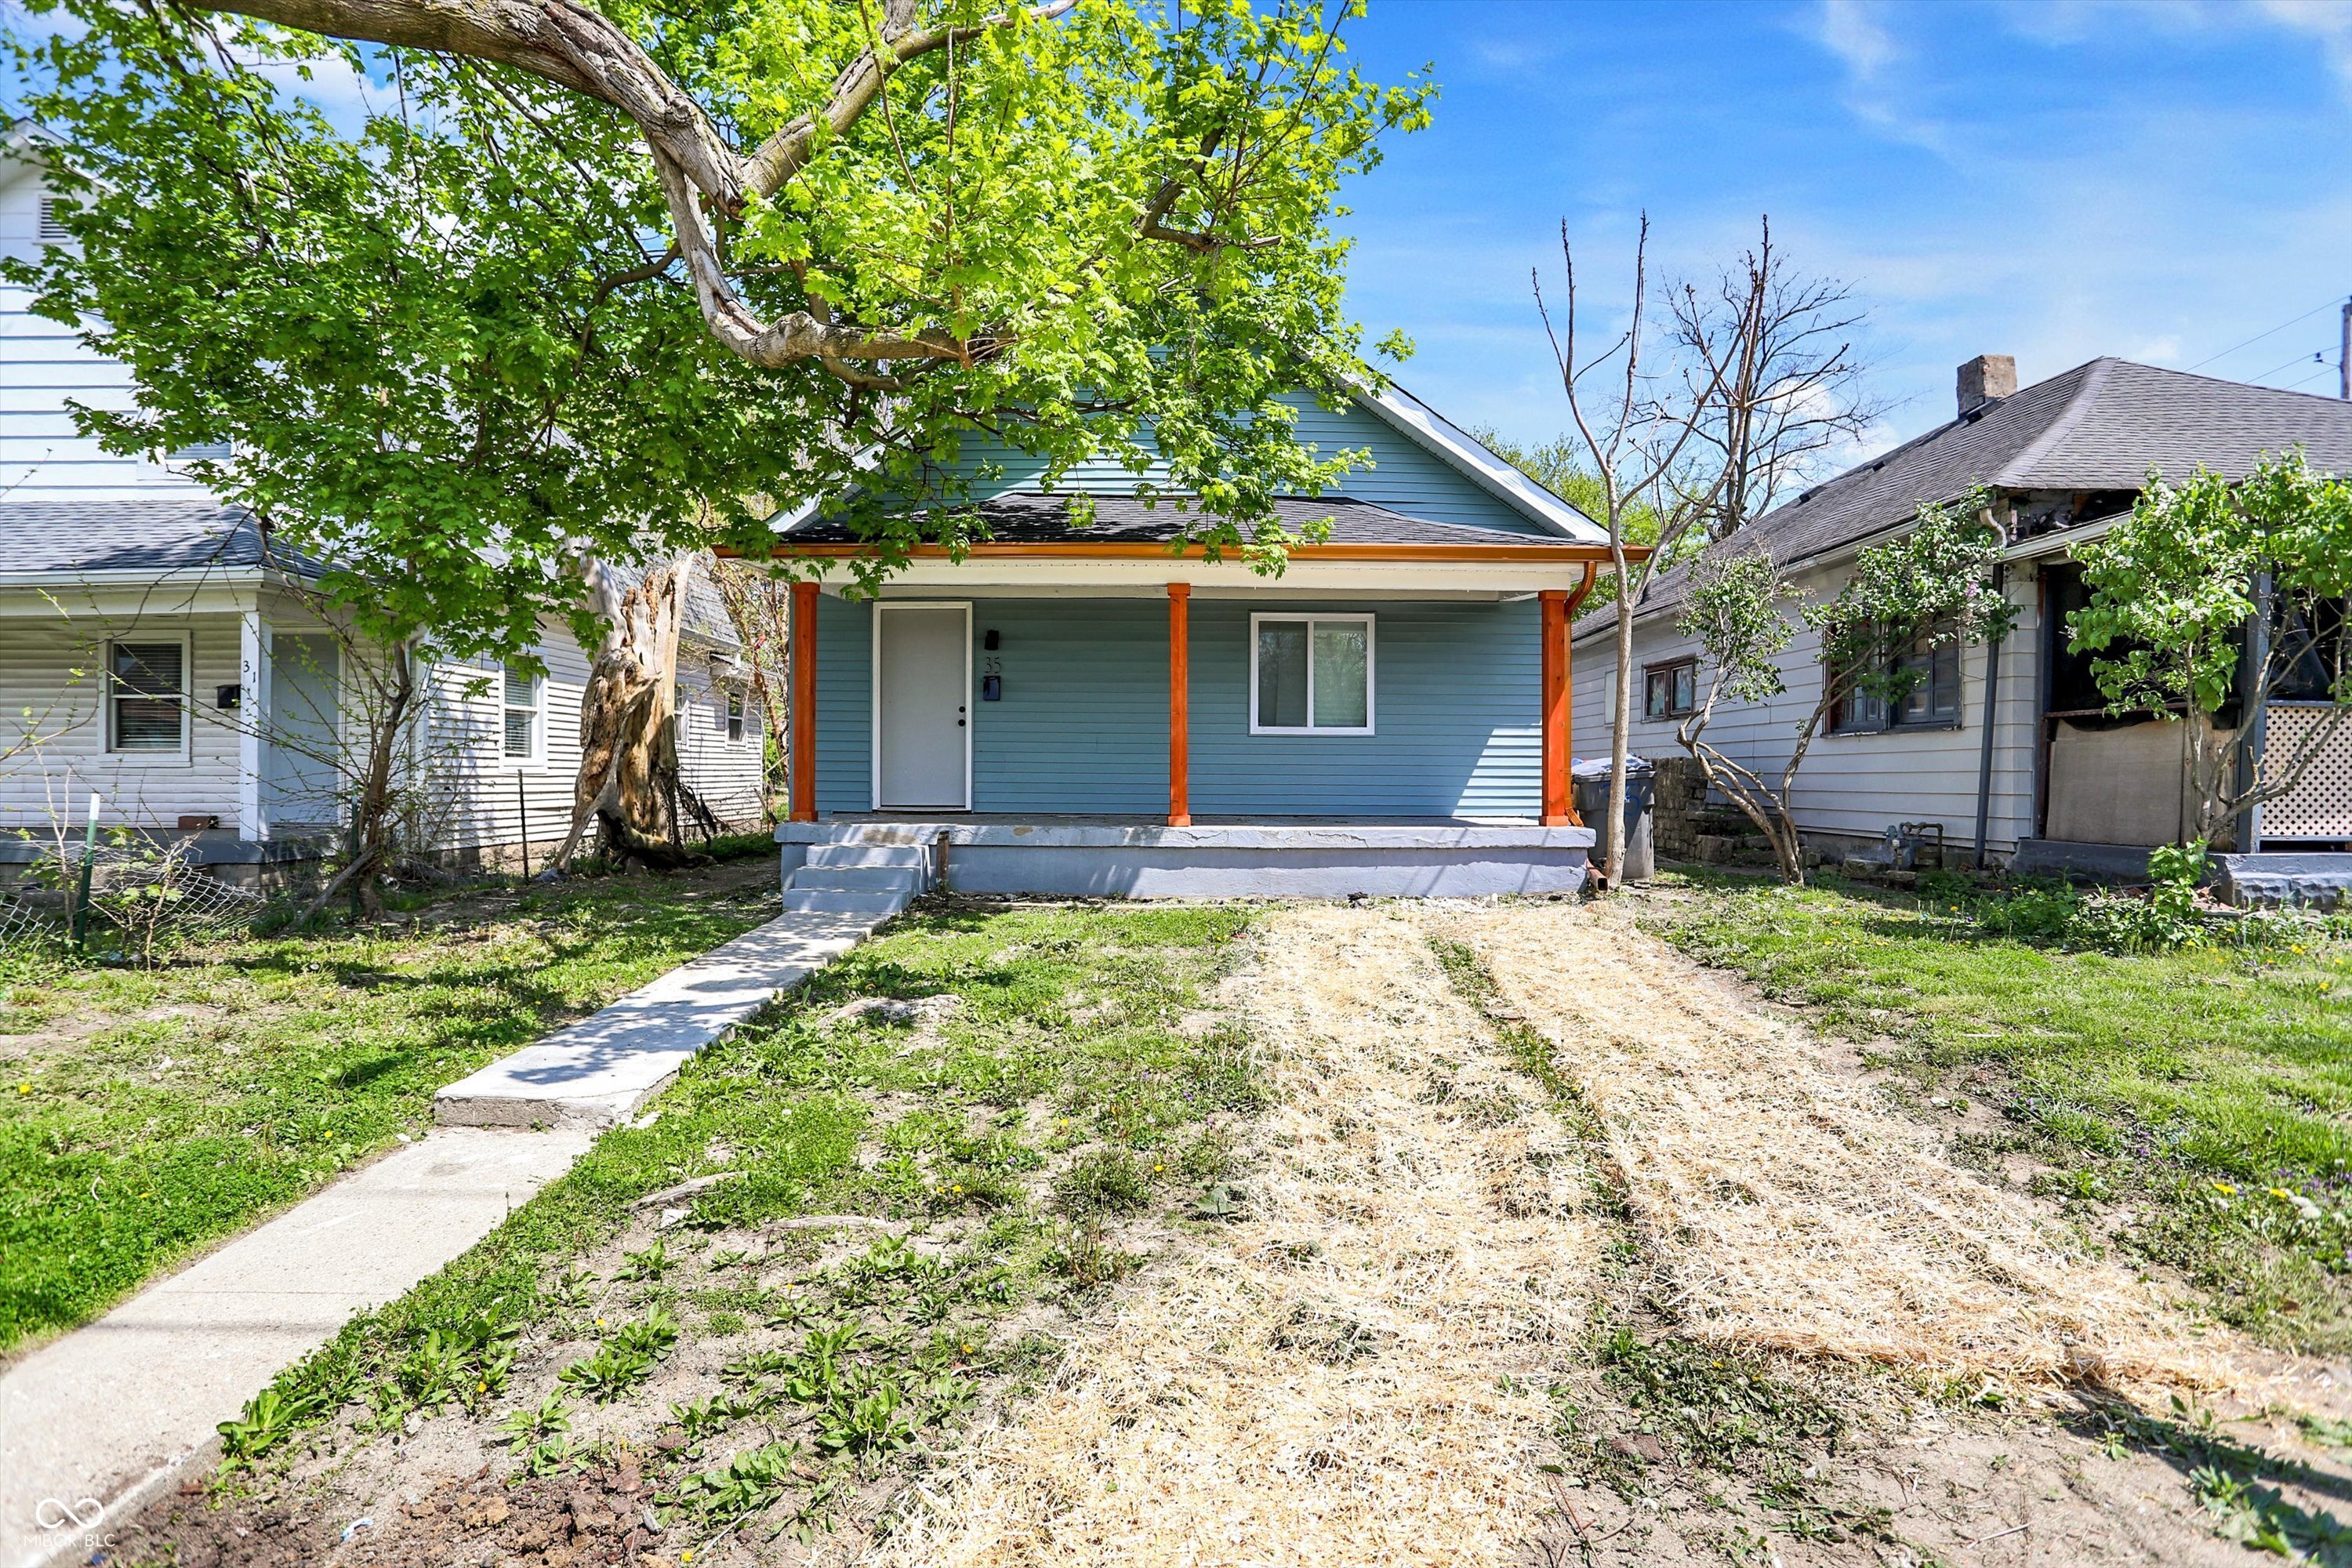
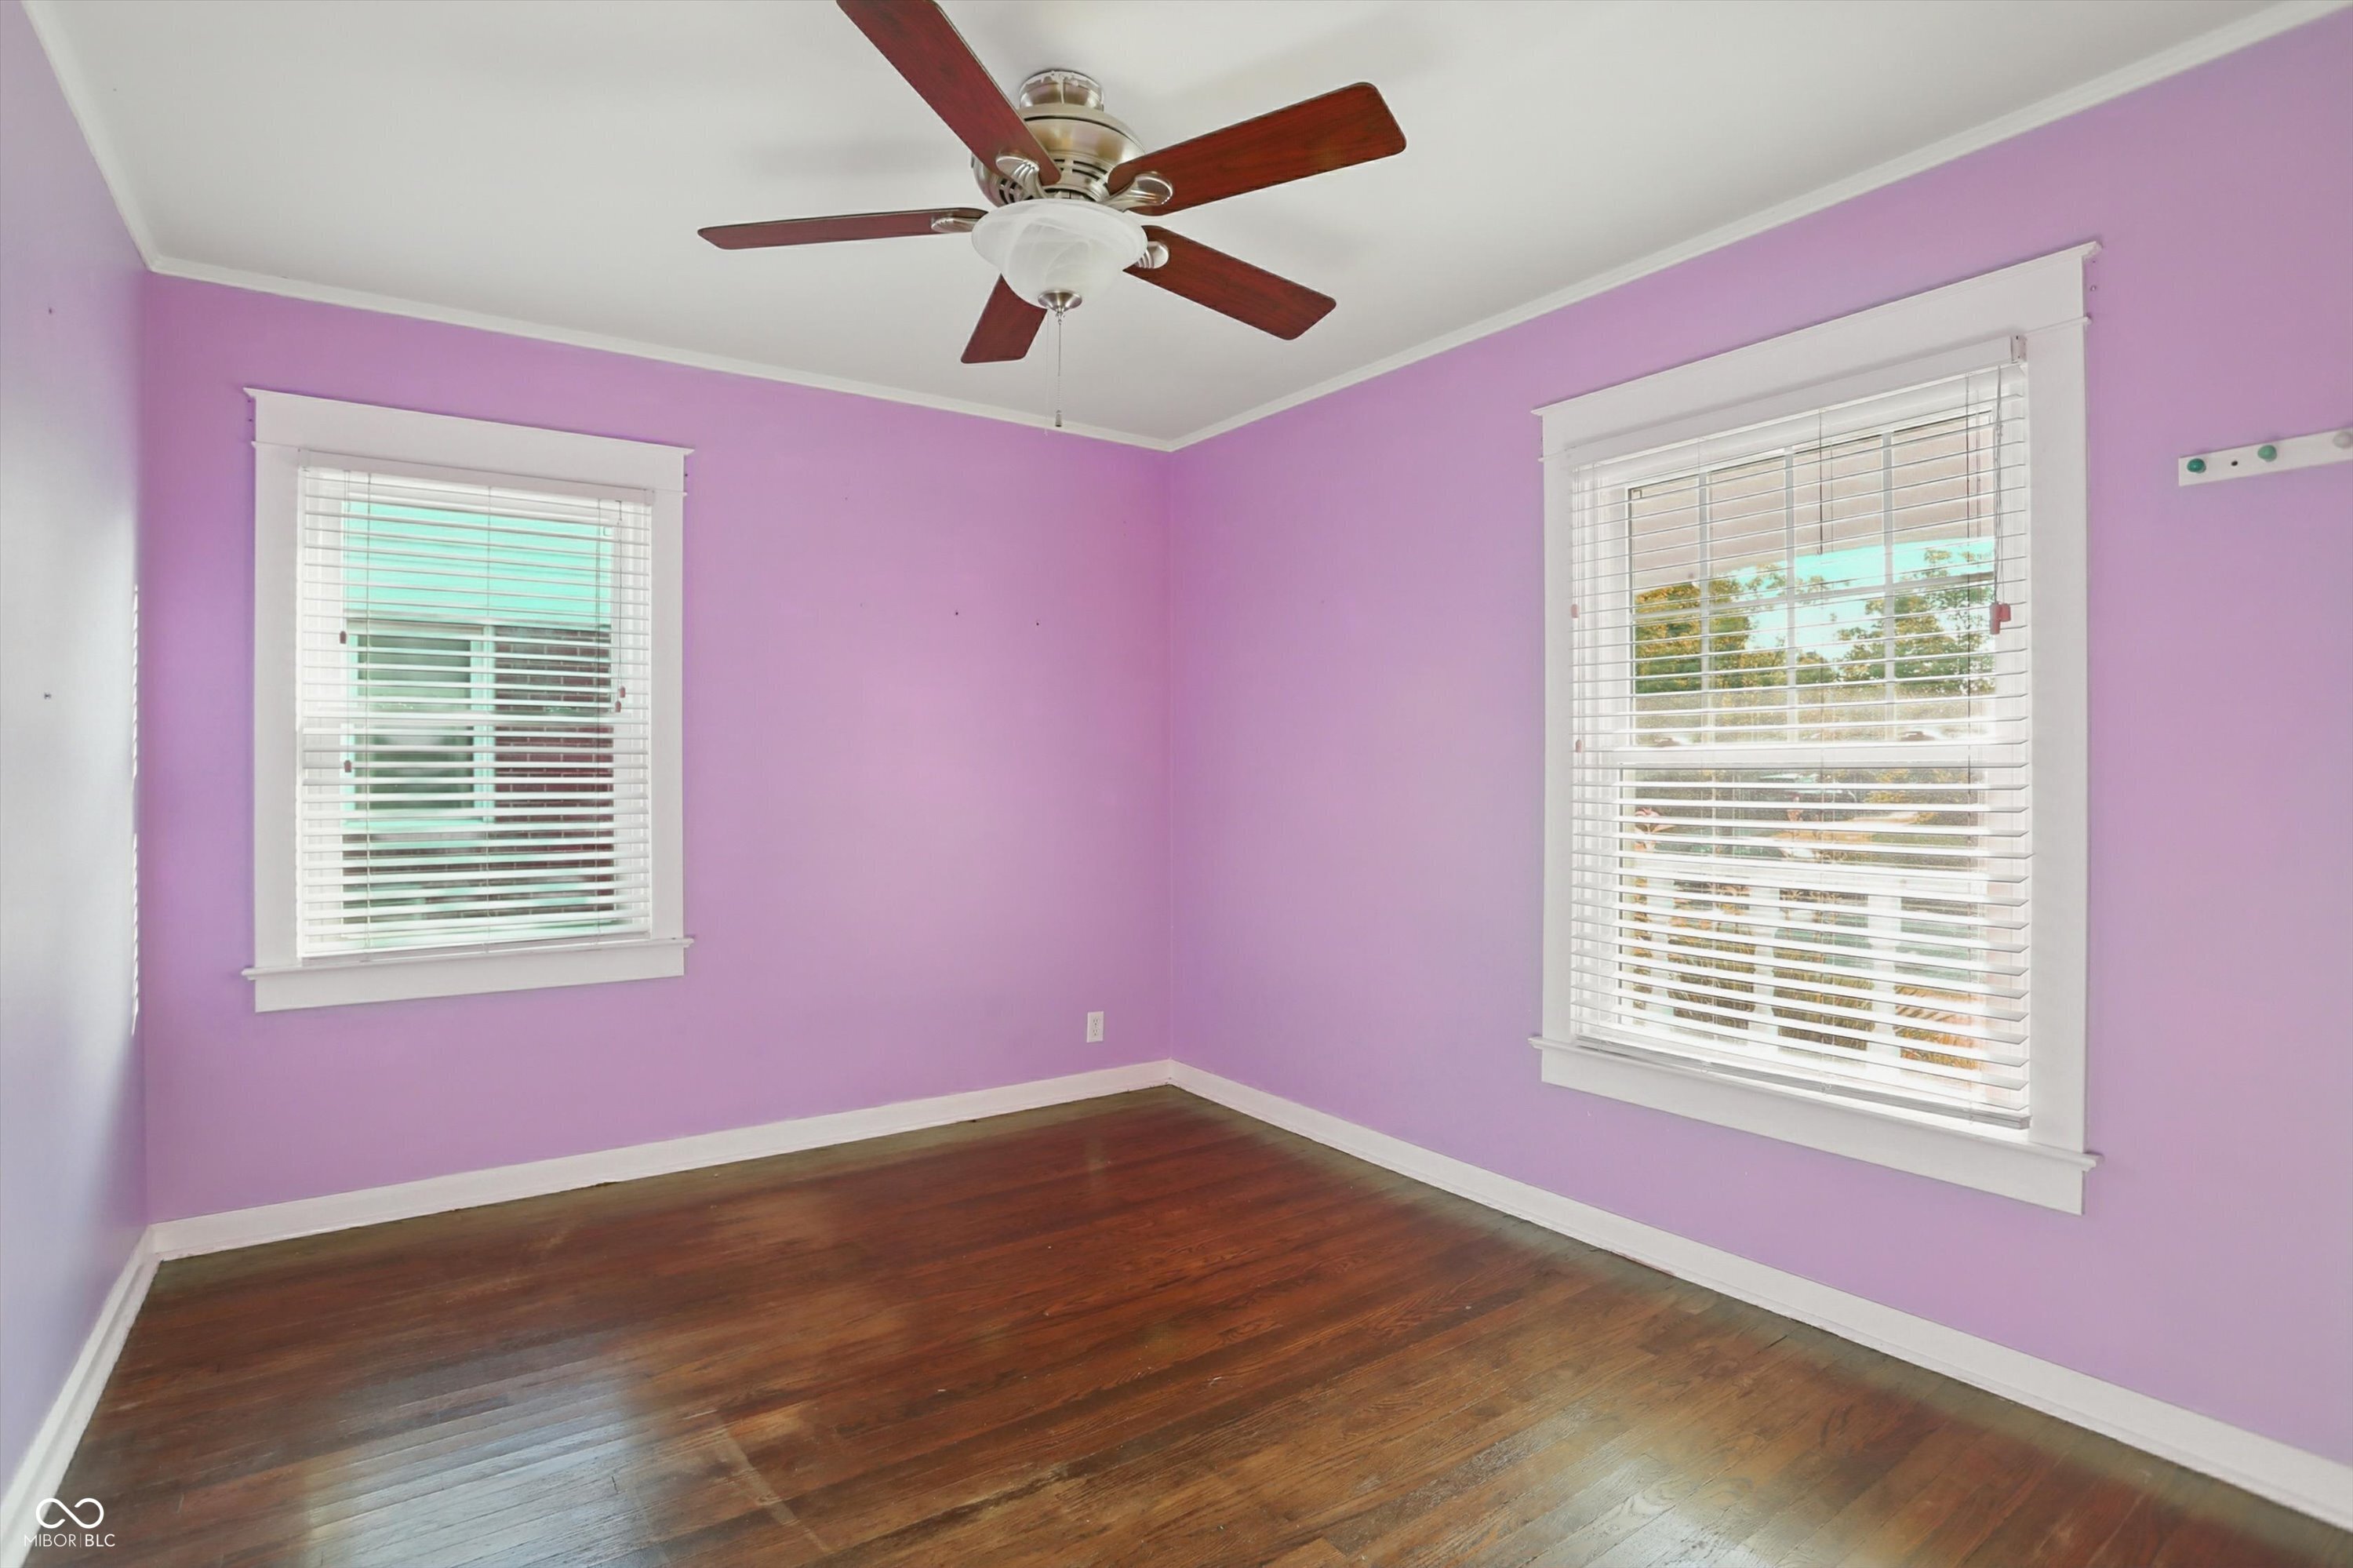
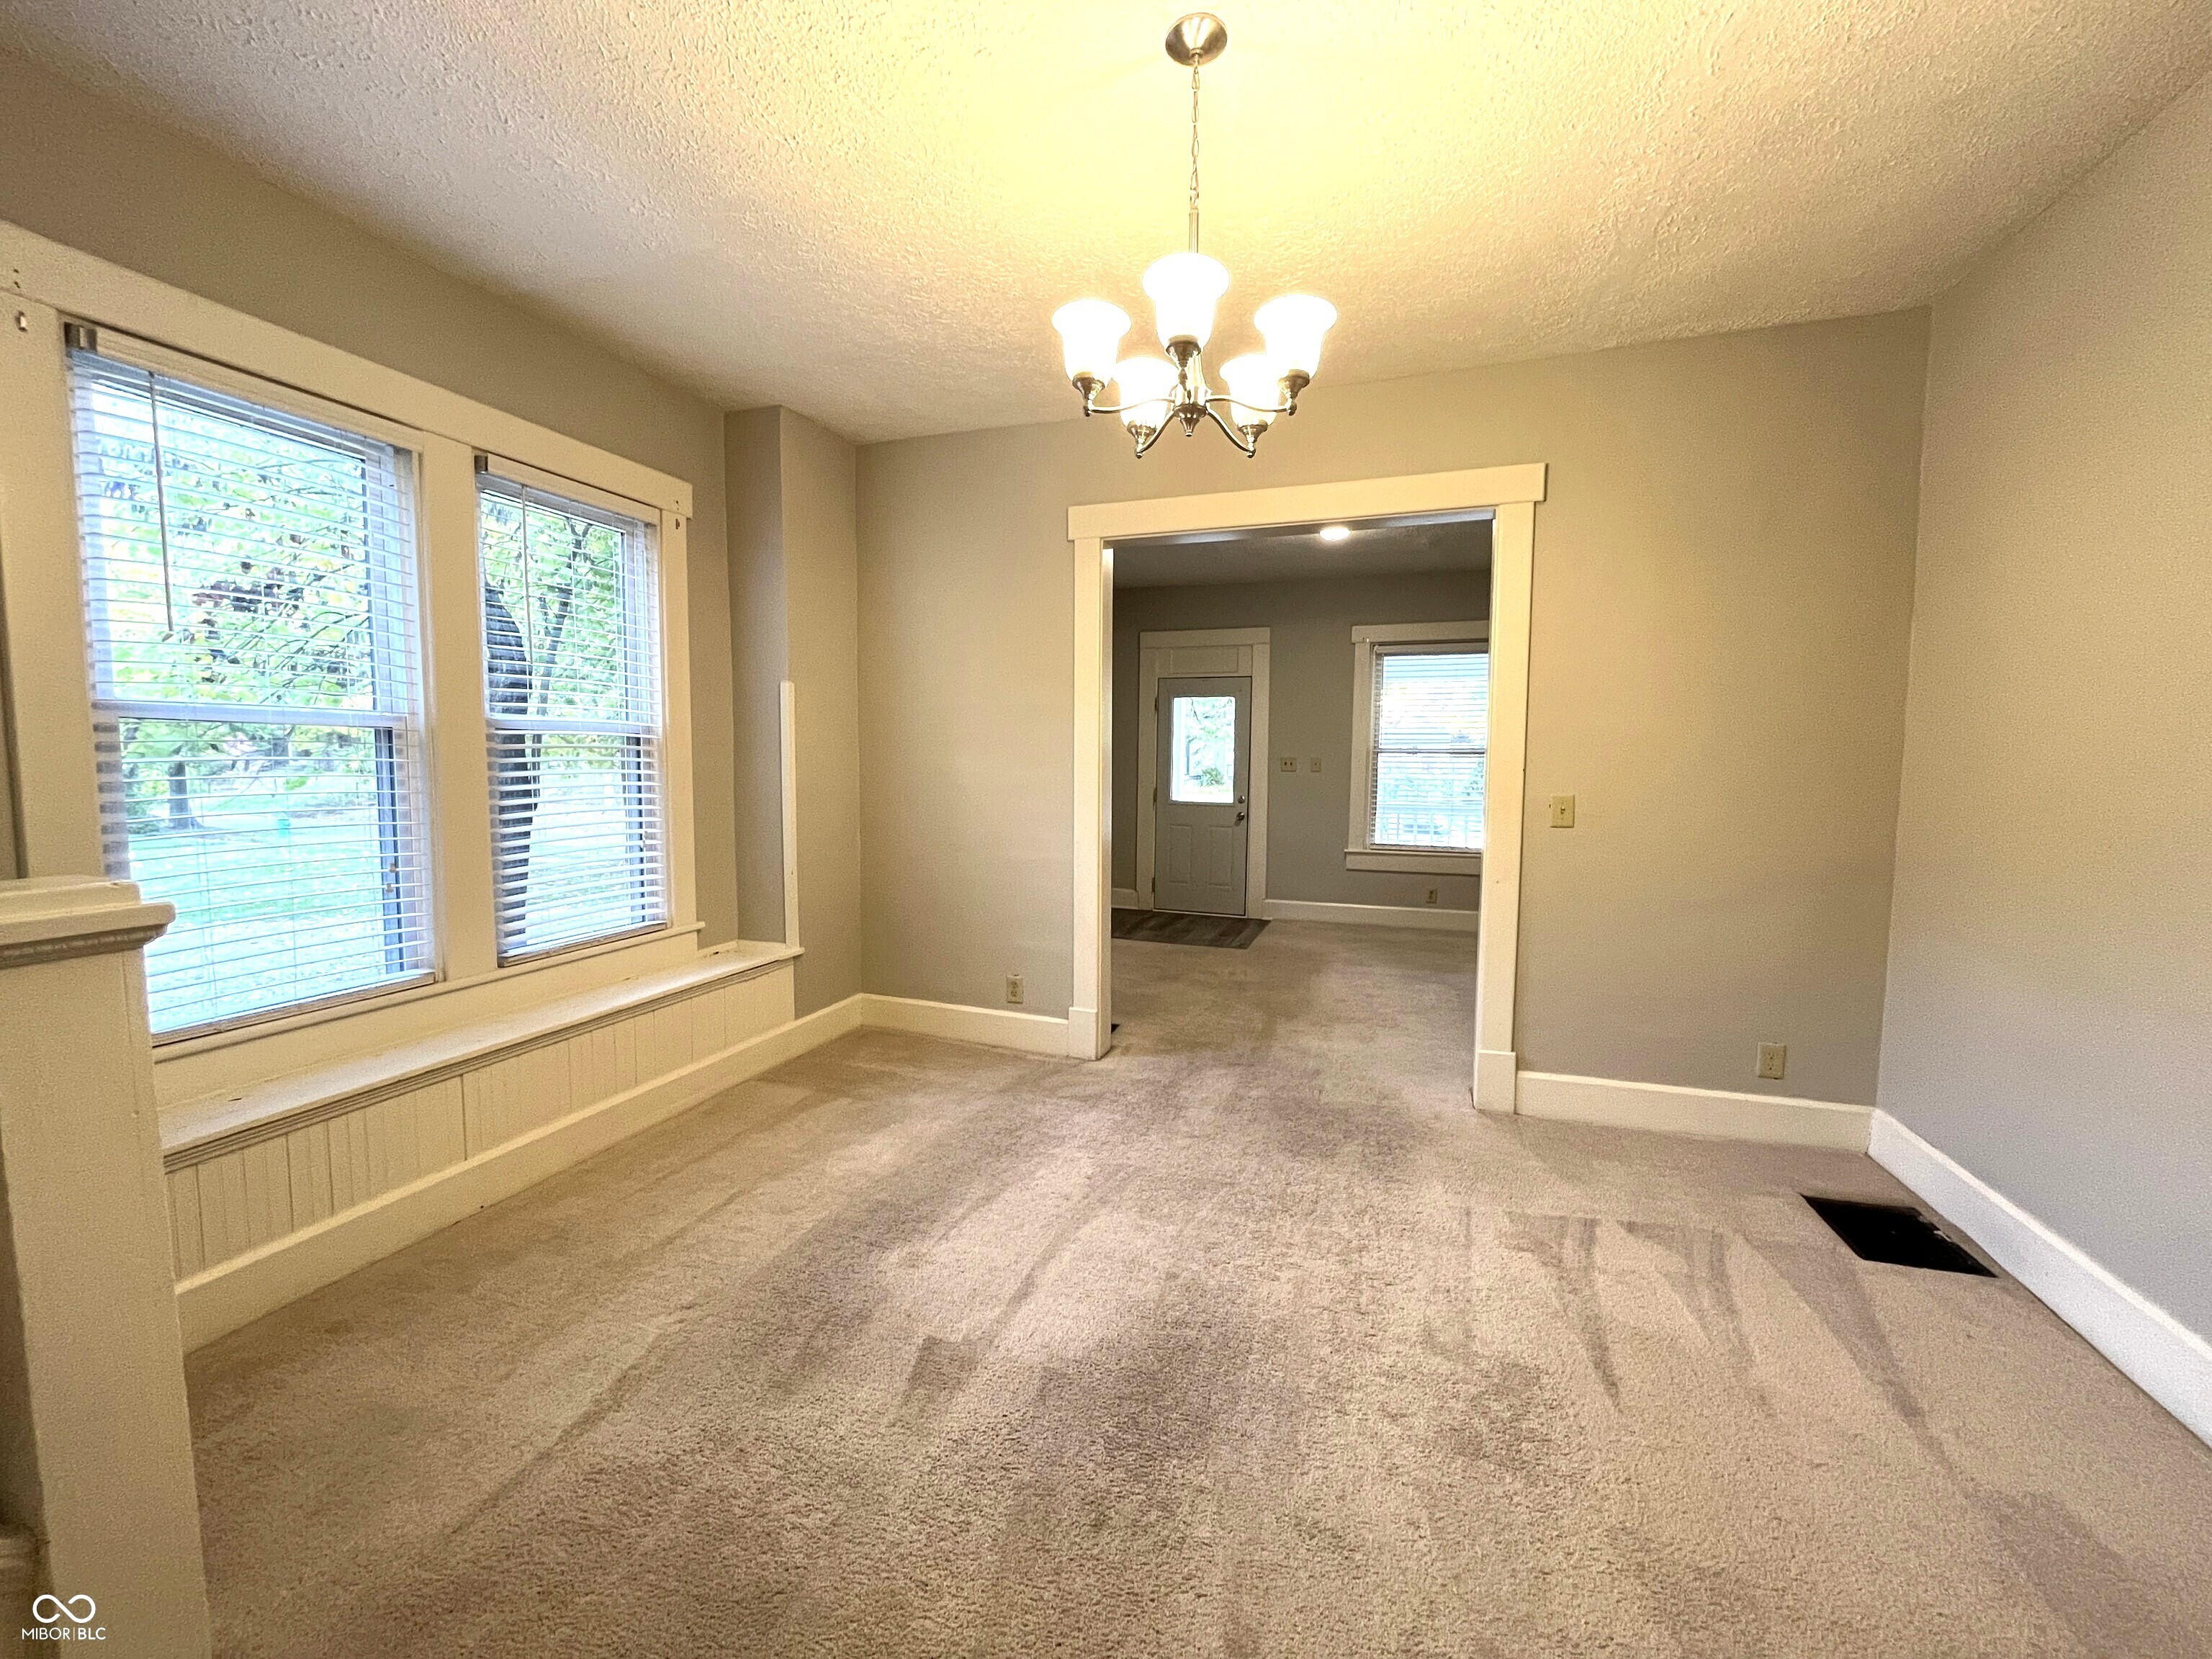
35 S Catherwood Ave, Indianapolis, IN 46219
$287
Cash flow
9.4%
Cash-on-Cash Return
8.3%
Cap rate
1.0%
Rent to Value Ratio
72 out of 74 properties for sale in 46219
Limited Results Shown
Create a free account, or log in to reveal all property listings and enjoy the complete experience.
Pending
$340,000
3
bds
|
2
ba
|
1,545
sqft
|
built
1938
808 N Layman Ave, Indianapolis, IN 46219
$-500
Cash flow
-7.7%
Cash-on-Cash Return
4.4%
Cap rate
0.5%
Rent to Value Ratio
Active
$350,000
0
bds
|
0
ba
|
0
sqft
|
built
1916
38 N Irvington Ave, Indianapolis, IN 46219
$-827
Cash flow
-12.3%
Cash-on-Cash Return
3.3%
Cap rate
0.4%
Rent to Value Ratio
Active
$325,000
4
bds
|
2
ba
|
2,258
sqft
|
built
1962
406 S Fenton Ave, Indianapolis, IN 46219
$-768
Cash flow
-12.3%
Cash-on-Cash Return
3.3%
Cap rate
0.4%
Rent to Value Ratio
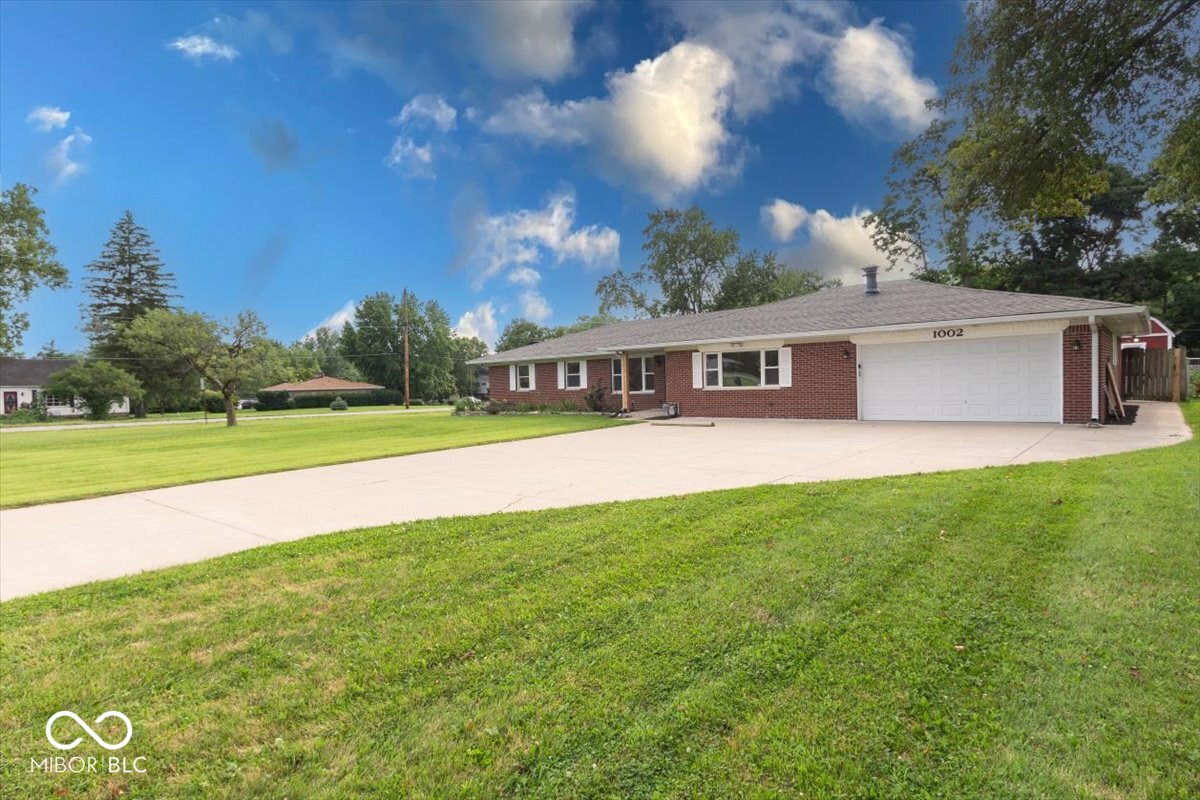
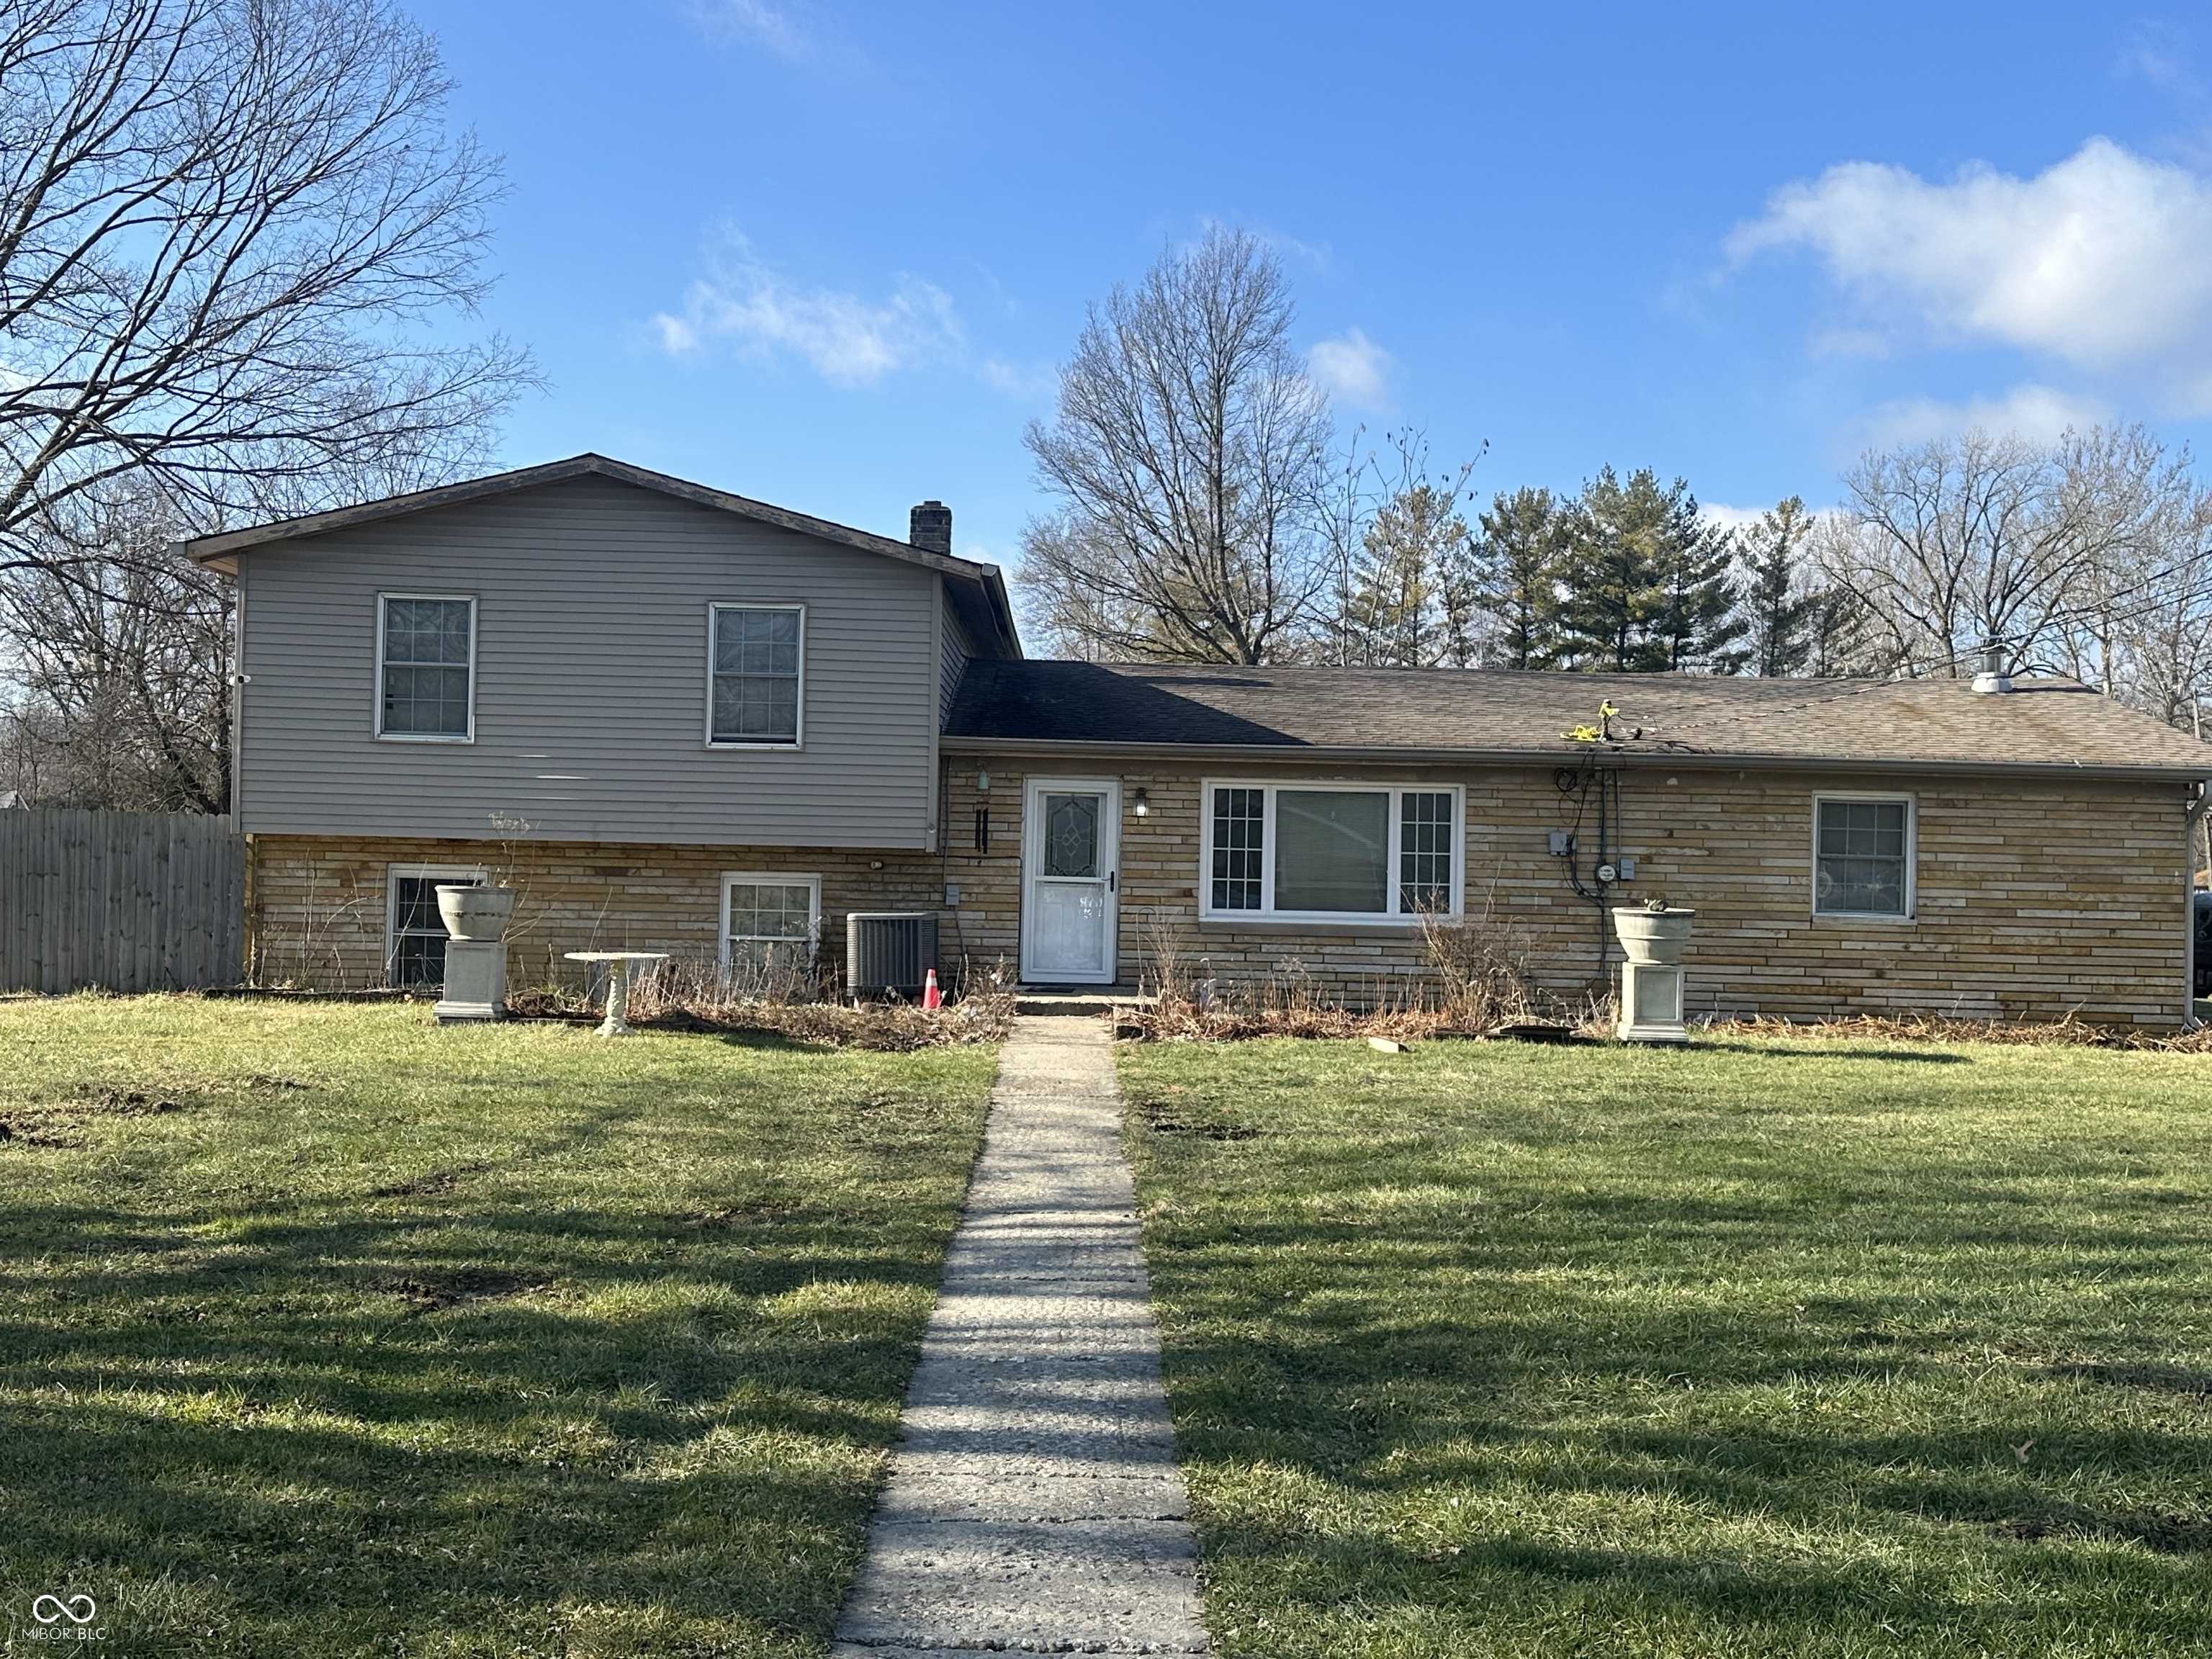
Active
$329,900
3
bds
|
3
ba
|
2,079
sqft
|
built
1956
1002 Payton Ave, Indianapolis, IN 46219
$-172
Cash flow
-2.7%
Cash-on-Cash Return
5.5%
Cap rate
0.7%
Rent to Value Ratio

Active
$169,000
0
bds
|
0
ba
|
0
sqft
|
built
1902
28 S Hawthorne Ln, Indianapolis, IN 46219
$-245
Cash flow
-7.6%
Cash-on-Cash Return
4.4%
Cap rate
0.5%
Rent to Value Ratio
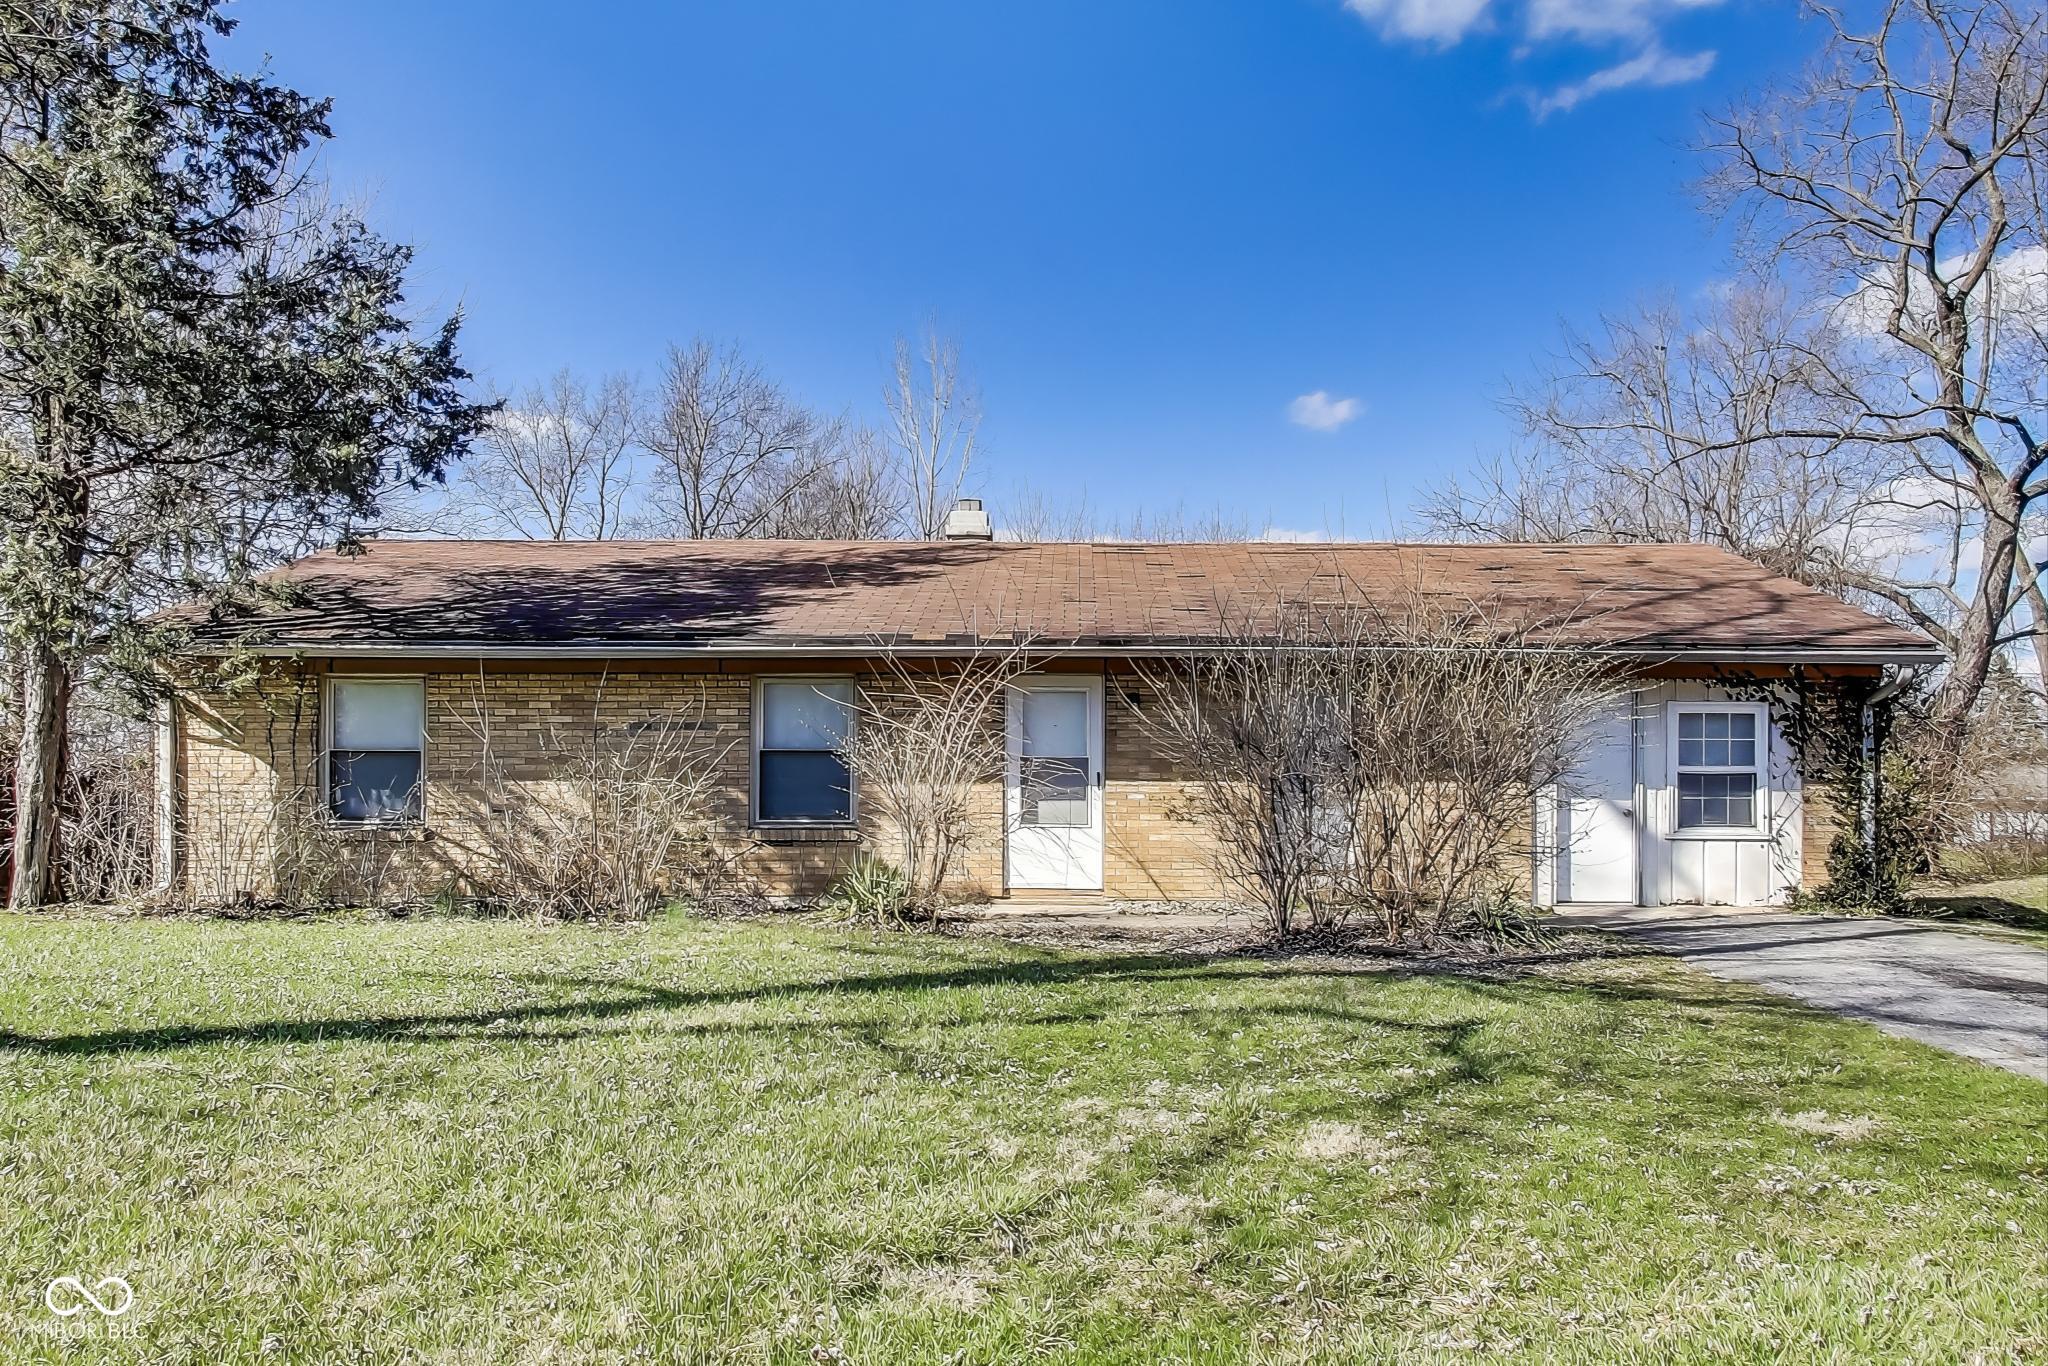
Active
$174,999
4
bds
|
2
ba
|
1,537
sqft
|
built
1957
7906 E 21st St, Indianapolis, IN 46219
$1
Cash flow
0.0%
Cash-on-Cash Return
6.2%
Cap rate
0.7%
Rent to Value Ratio
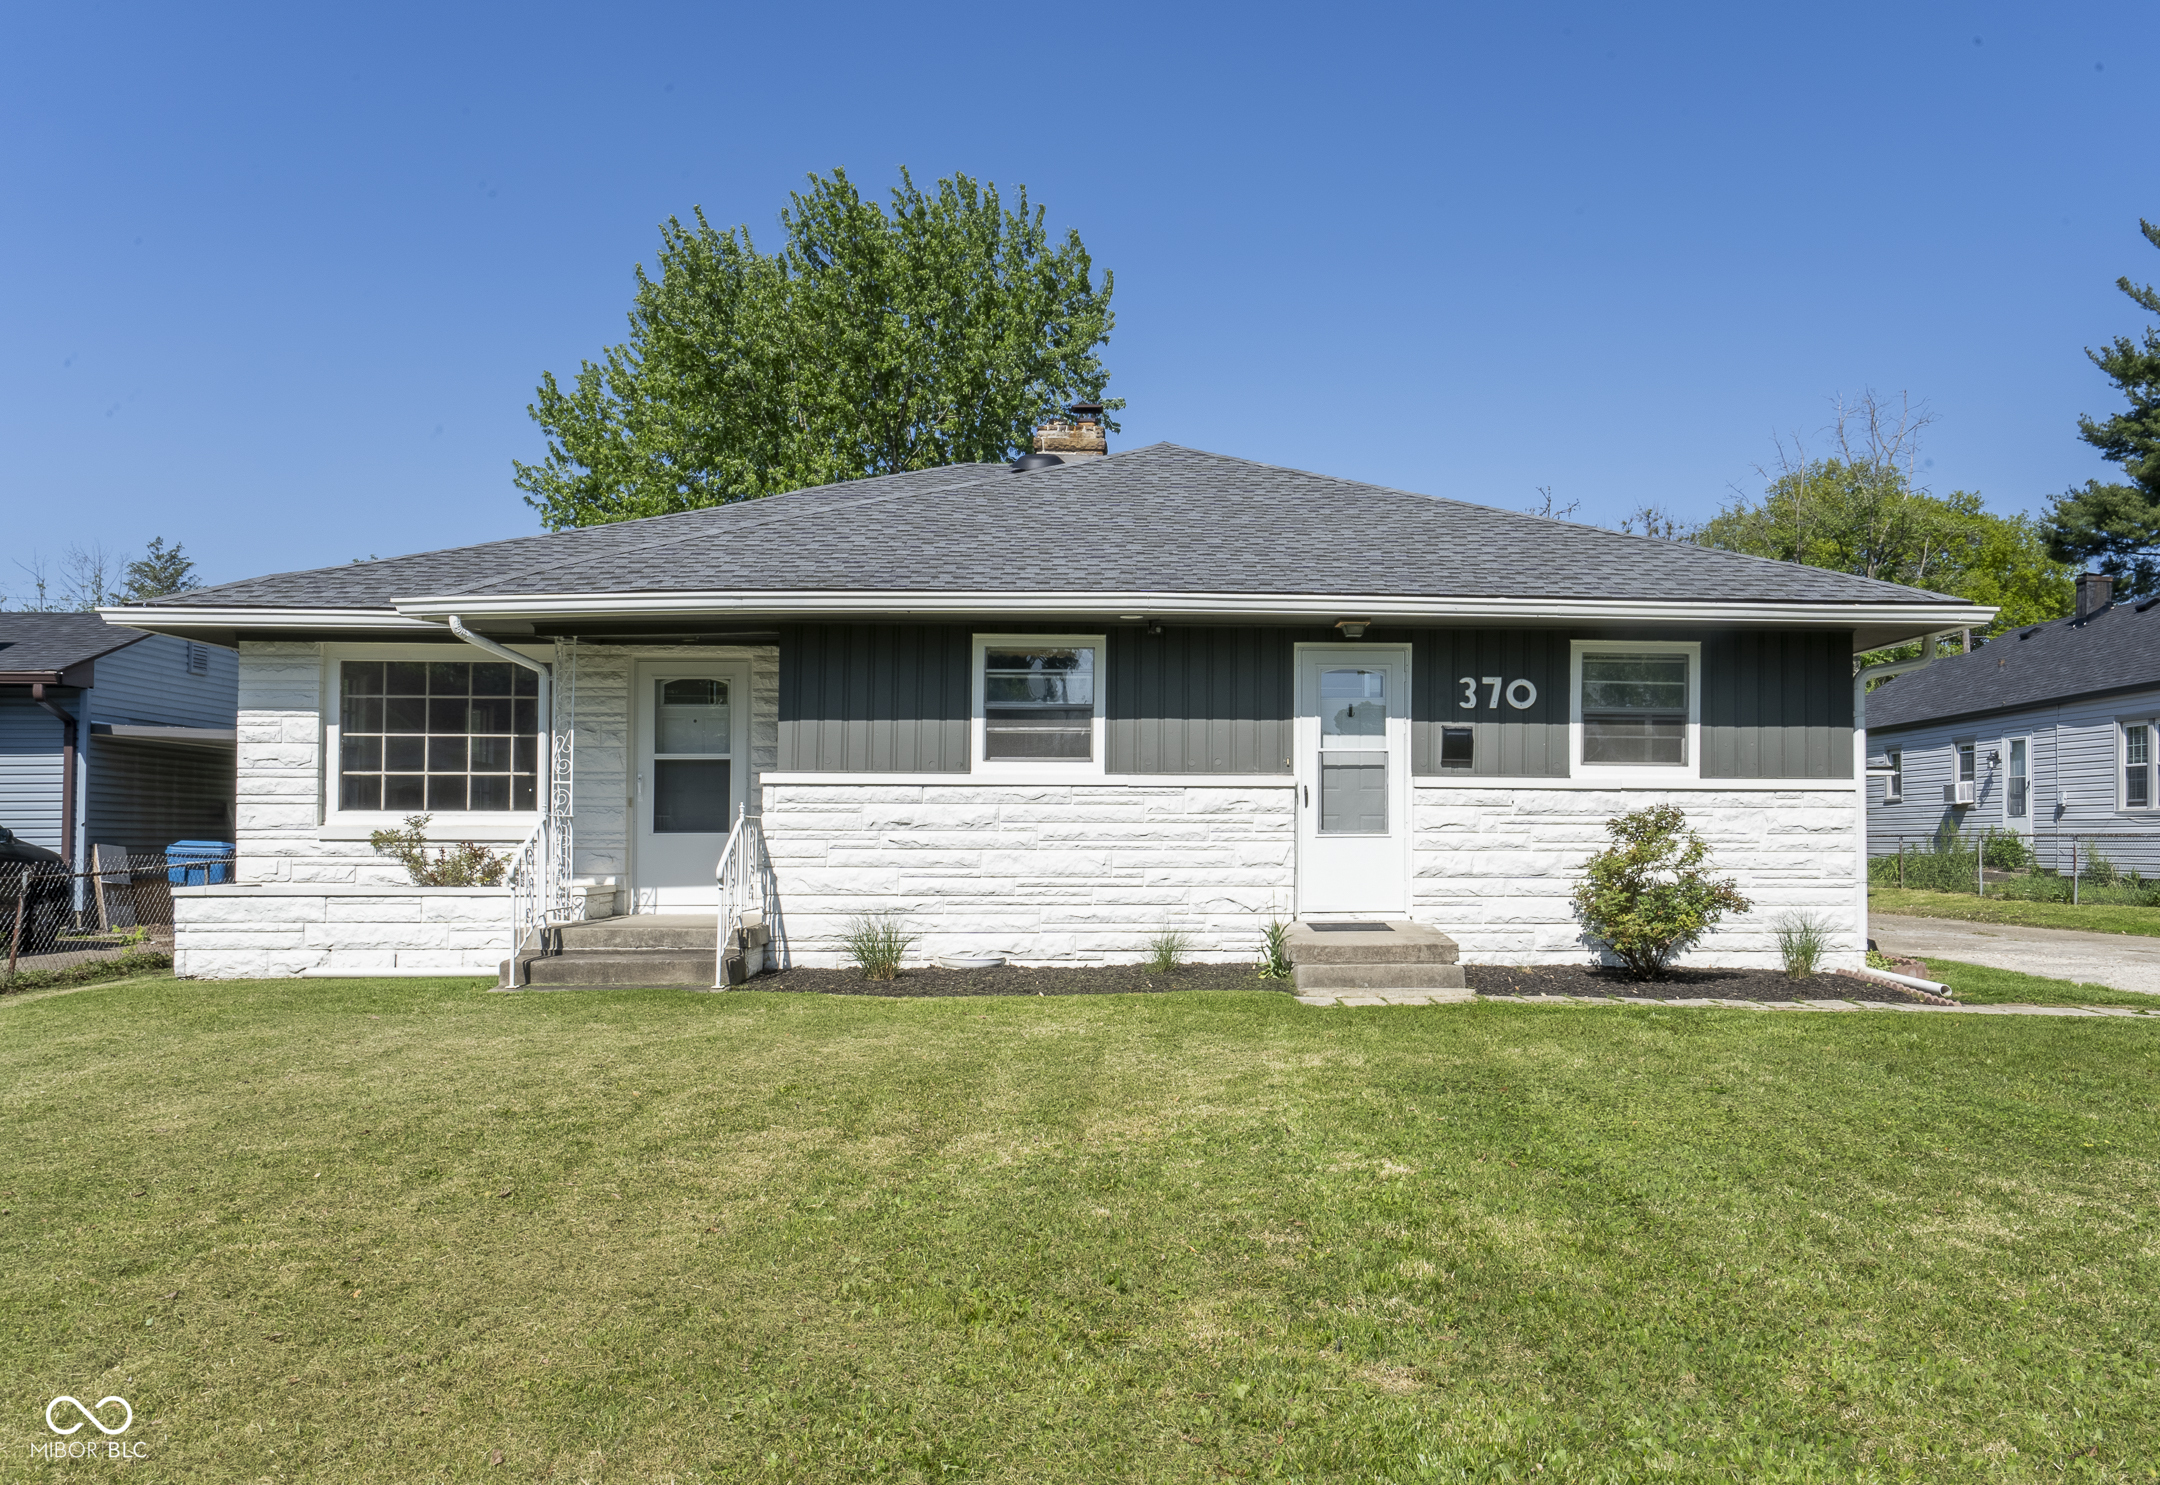
Active
$264,000
4
bds
|
3
ba
|
1,620
sqft
|
built
1957
370 N Bazil Ave, Indianapolis, IN 46219
$-248
Cash flow
-4.9%
Cash-on-Cash Return
5.0%
Cap rate
0.6%
Rent to Value Ratio
Active
$175,000
3
bds
|
1
ba
|
1,421
sqft
|
built
1959
7929 Roy Rd, Indianapolis, IN 46219
$139
Cash flow
4.1%
Cash-on-Cash Return
7.1%
Cap rate
0.9%
Rent to Value Ratio
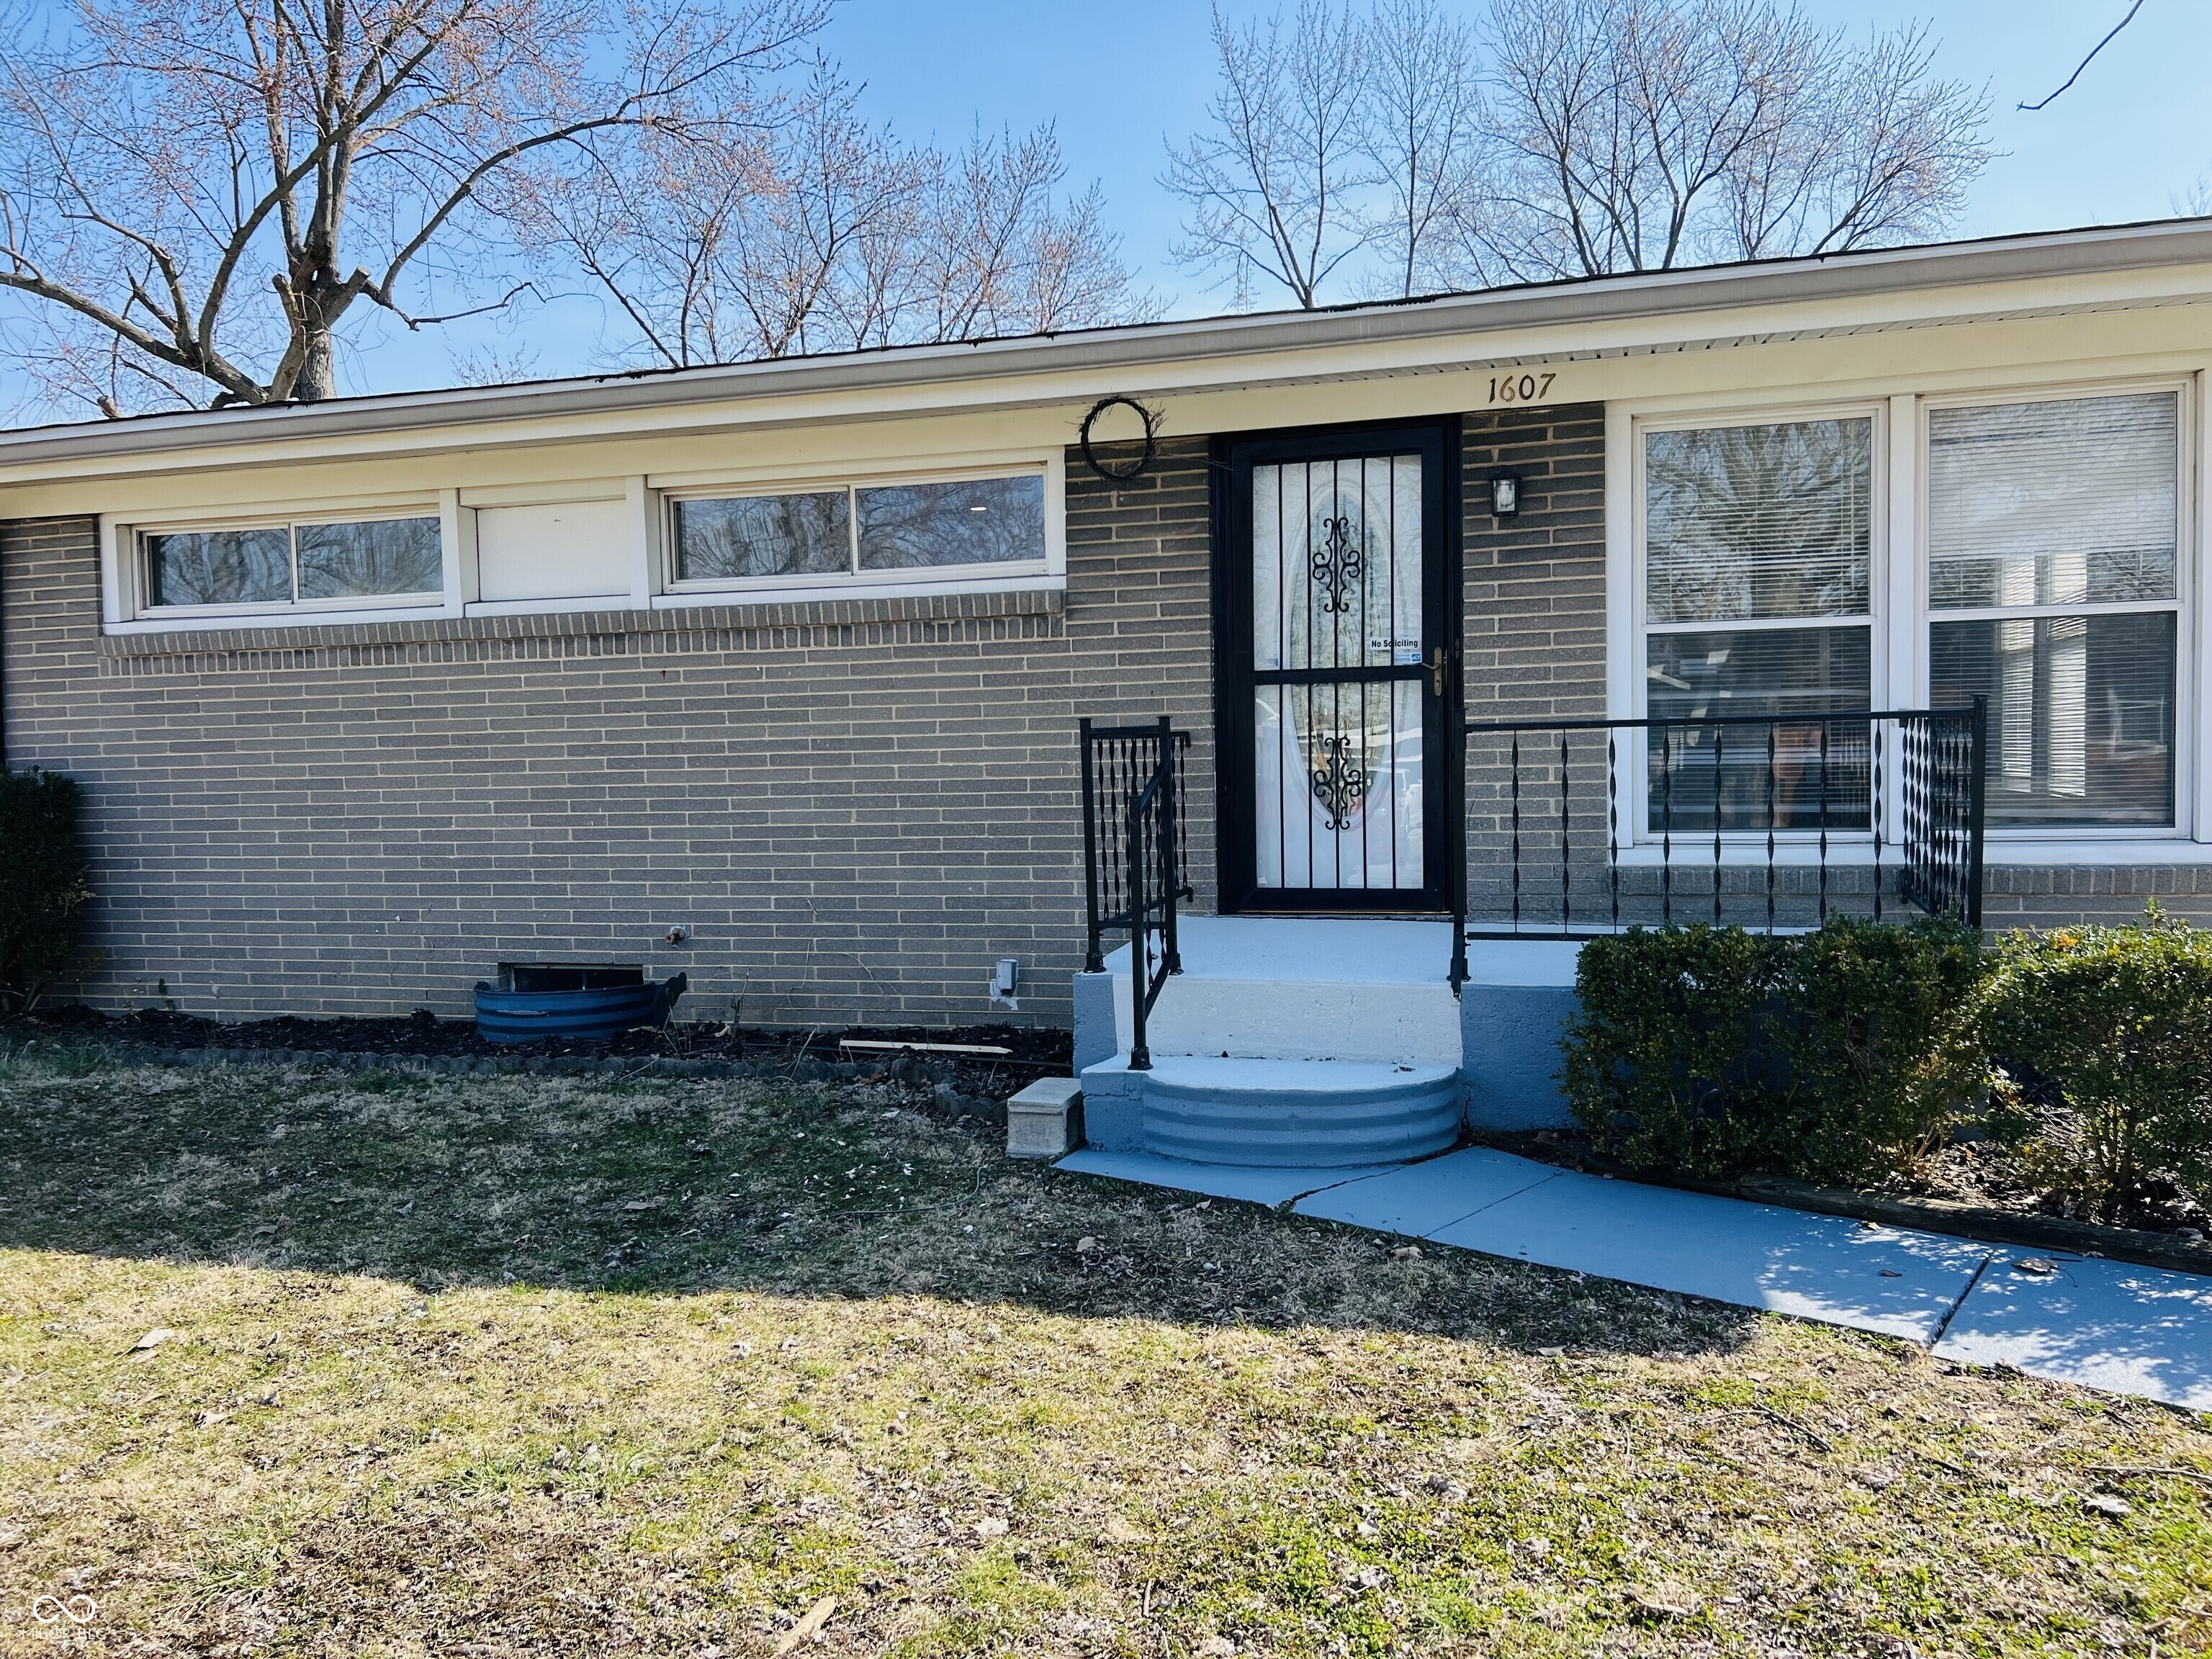
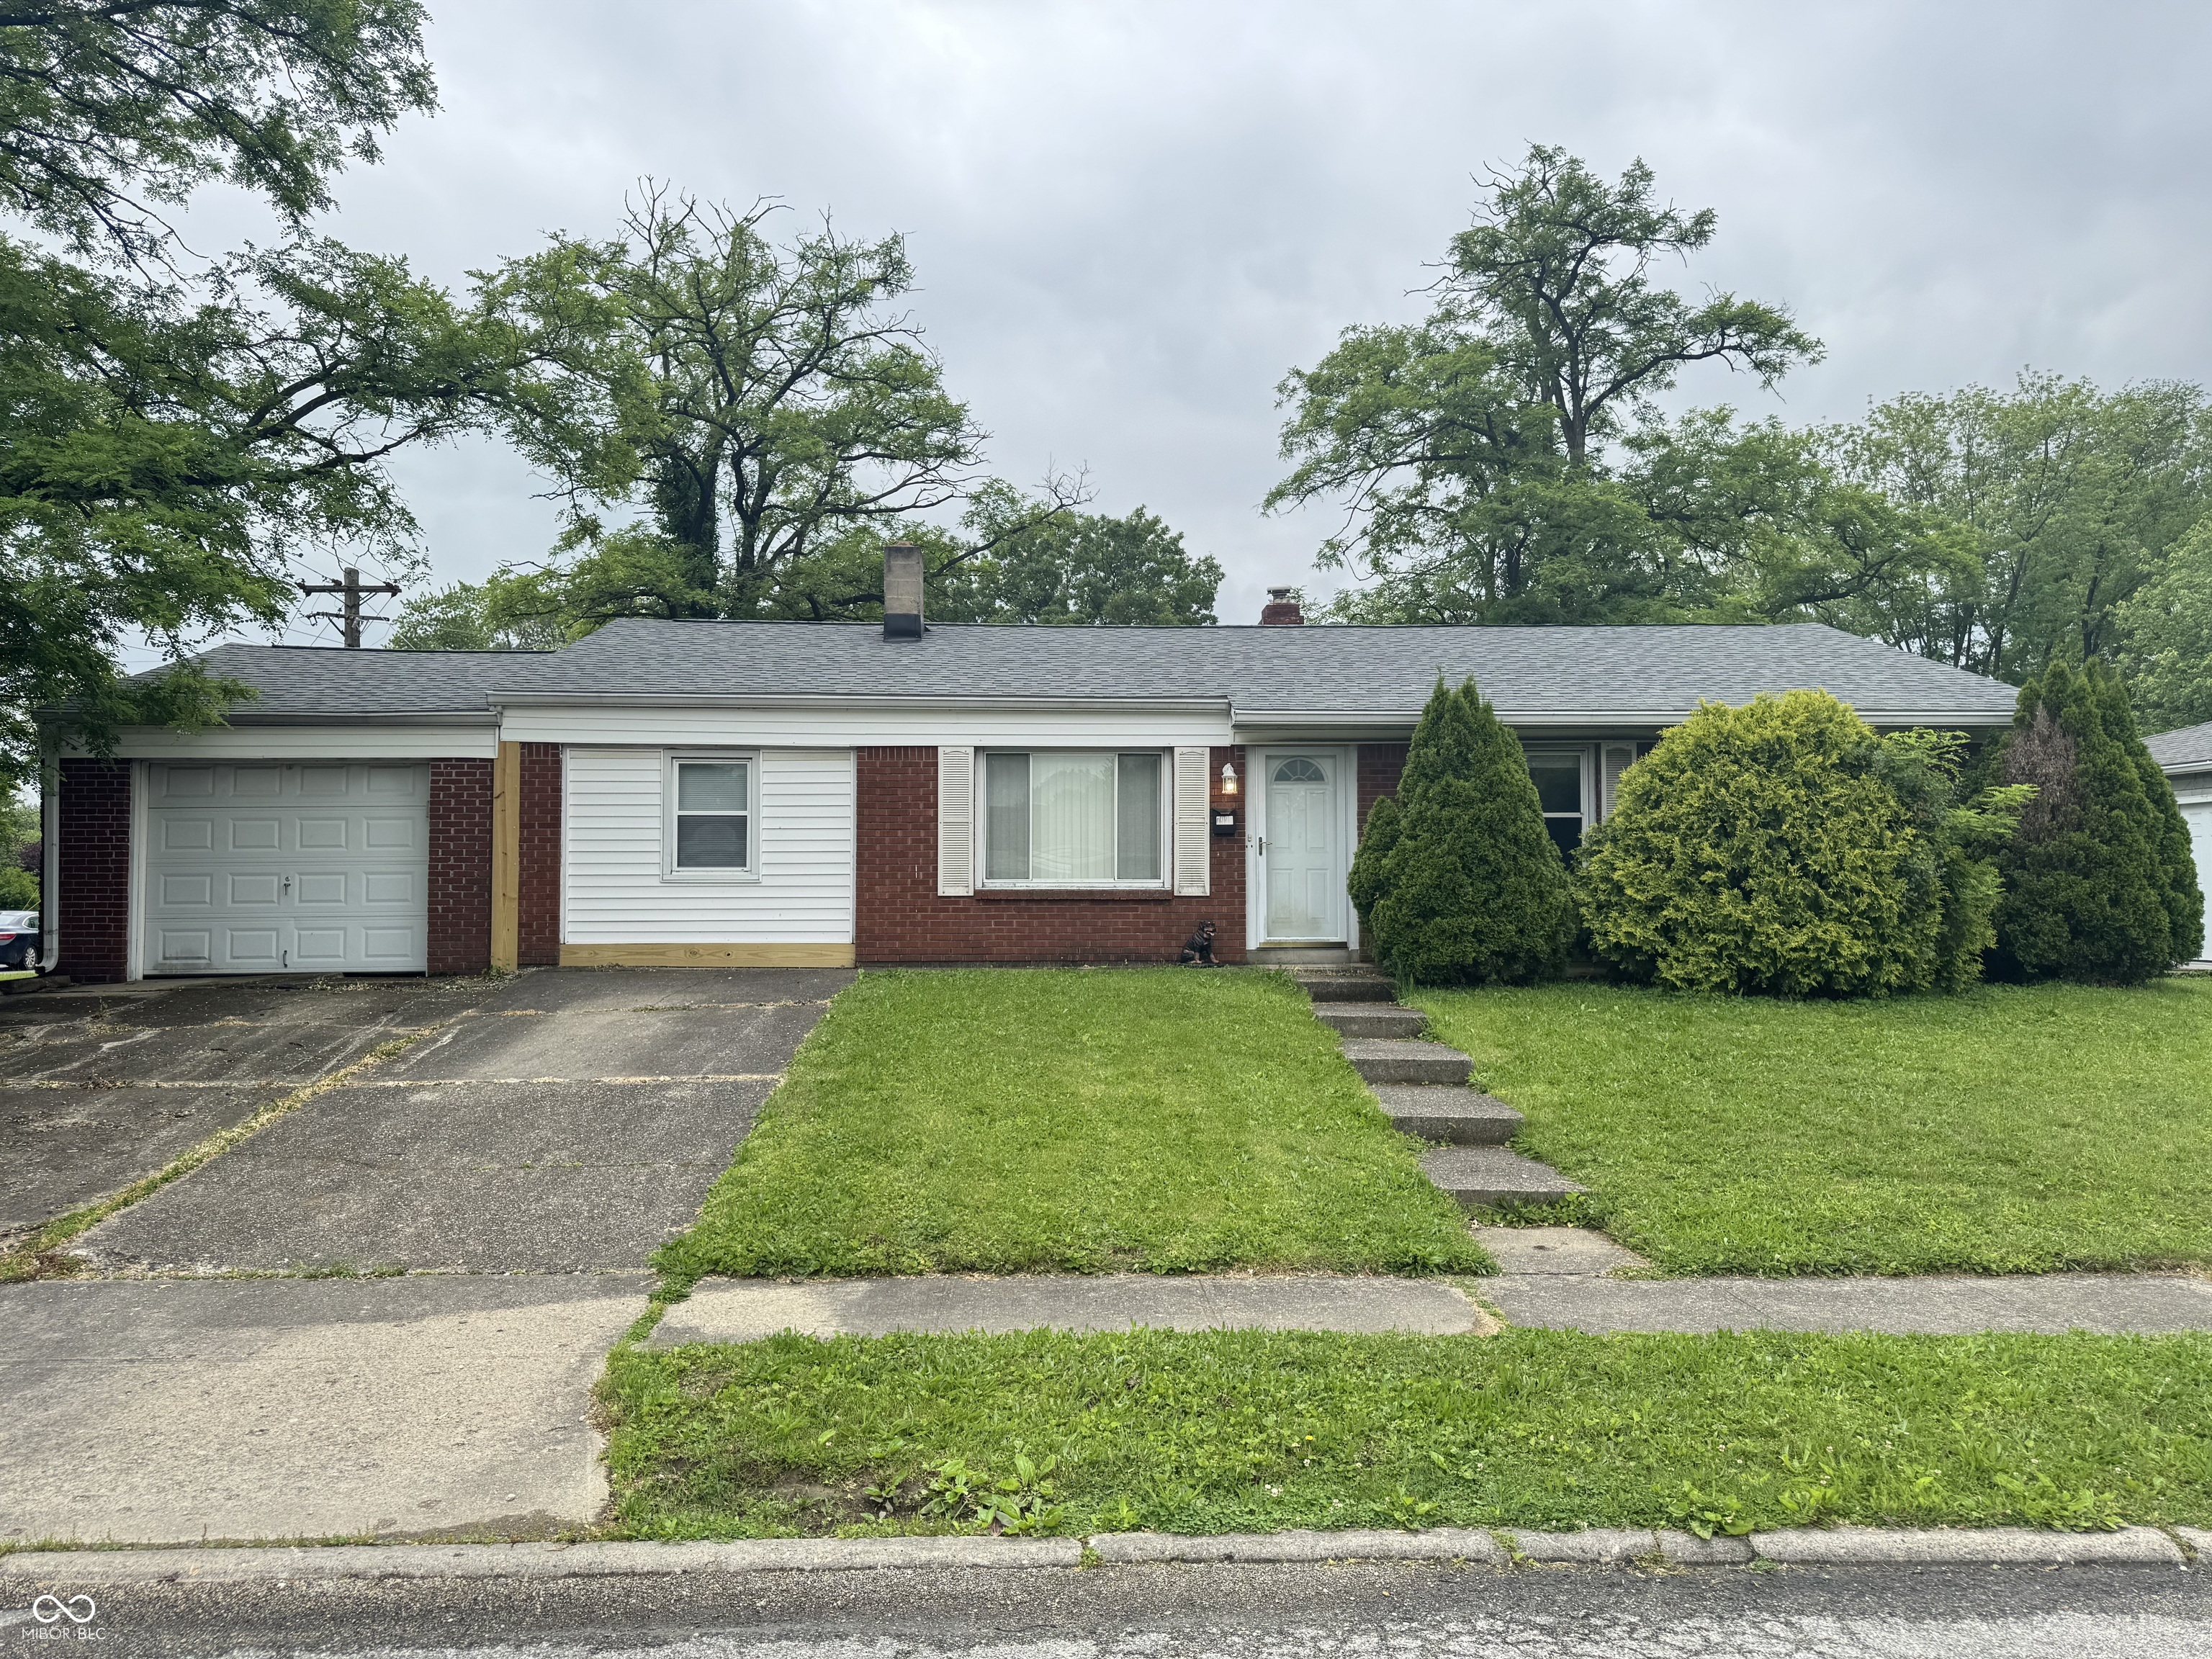
Active
$288,900
5
bds
|
2
ba
|
2,289
sqft
|
built
1956
1607 Elmhurst Dr, Indianapolis, IN 46219
$-238
Cash flow
-4.3%
Cash-on-Cash Return
5.2%
Cap rate
0.6%
Rent to Value Ratio
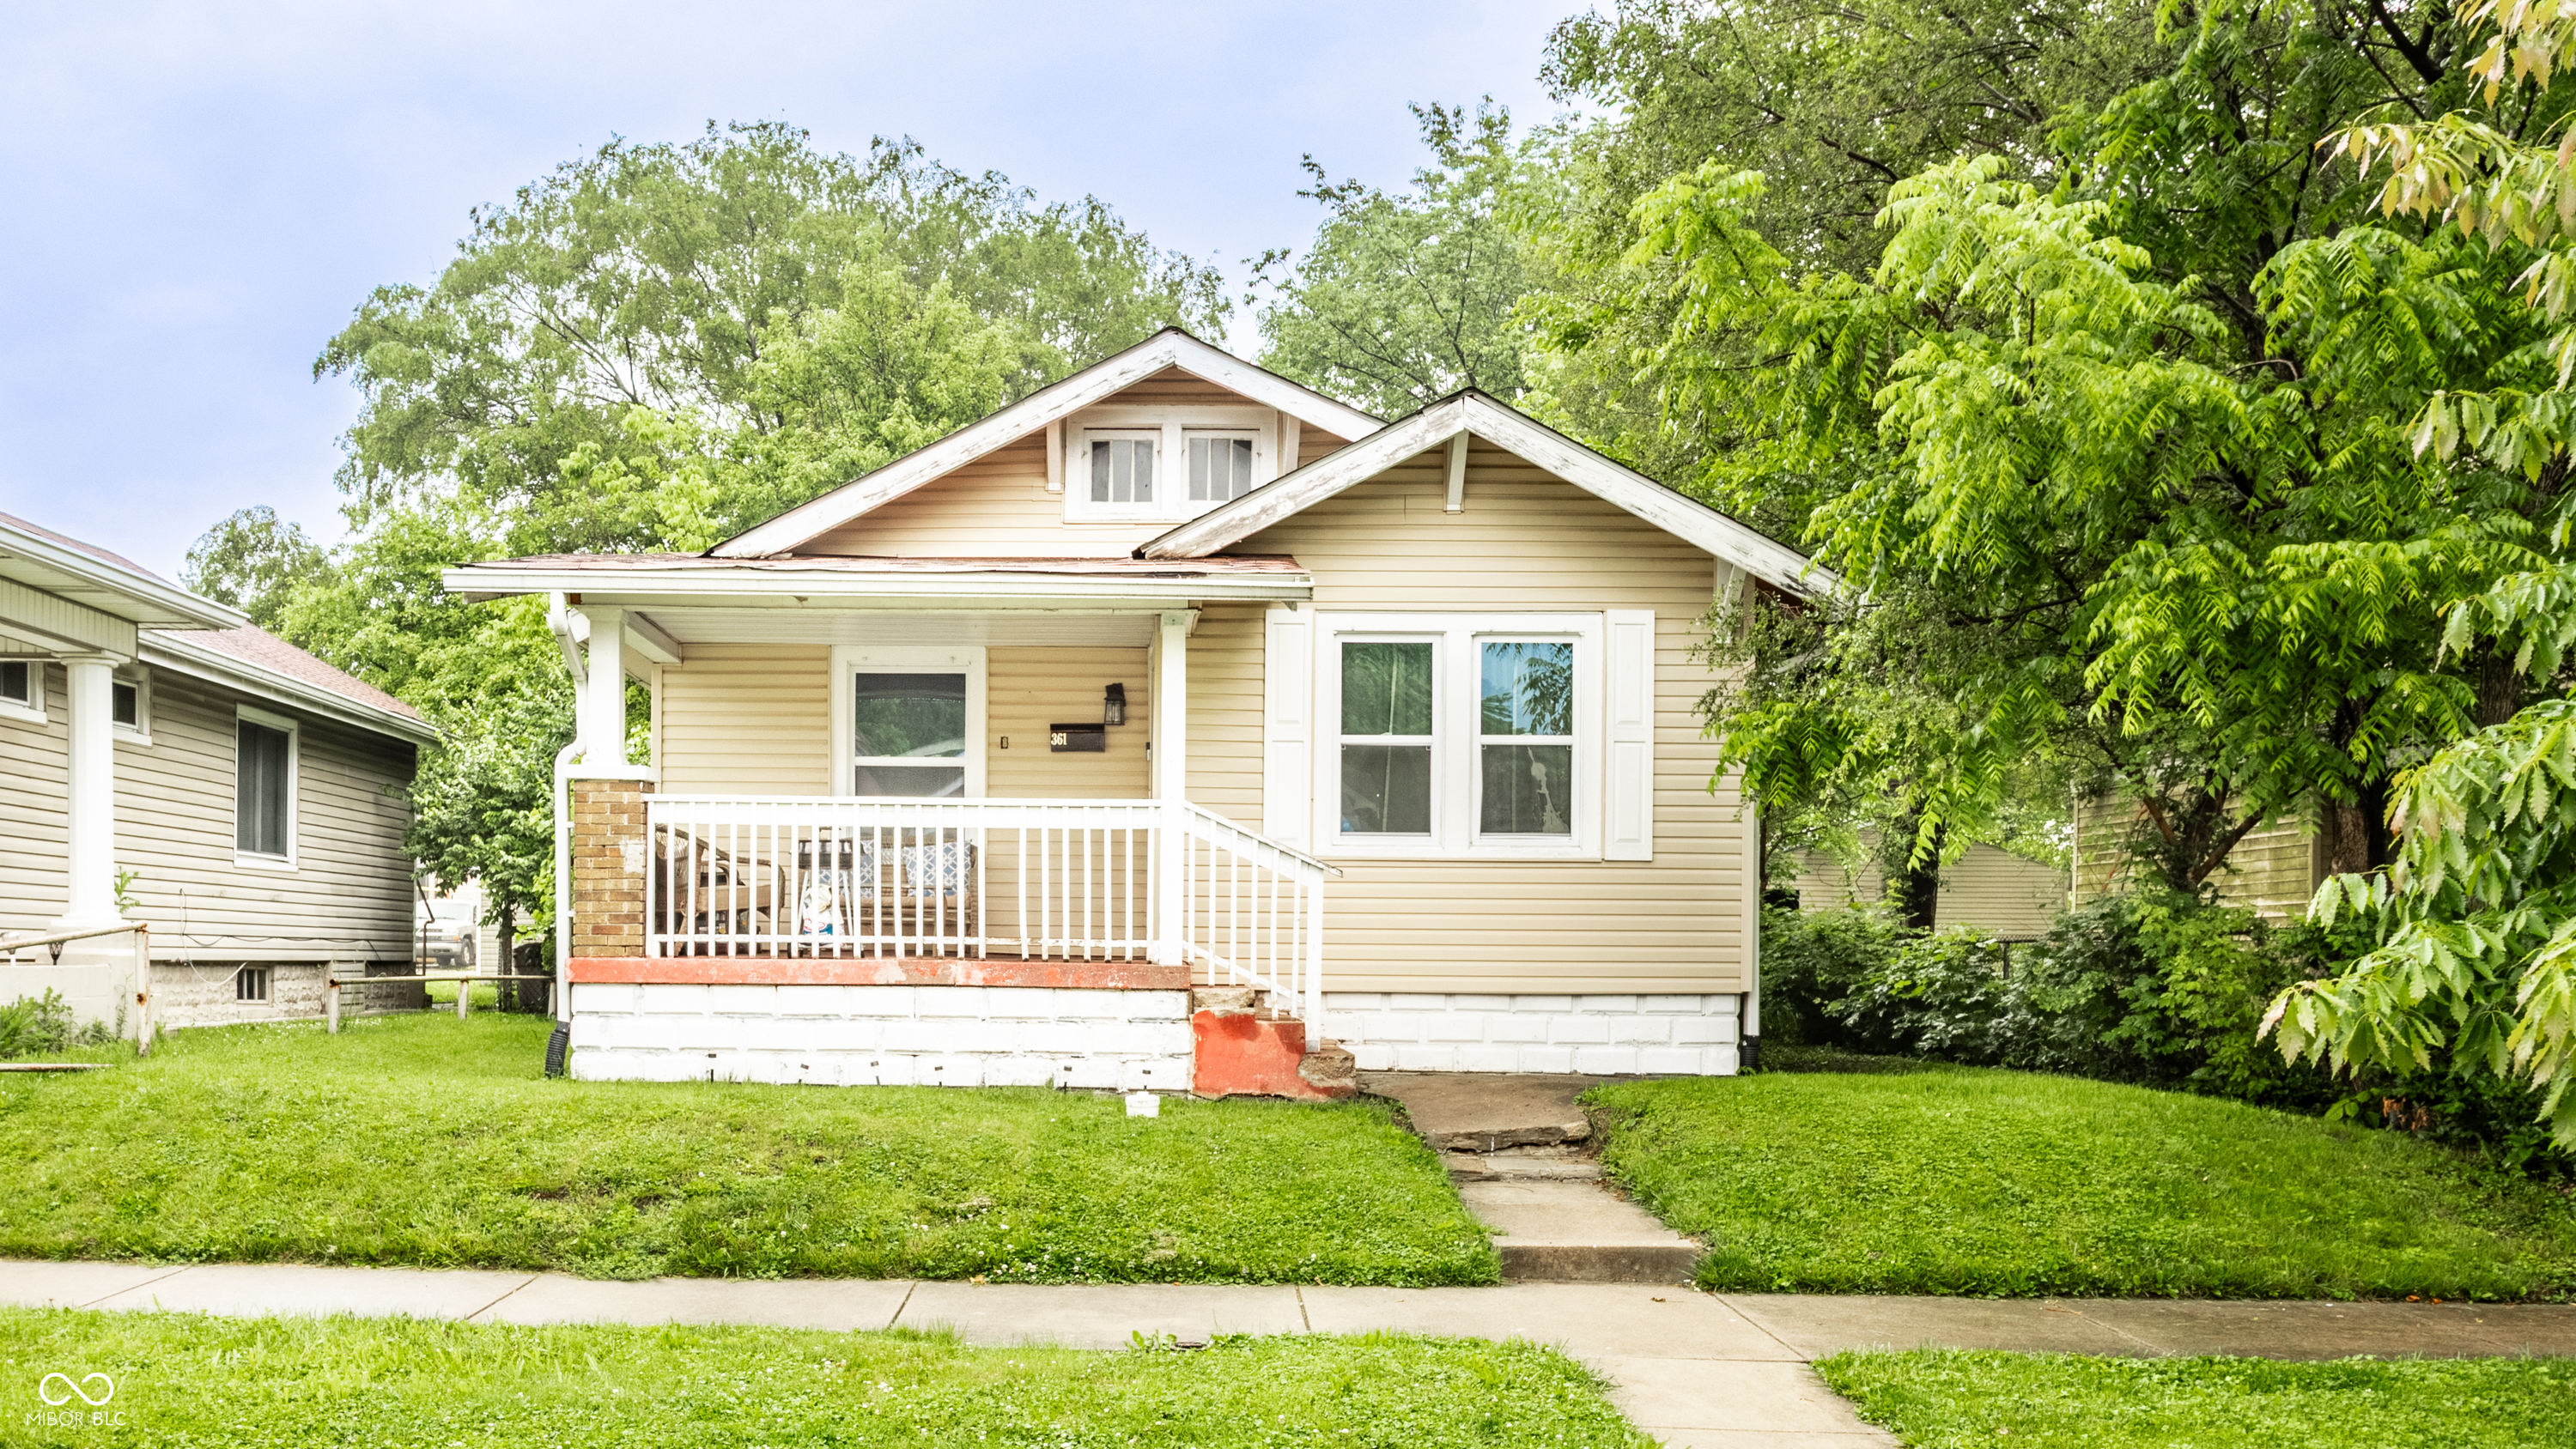
Active
$135,000
2
bds
|
1
ba
|
930
sqft
|
built
1920
361 S Spencer Ave, Indianapolis, IN 46219
$274
Cash flow
10.6%
Cash-on-Cash Return
8.6%
Cap rate
1.0%
Rent to Value Ratio
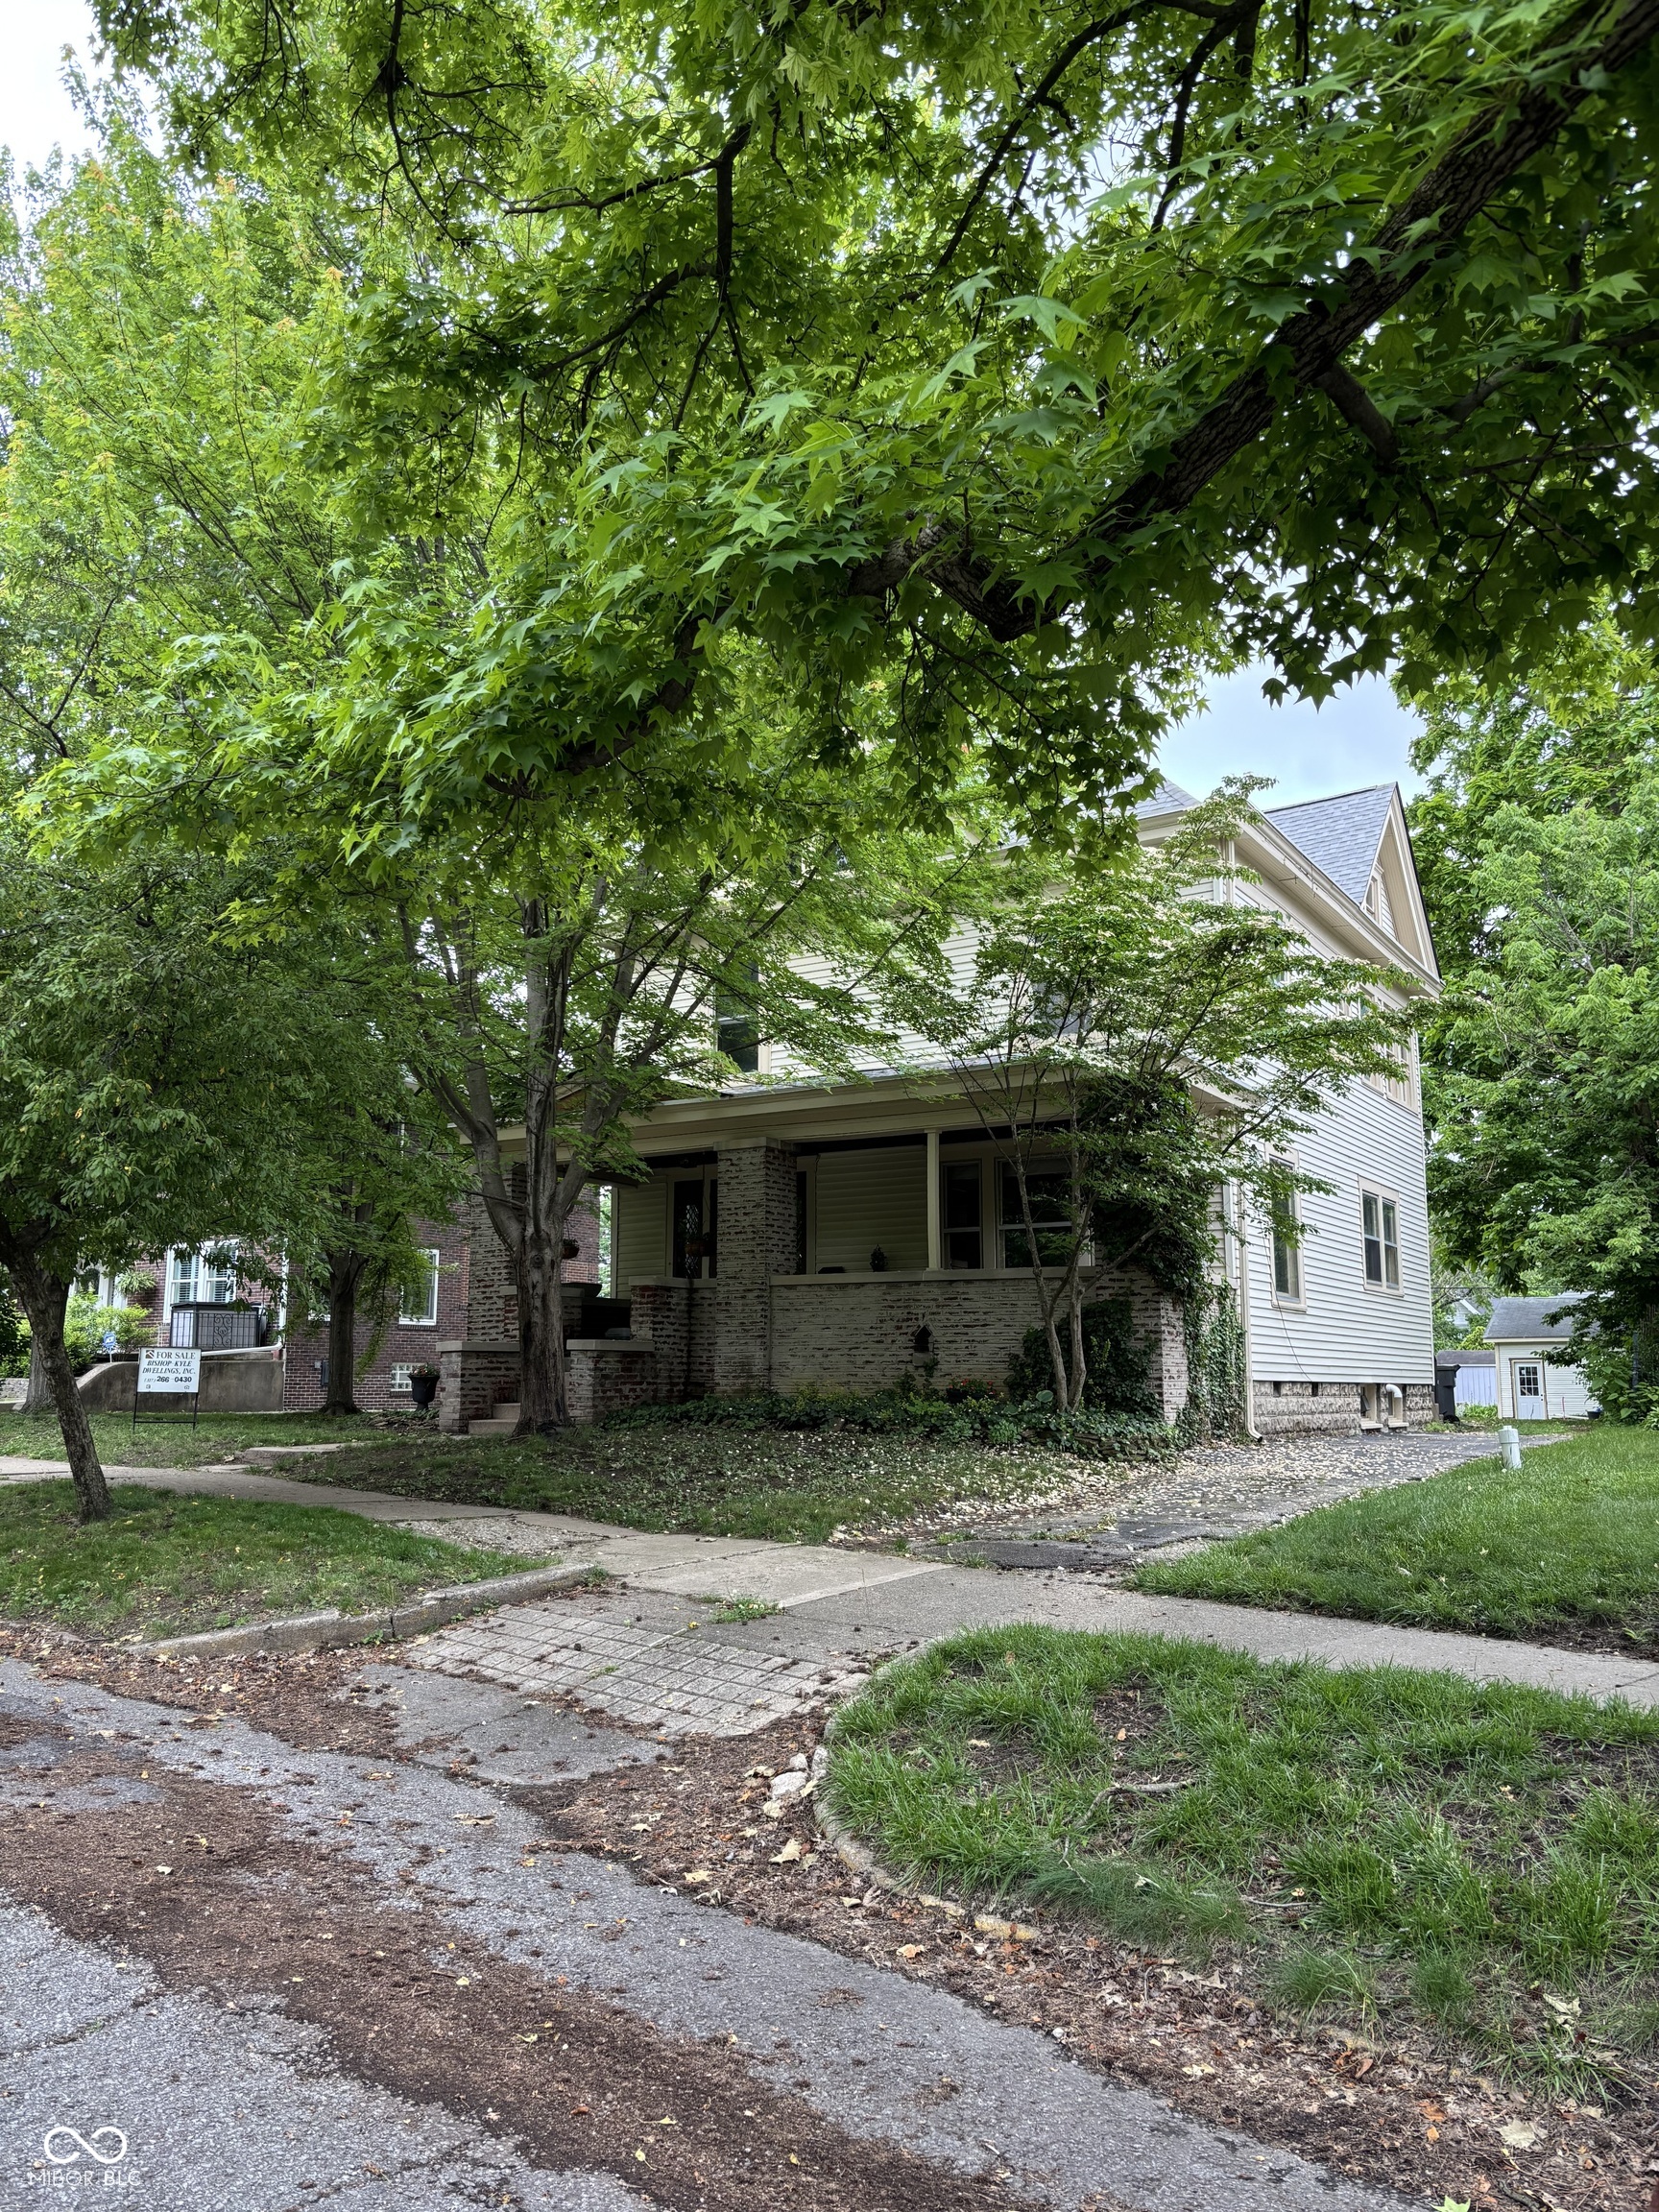
Active
$575,000
4
bds
|
4
ba
|
2,240
sqft
|
built
1910
48 N Audubon Rd, Indianapolis, IN 46219
$-1,220
Cash flow
-11.1%
Cash-on-Cash Return
3.6%
Cap rate
0.4%
Rent to Value Ratio
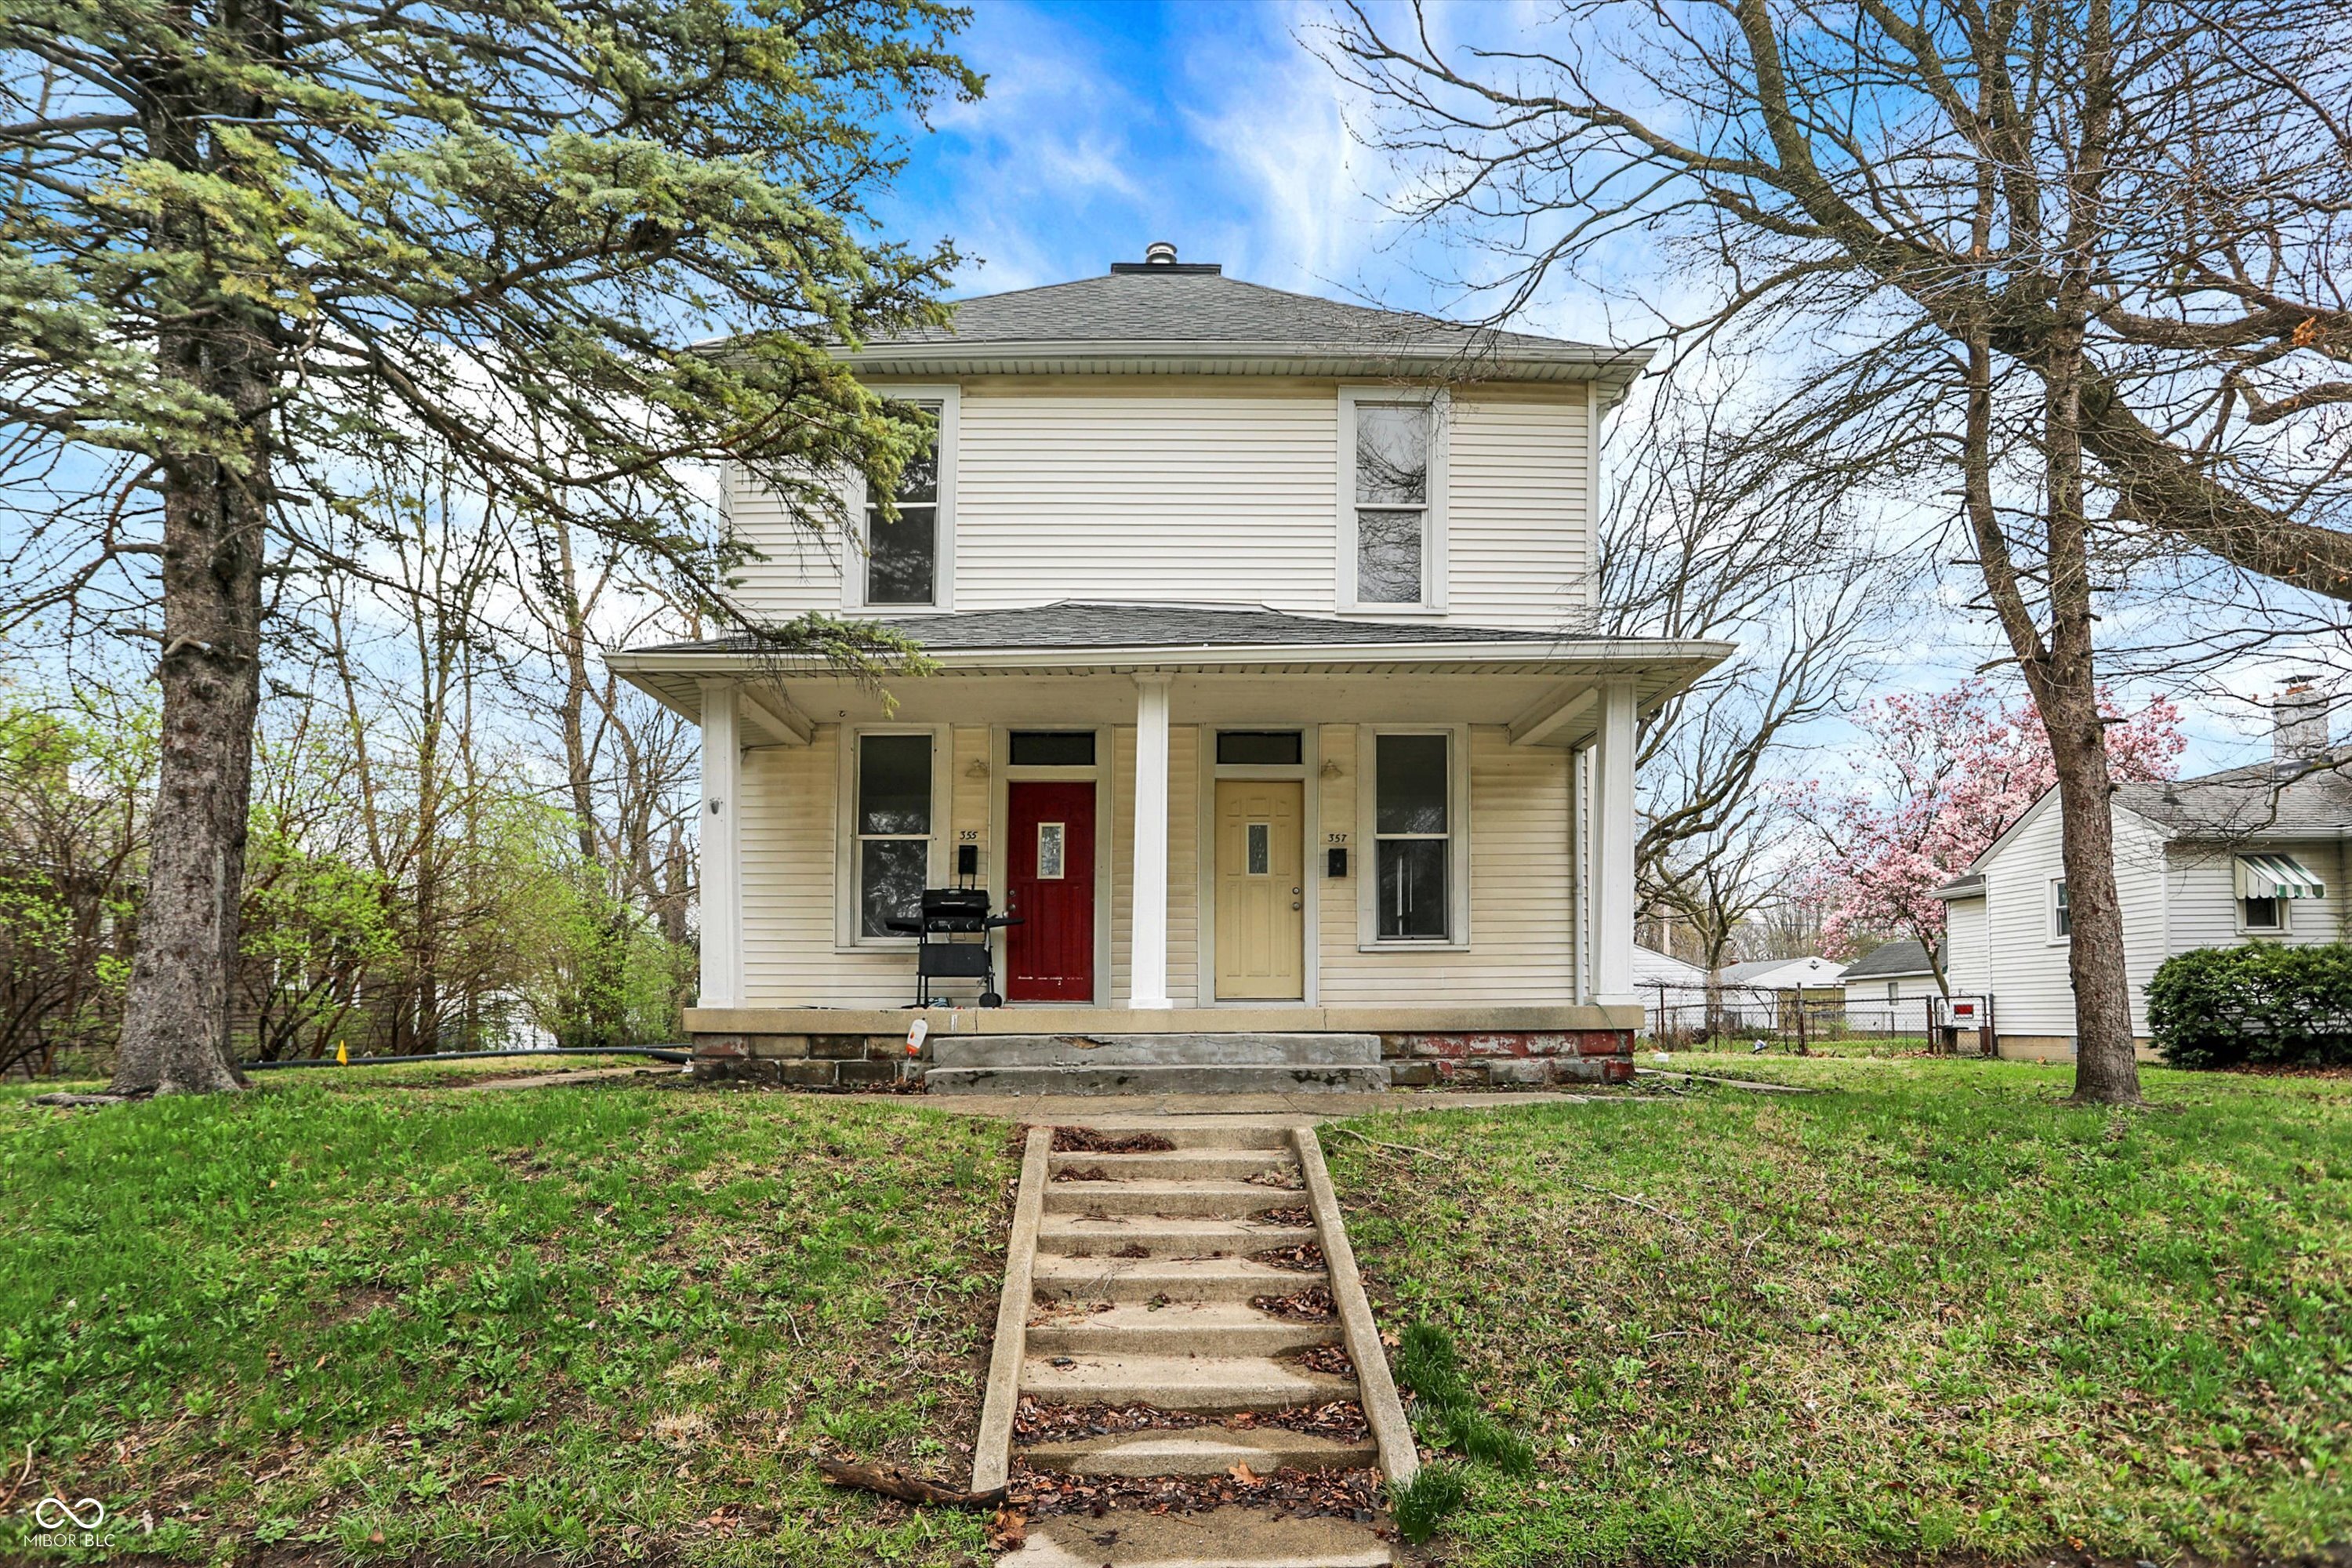
Pending
$239,900
4
bds
|
0
ba
|
0
sqft
|
built
1939
355 S Arlington Ave, Indianapolis, IN 46219
$-539
Cash flow
-11.7%
Cash-on-Cash Return
3.5%
Cap rate
0.4%
Rent to Value Ratio
Active
$260,000
2
bds
|
1
ba
|
1,311
sqft
|
built
1937
5435 E 10th St, Indianapolis, IN 46219
$48
Cash flow
1.0%
Cash-on-Cash Return
6.4%
Cap rate
0.8%
Rent to Value Ratio
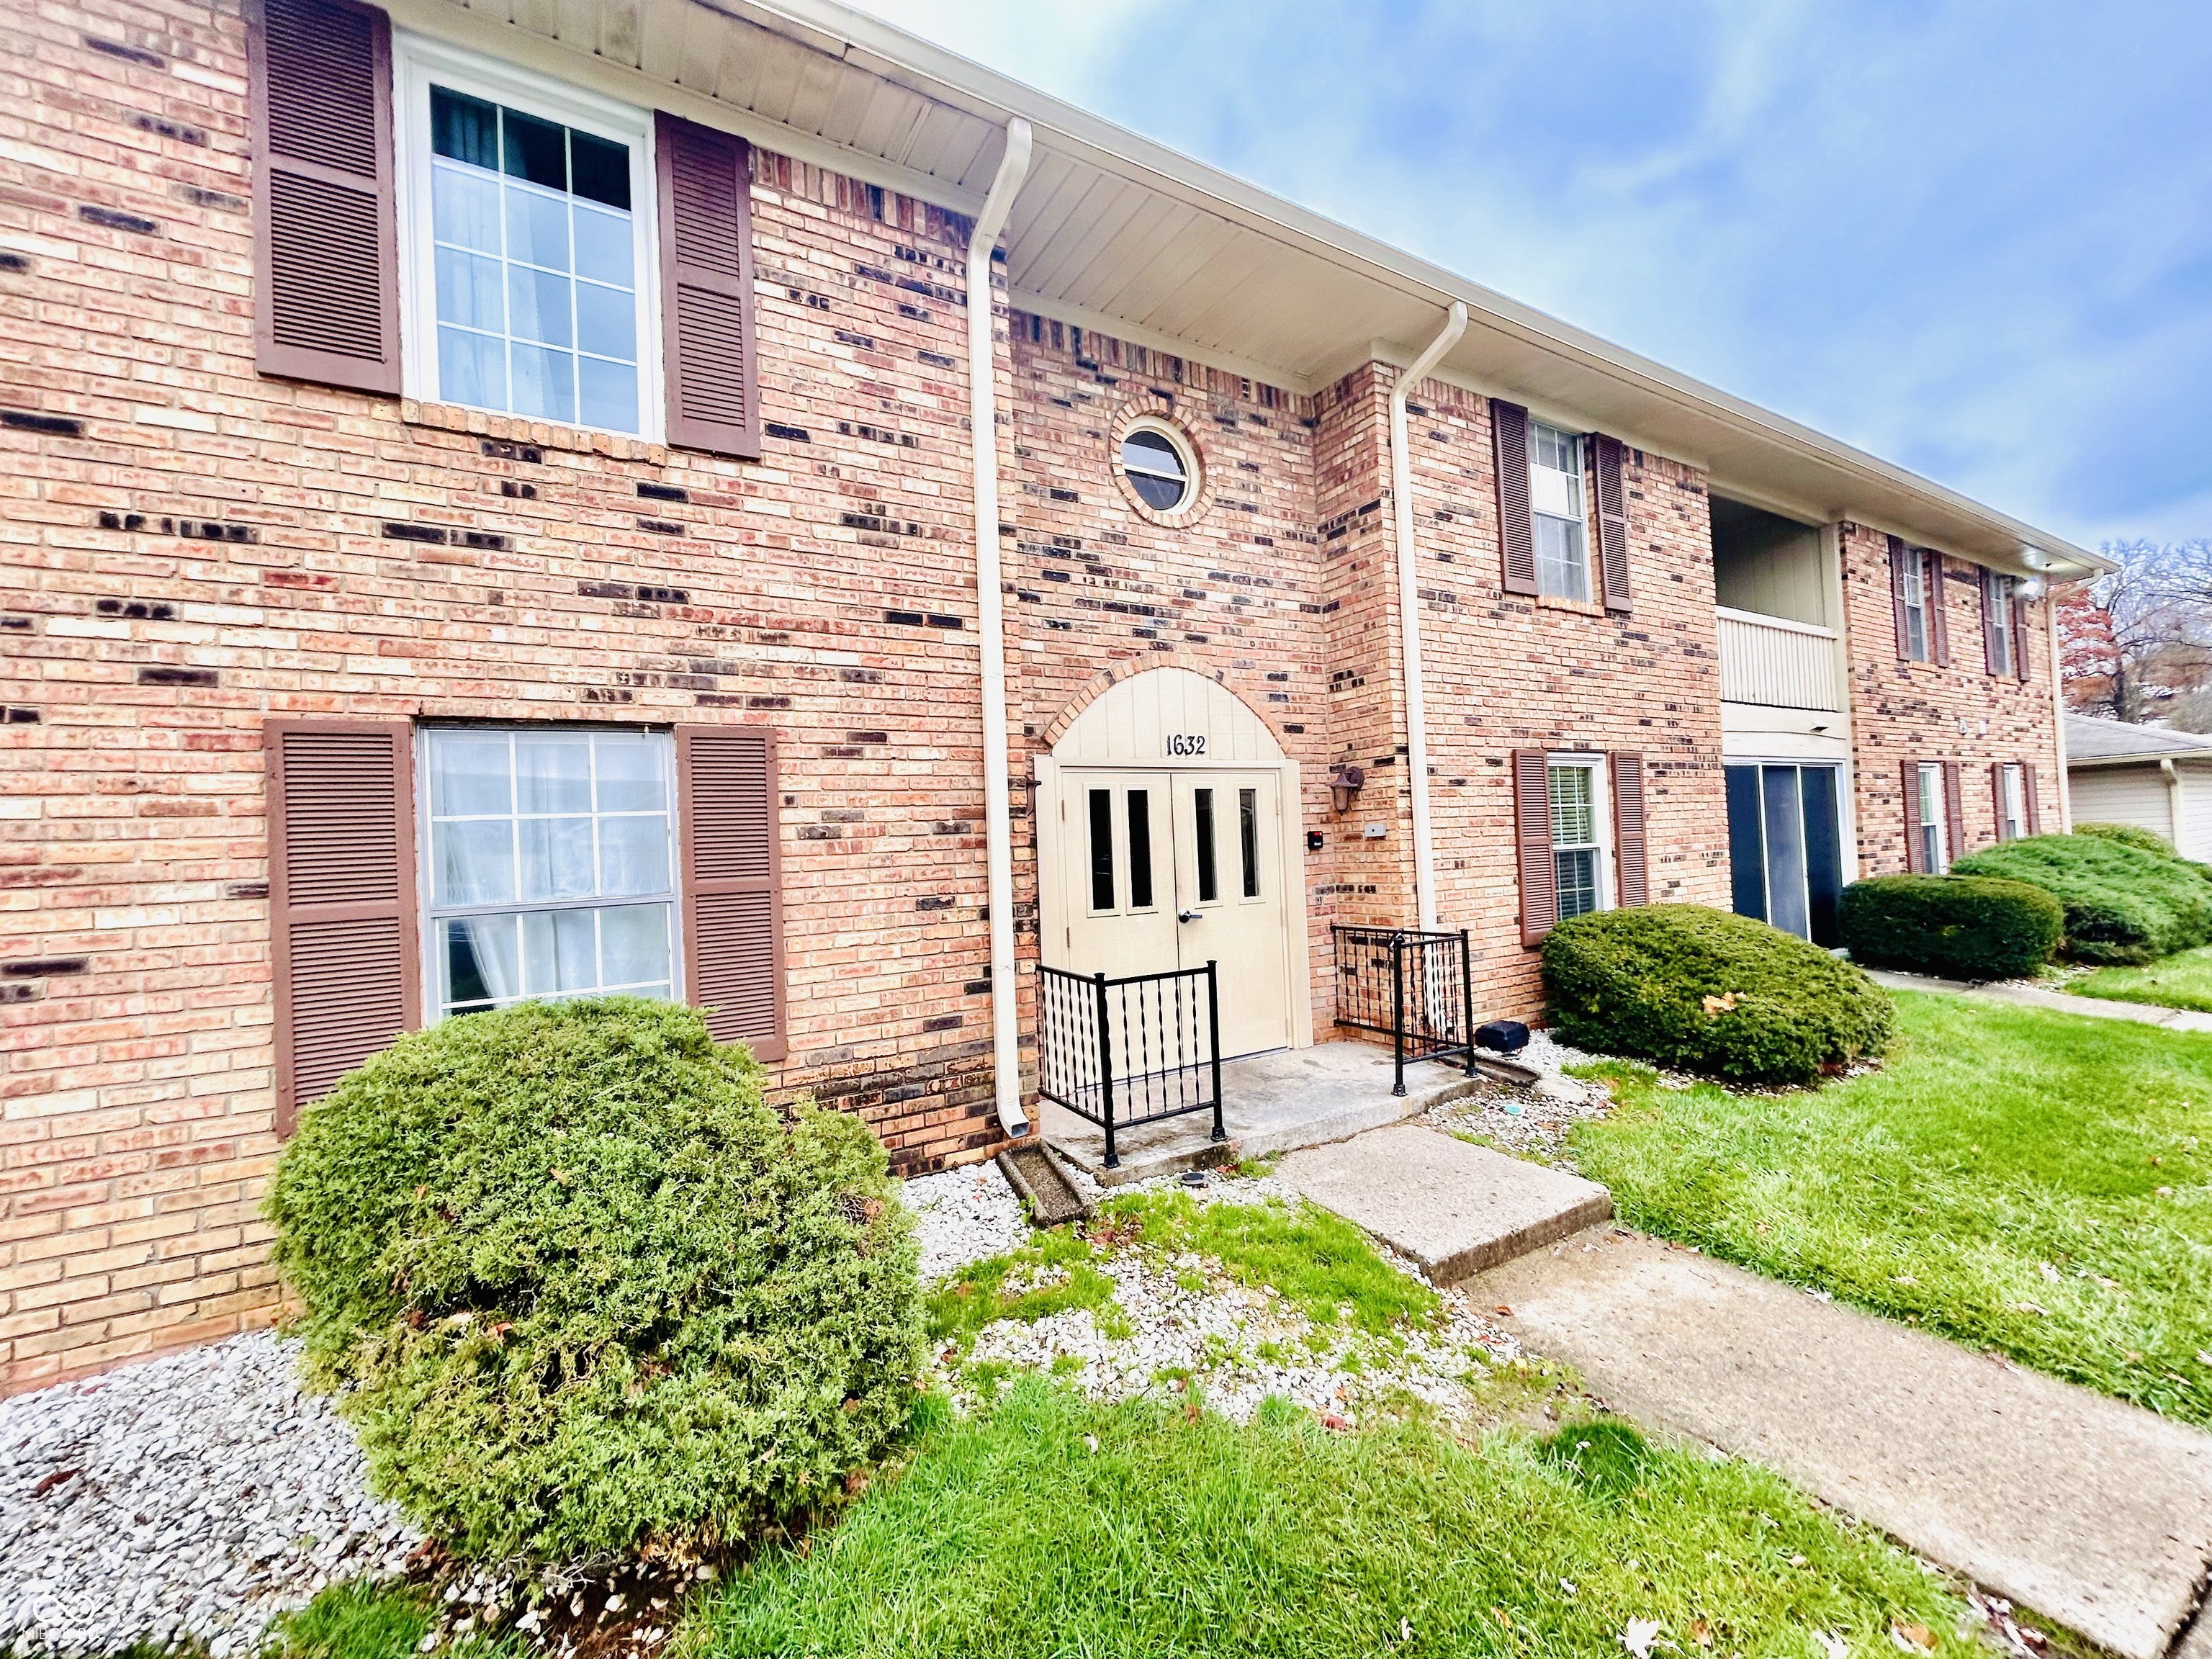
Active
$154,900
3
bds
|
2
ba
|
1,484
sqft
|
built
1974
1632 Queensbridge Sq, Indianapolis, IN 46219
$-137
Cash flow
-4.6%
Cash-on-Cash Return
5.1%
Cap rate
0.8%
Rent to Value Ratio
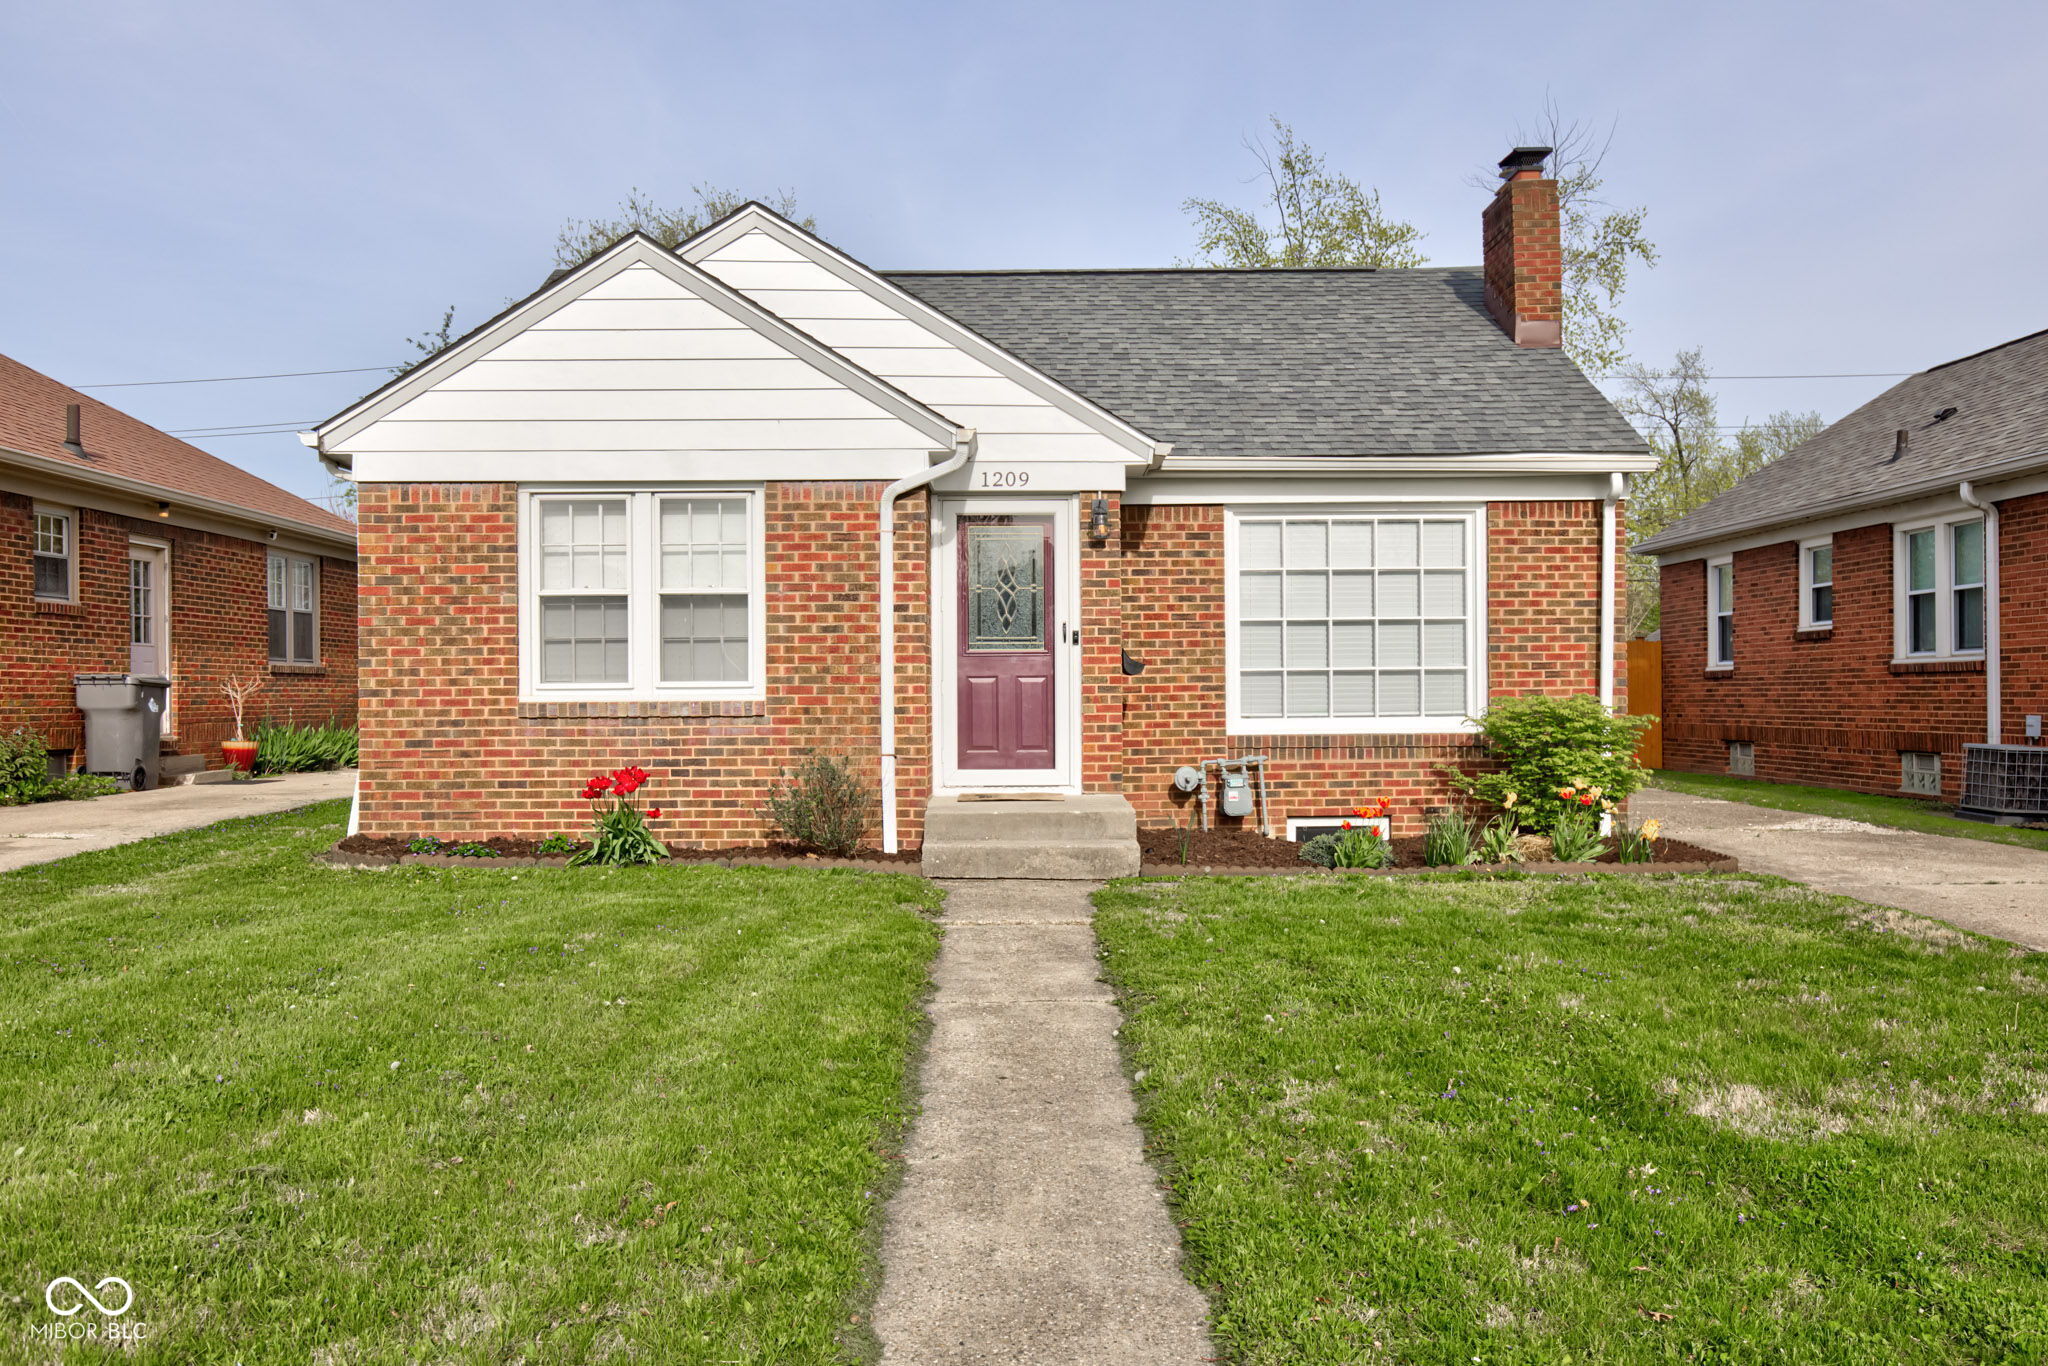
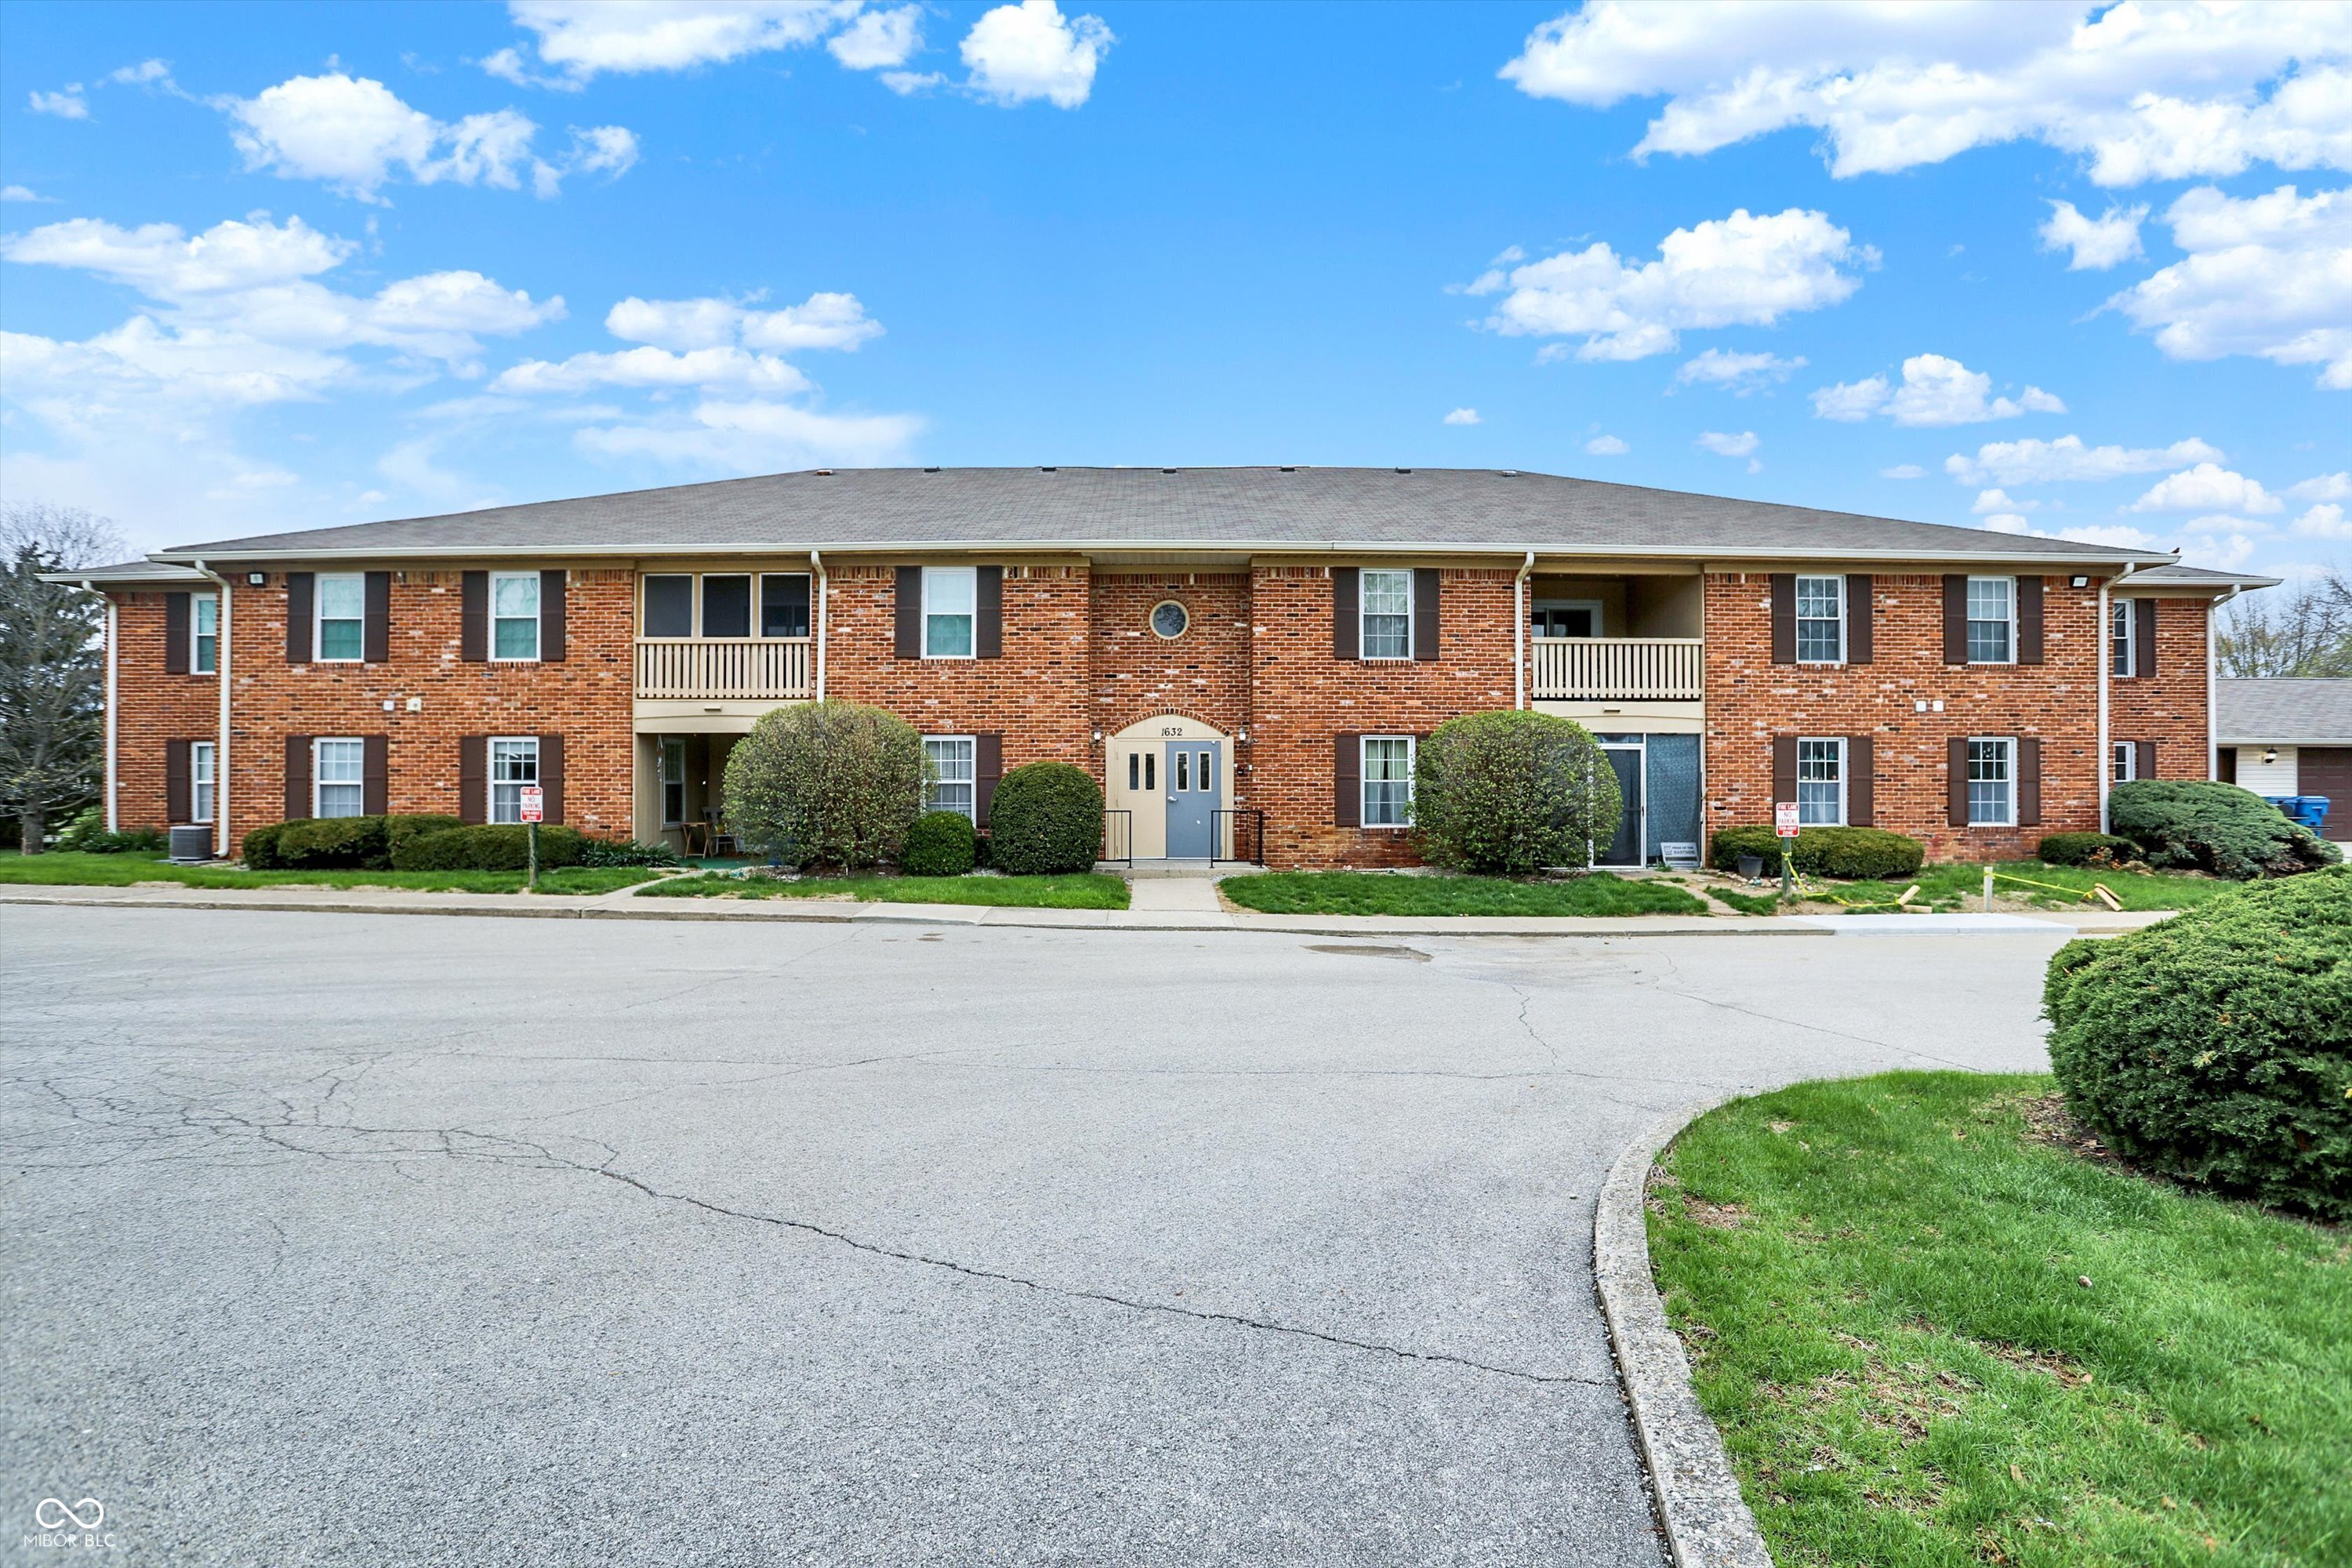
Active
$234,000
2
bds
|
1
ba
|
1,107
sqft
|
built
1947
1209 N Downey Ave, Indianapolis, IN 46219
$43
Cash flow
1.0%
Cash-on-Cash Return
6.4%
Cap rate
0.8%
Rent to Value Ratio
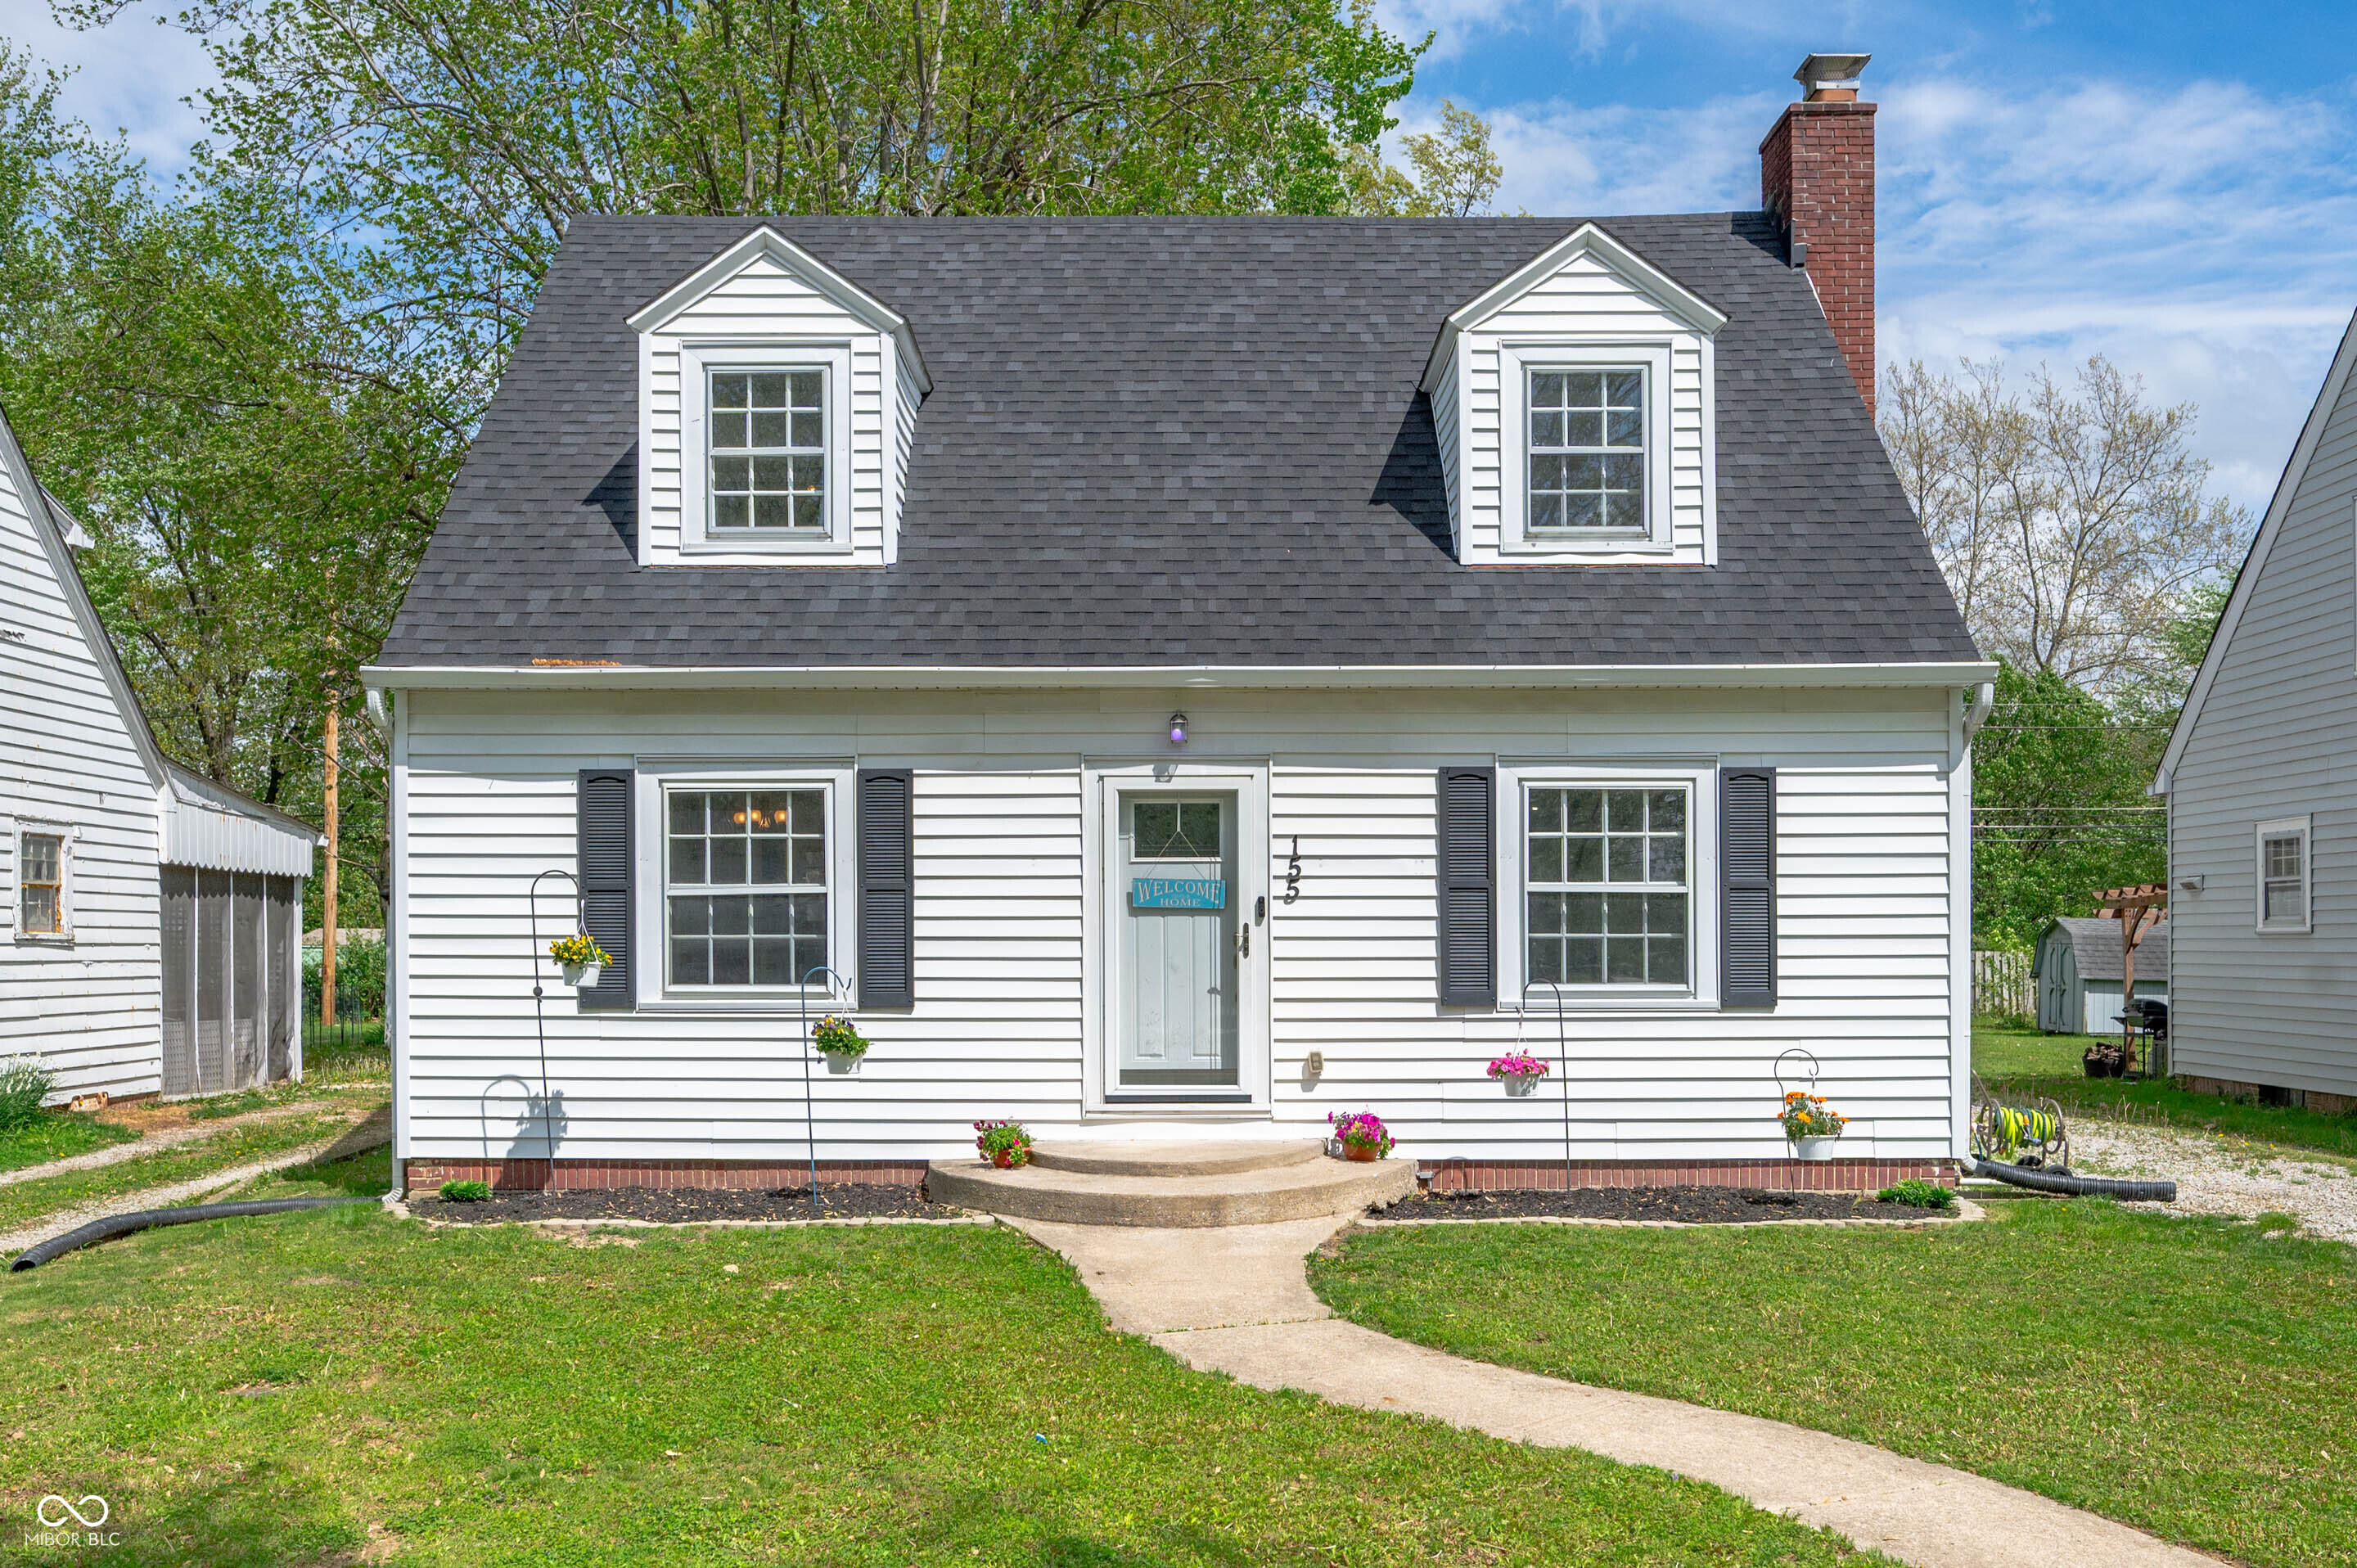
Active
$289,900
4
bds
|
2
ba
|
1,836
sqft
|
built
1941
155 N Franklin Rd, Indianapolis, IN 46219
$-243
Cash flow
-4.4%
Cash-on-Cash Return
5.1%
Cap rate
0.6%
Rent to Value Ratio
Active
$149,900
2
bds
|
2
ba
|
1,482
sqft
|
built
1974
1632 Wellesley Ct, Indianapolis, IN 46219
$-112
Cash flow
-3.9%
Cash-on-Cash Return
5.3%
Cap rate
0.9%
Rent to Value Ratio
Active
$295,000
3
bds
|
2
ba
|
2,282
sqft
|
built
1938
850 N Butler Ave, Indianapolis, IN 46219
$-269
Cash flow
-4.8%
Cash-on-Cash Return
5.1%
Cap rate
0.6%
Rent to Value Ratio
Active
$125,000
2
bds
|
0
ba
|
872
sqft
|
built
1870
324 Burgess Ave, Indianapolis, IN 46219
$326
Cash flow
13.6%
Cash-on-Cash Return
9.3%
Cap rate
1.1%
Rent to Value Ratio
Active
$165,000
5
bds
|
2
ba
|
1,036
sqft
|
built
2004
6215 E 11th St, Indianapolis, IN 46219
$52
Cash flow
1.6%
Cash-on-Cash Return
6.5%
Cap rate
0.8%
Rent to Value Ratio
Active
$185,000
3
bds
|
1
ba
|
1,421
sqft
|
built
1961
8902 Carla Dr, Indianapolis, IN 46219
$156
Cash flow
4.4%
Cash-on-Cash Return
7.2%
Cap rate
0.9%
Rent to Value Ratio
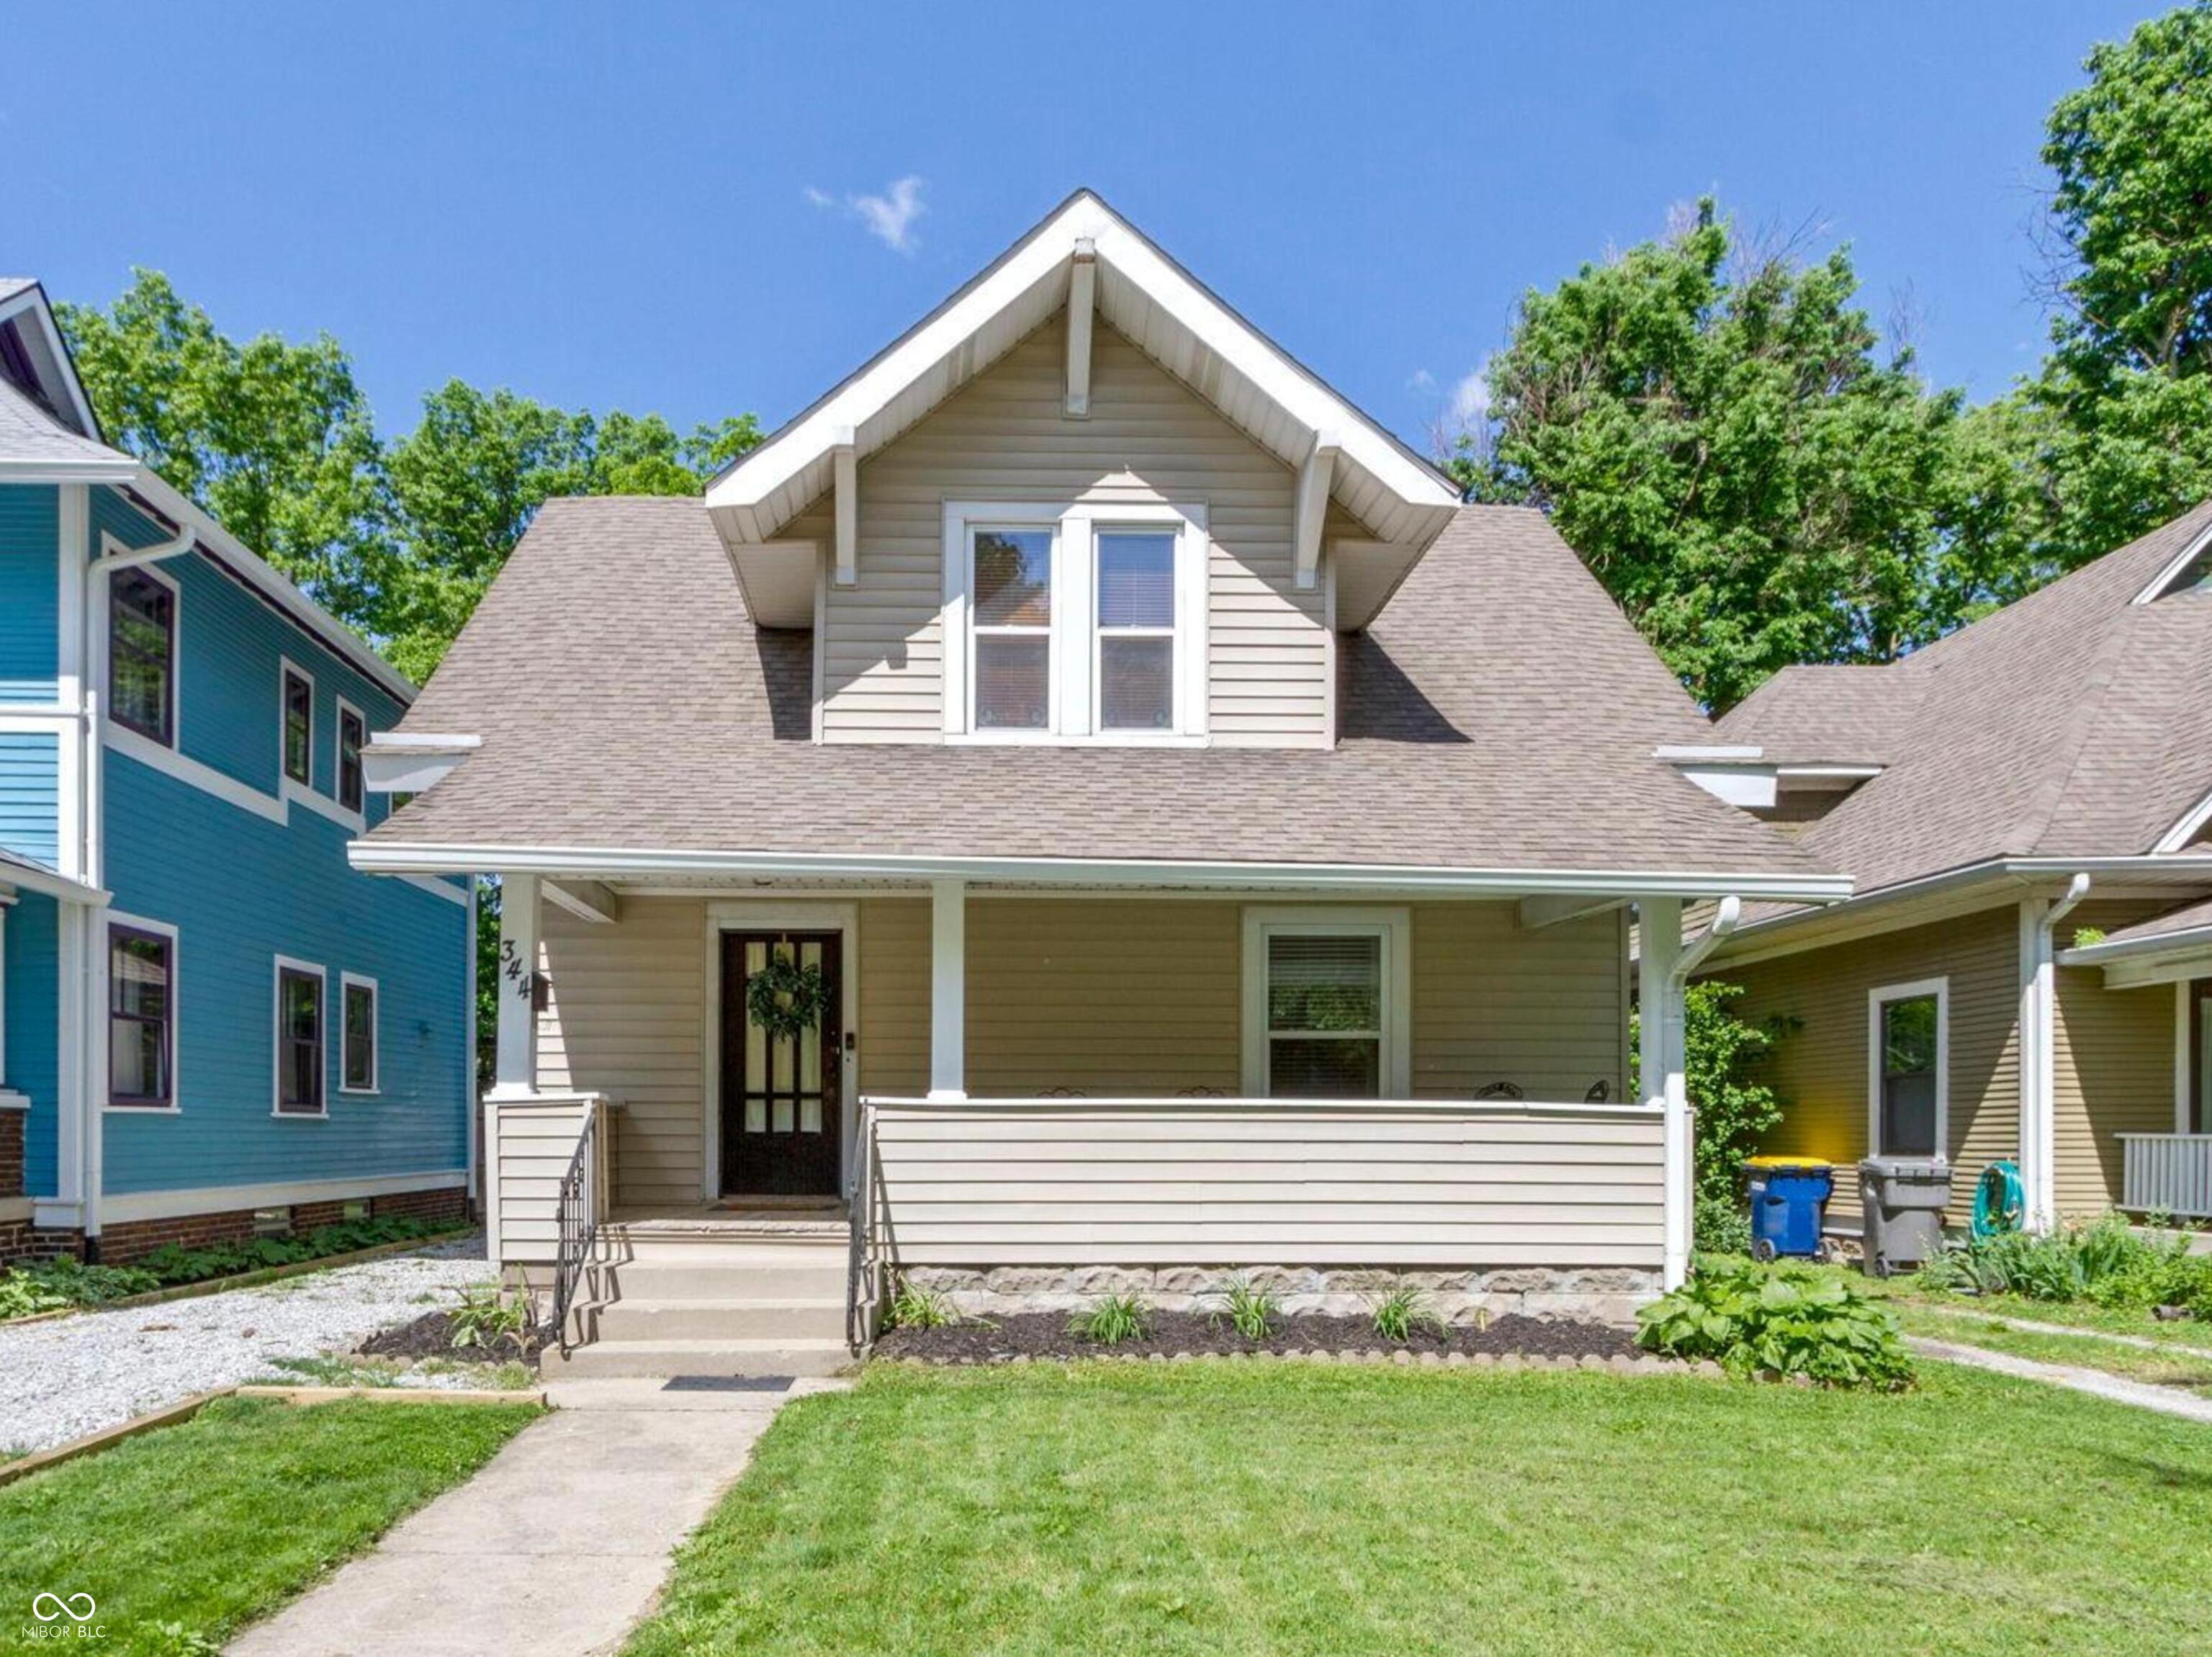
Active
$312,000
3
bds
|
2
ba
|
1,668
sqft
|
built
1910
344 N Whittier Pl, Indianapolis, IN 46219
$-632
Cash flow
-10.6%
Cash-on-Cash Return
3.7%
Cap rate
0.4%
Rent to Value Ratio
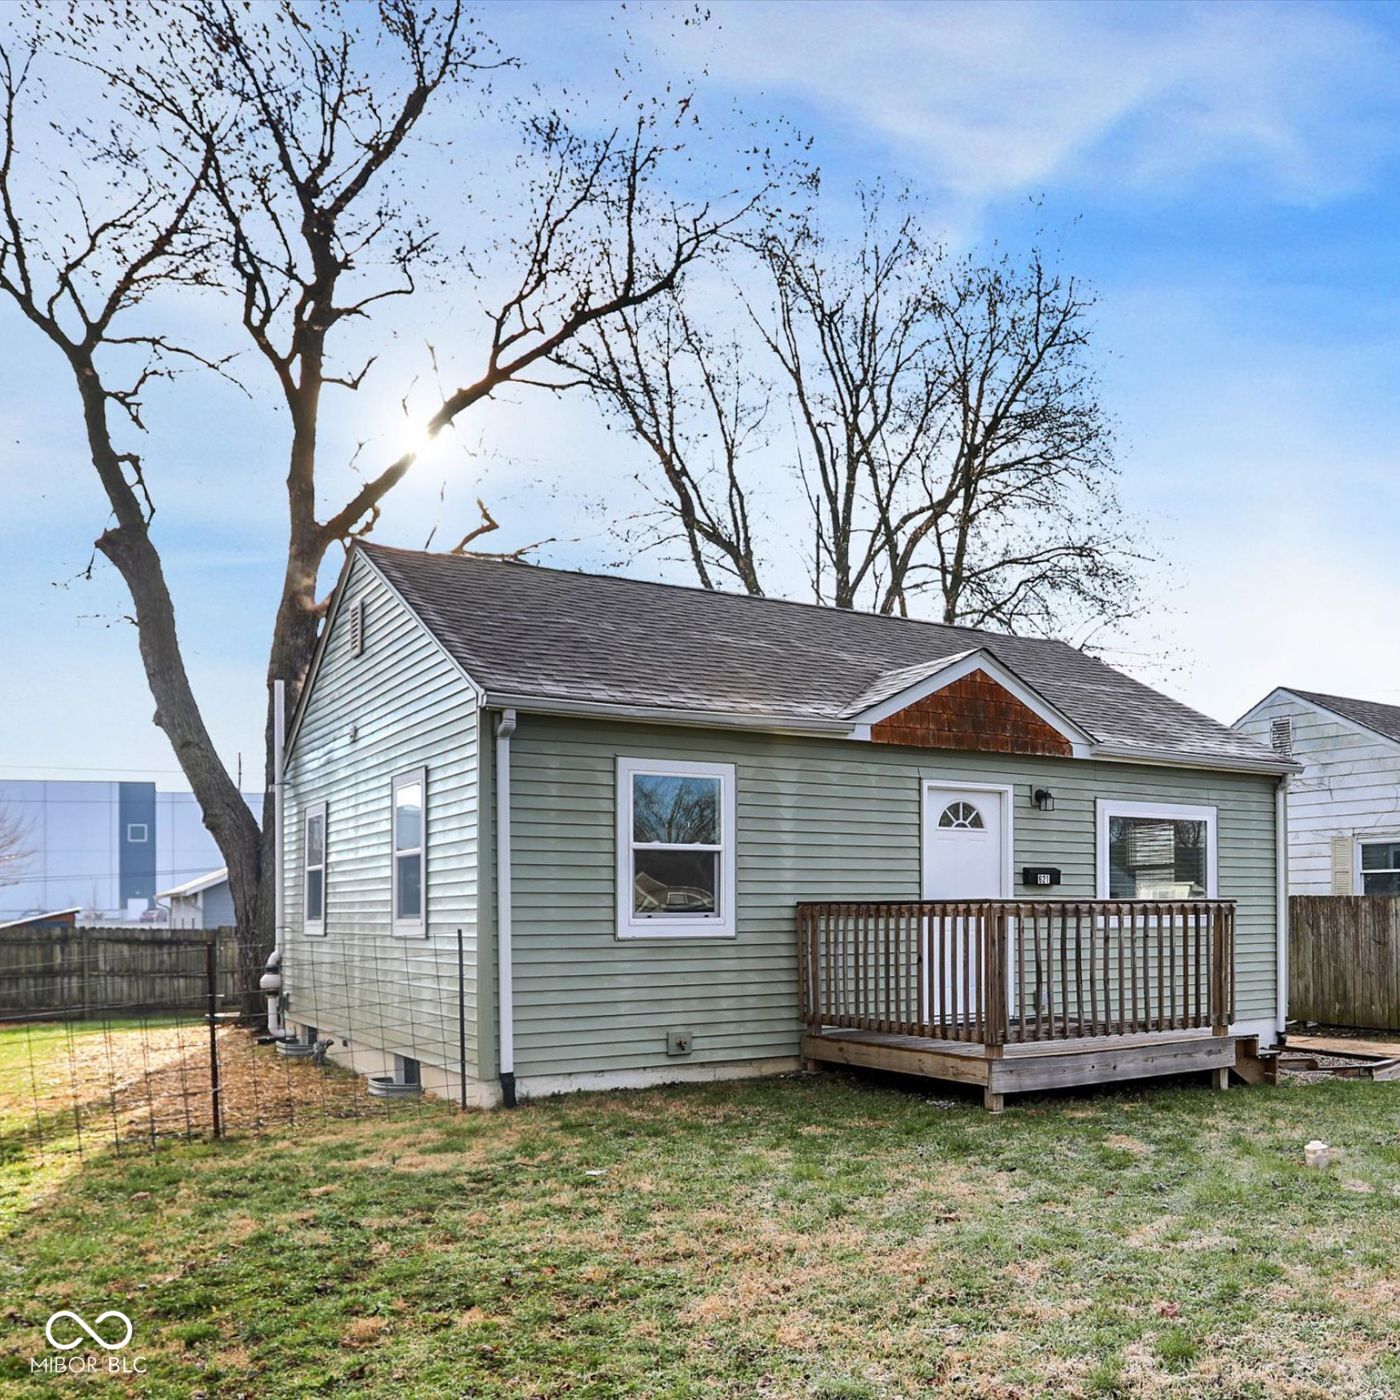
Pending
$189,000
2
bds
|
2
ba
|
1,350
sqft
|
built
1950
621 Melvenia St, Indianapolis, IN 46219
$136
Cash flow
3.8%
Cash-on-Cash Return
7.0%
Cap rate
0.8%
Rent to Value Ratio
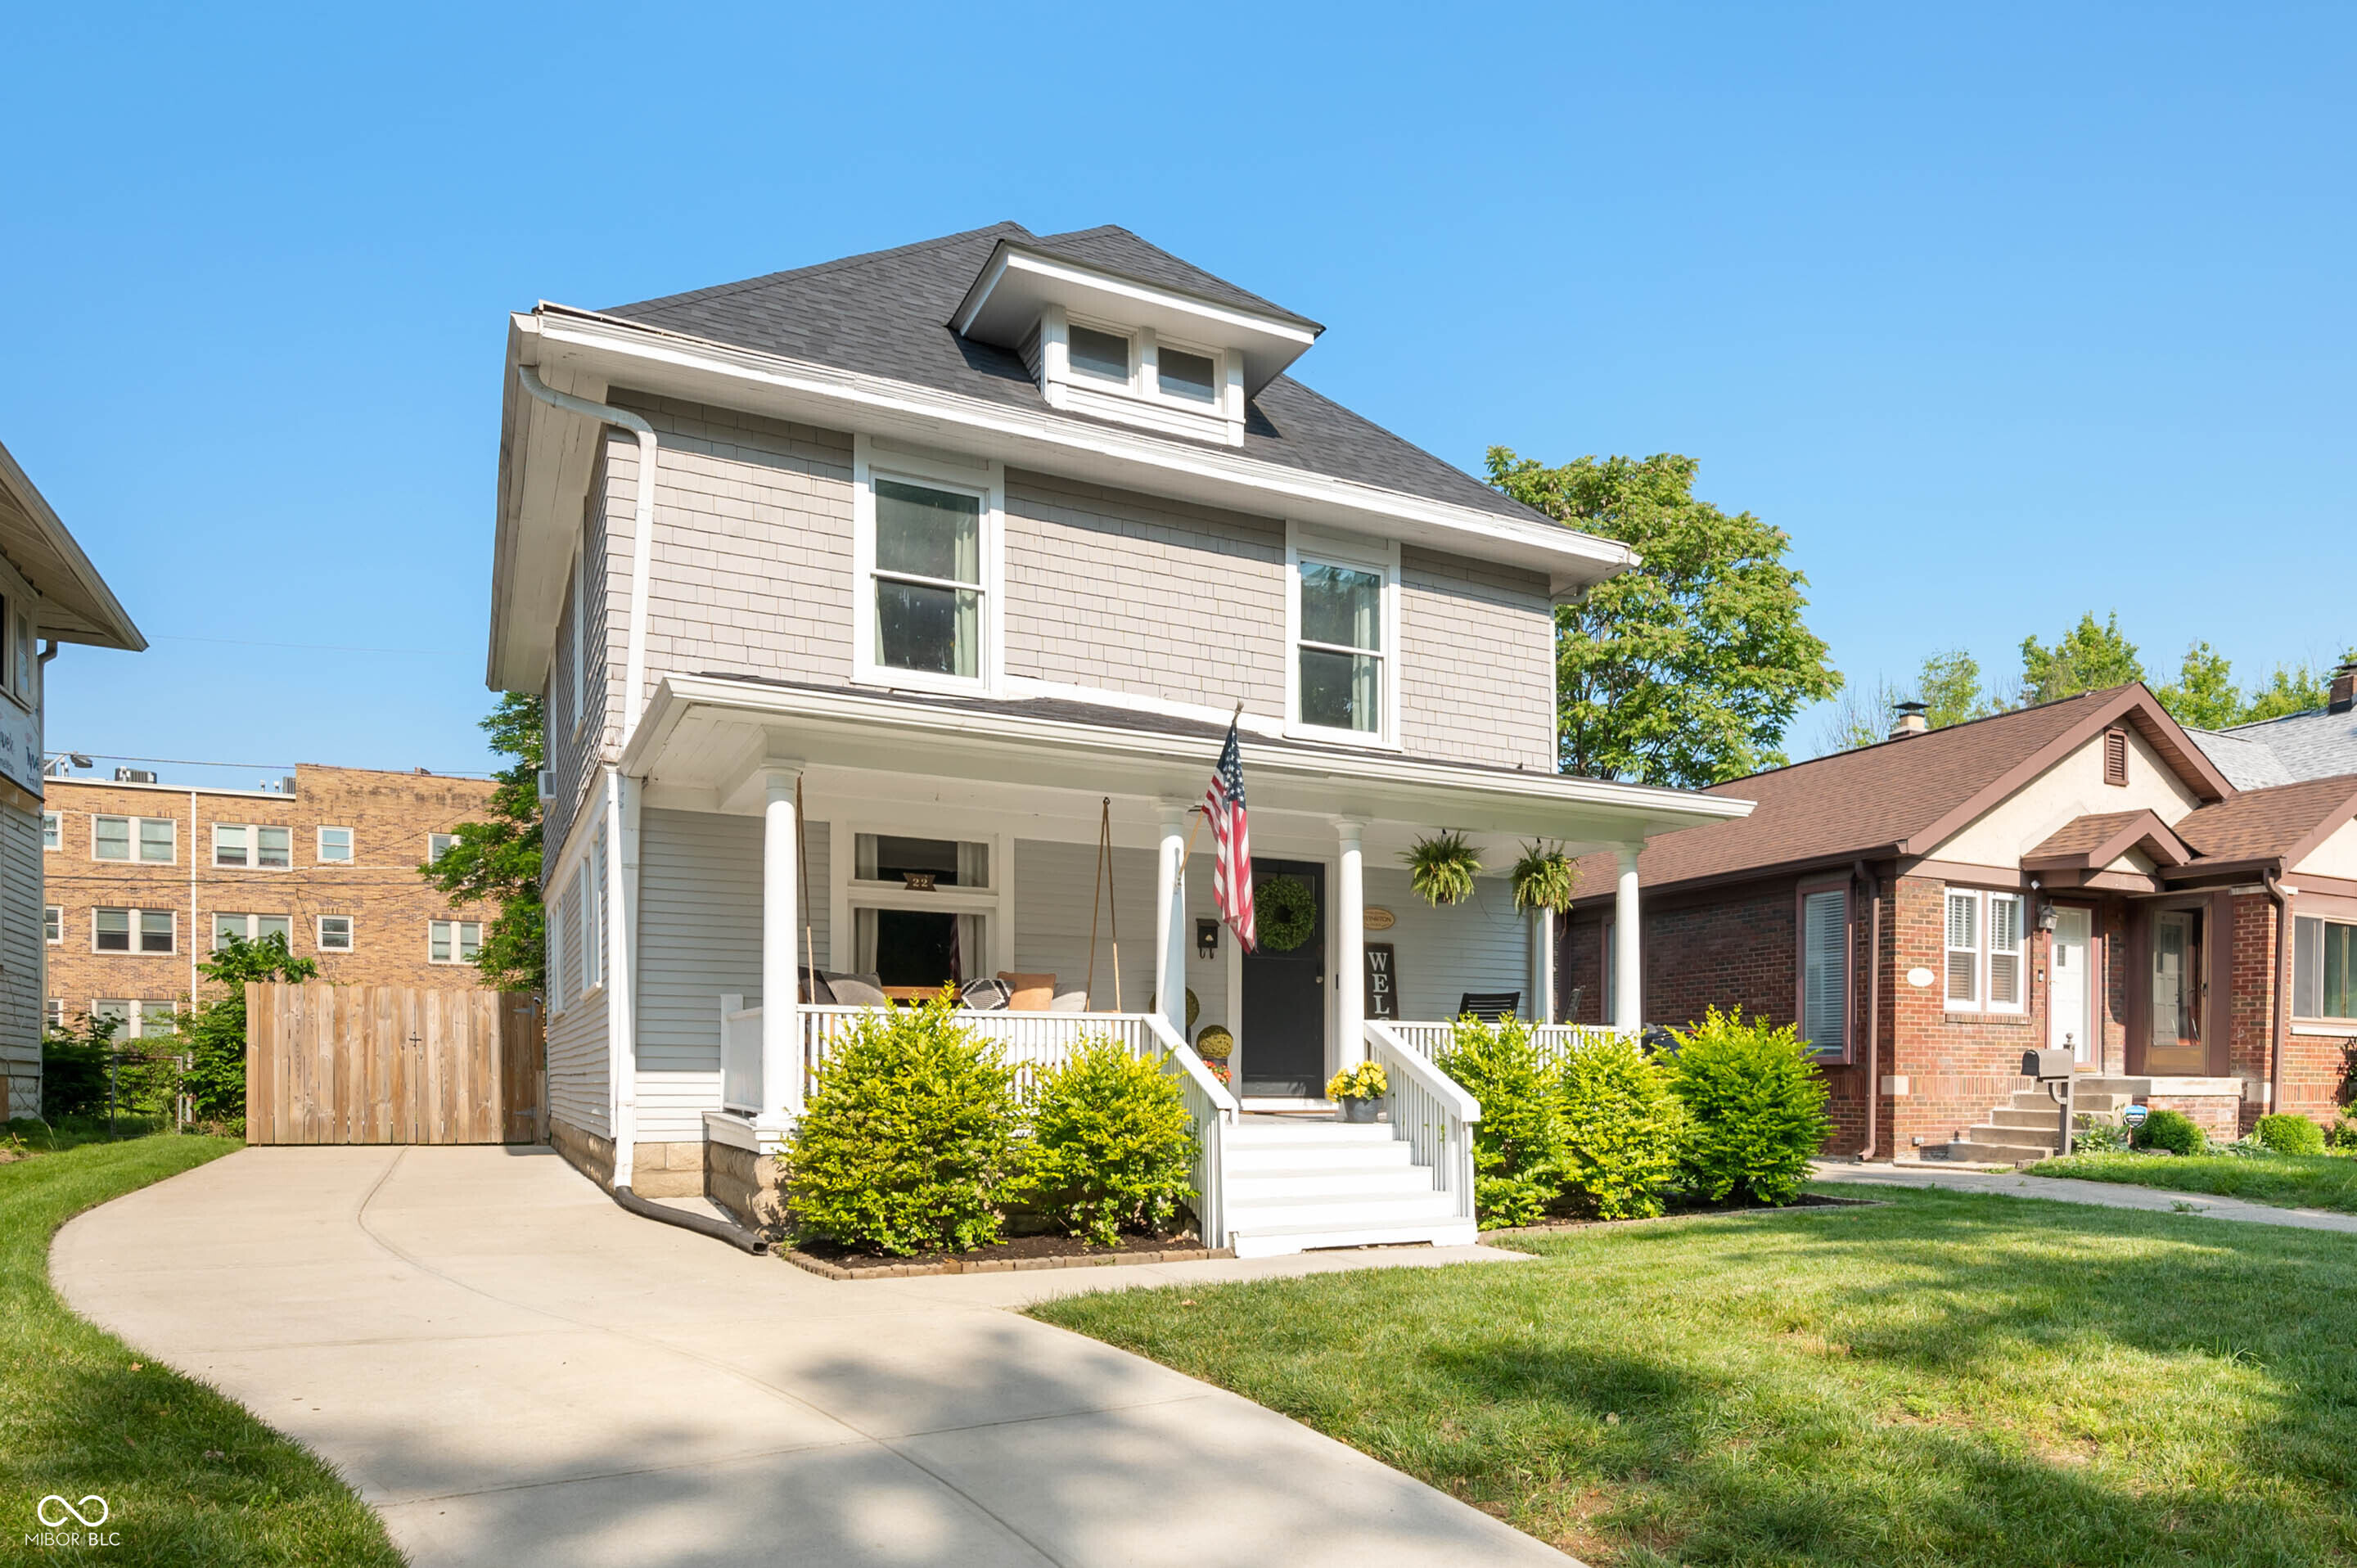
Active
$375,000
4
bds
|
3
ba
|
2,712
sqft
|
built
1898
22 N Bolton Ave, Indianapolis, IN 46219
$11
Cash flow
0.2%
Cash-on-Cash Return
6.2%
Cap rate
0.7%
Rent to Value Ratio
Active
$200,000
4
bds
|
2
ba
|
1,271
sqft
|
built
1943
1141 N Shadeland Ave, Indianapolis, IN 46219
$-265
Cash flow
-6.9%
Cash-on-Cash Return
4.6%
Cap rate
0.5%
Rent to Value Ratio
Pending
$525,000
5
bds
|
4
ba
|
4,283
sqft
|
built
1934
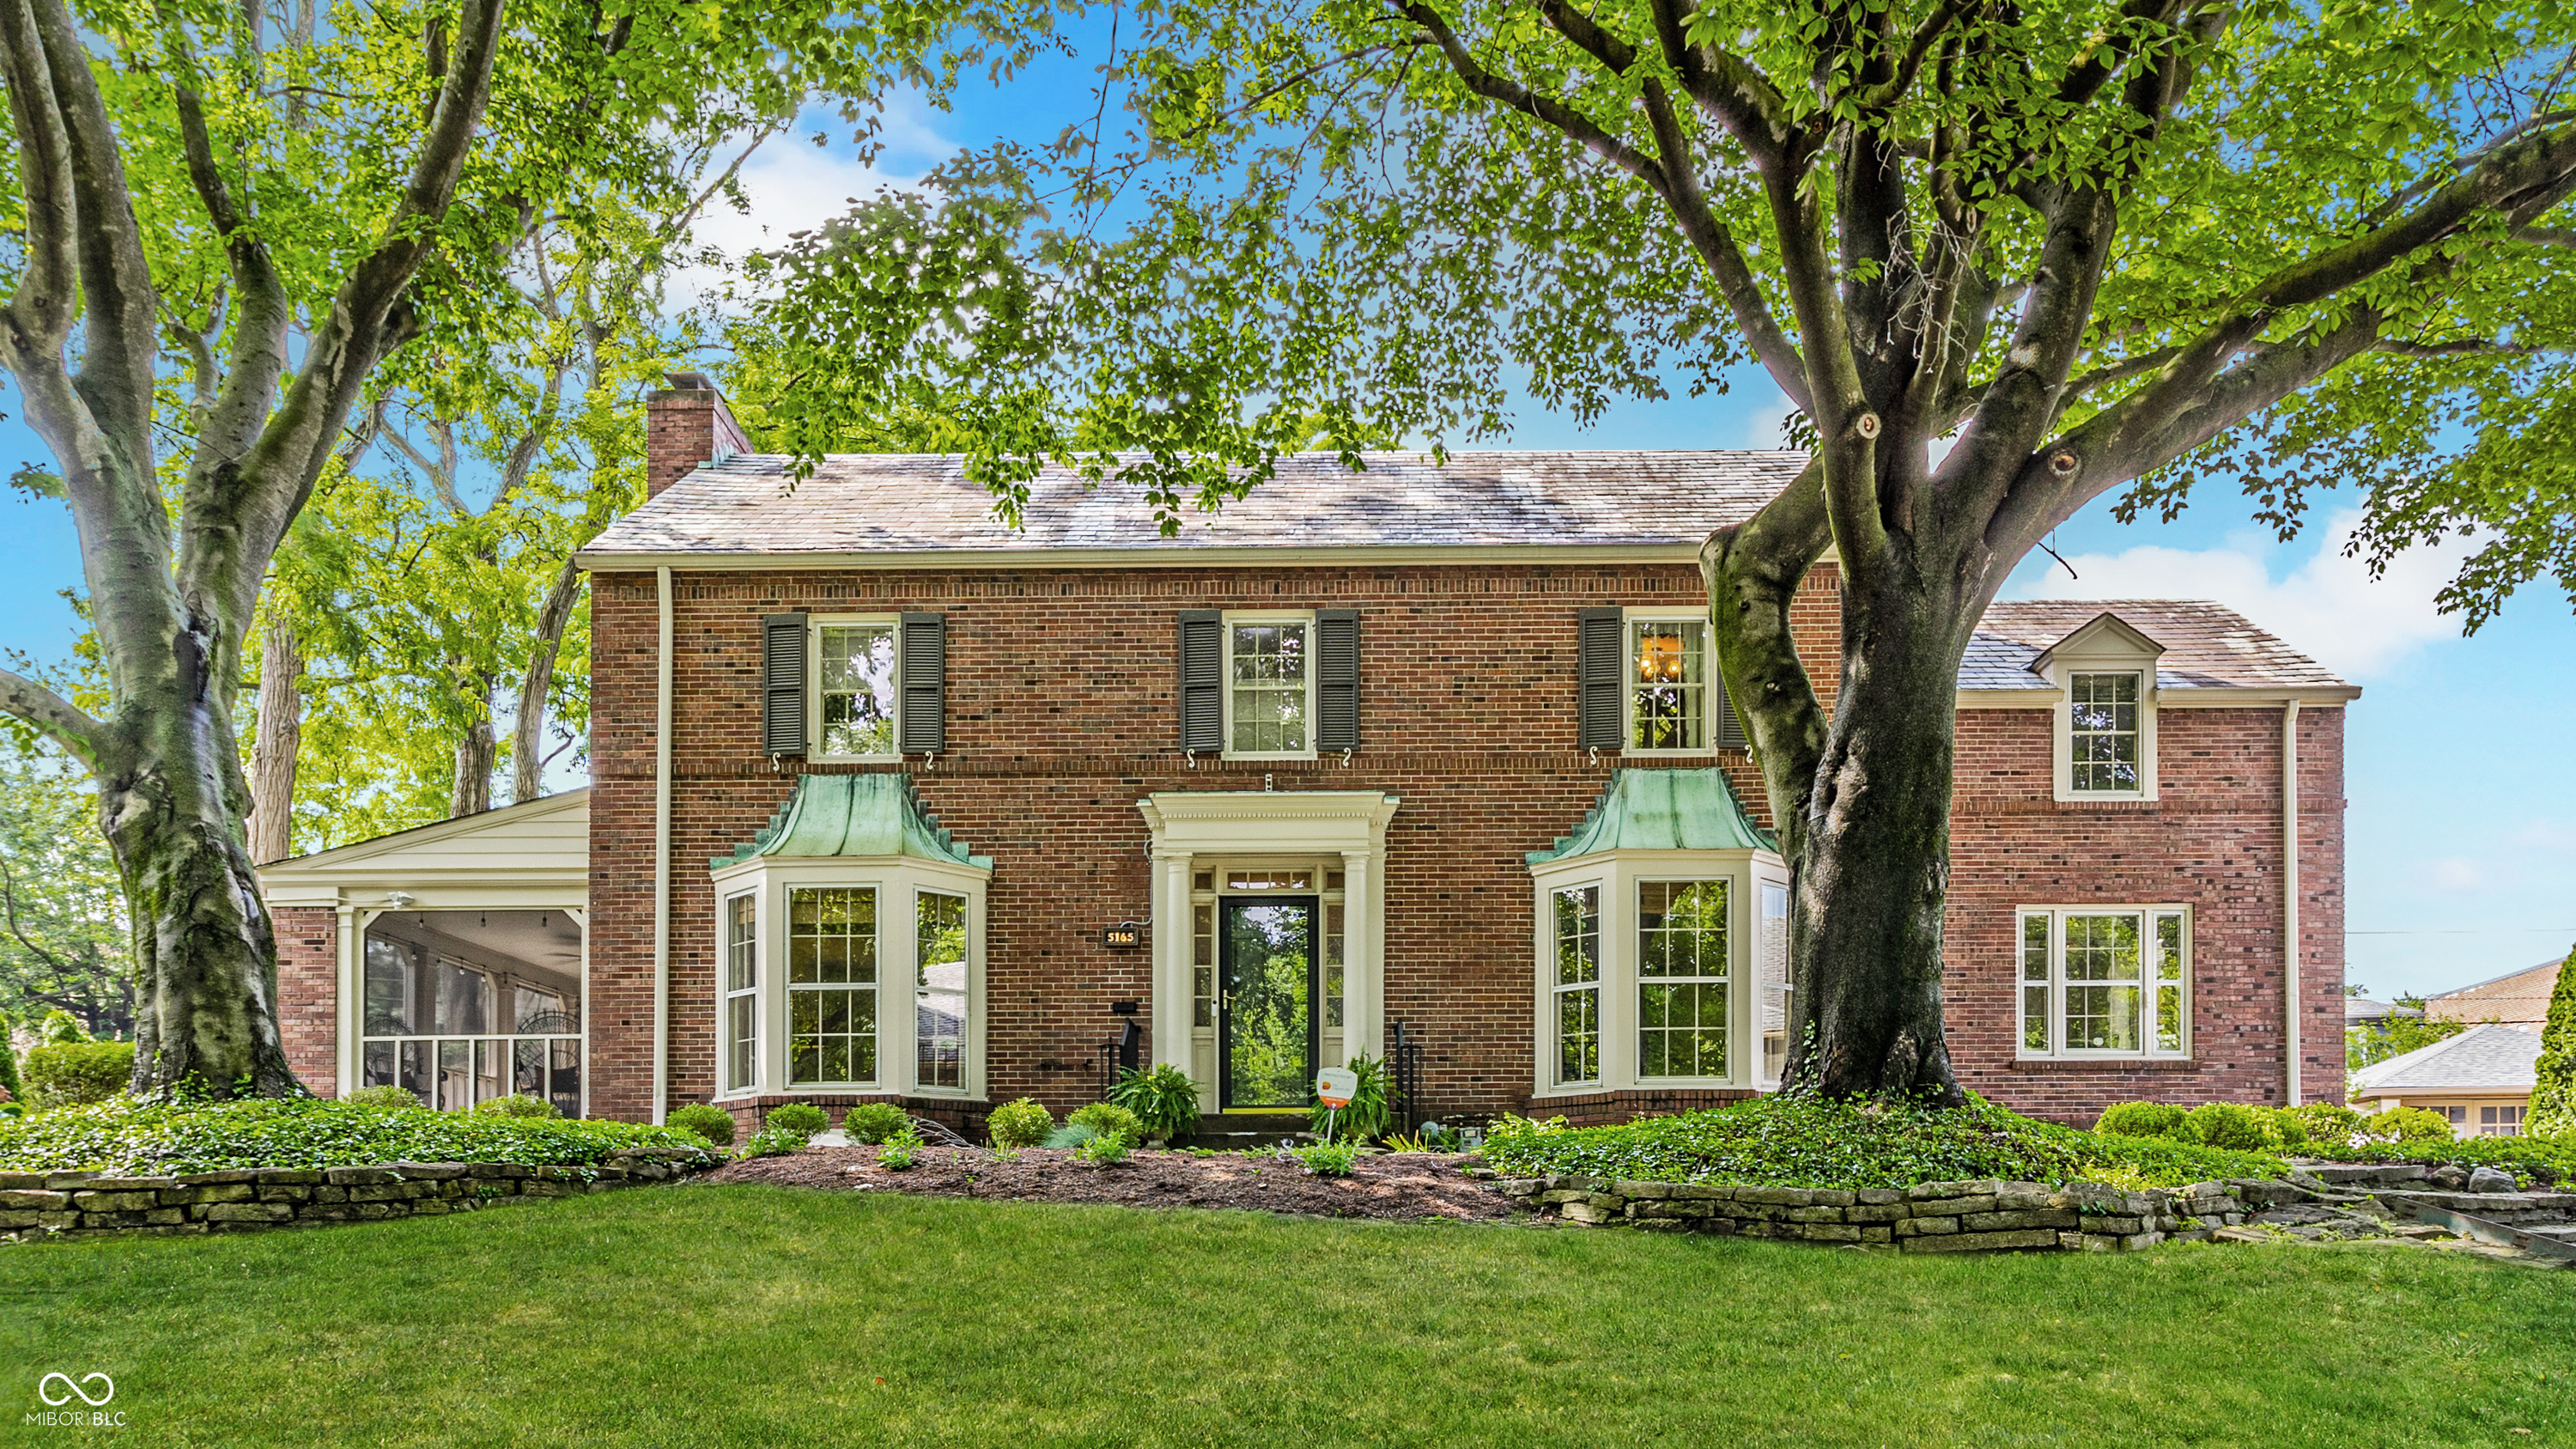
5165 E Pleasant Run Parkway South Dr, Indianapolis, IN 46219
$-481
Cash flow
-4.8%
Cash-on-Cash Return
5.0%
Cap rate
0.6%
Rent to Value Ratio

Active
$399,000
3
bds
|
3
ba
|
2,087
sqft
|
built
1925
5814 Beechwood Ave, Indianapolis, IN 46219
$-664
Cash flow
-8.7%
Cash-on-Cash Return
4.2%
Cap rate
0.5%
Rent to Value Ratio
Active
$395,000
3
bds
|
3
ba
|
2,128
sqft
|
built
1925
5718 E Pleasant Run Parkway North Dr, Indianapolis, IN 46219
$-505
Cash flow
-6.7%
Cash-on-Cash Return
4.6%
Cap rate
0.6%
Rent to Value Ratio
Active
$229,900
3
bds
|
1
ba
|
1,680
sqft
|
built
1932
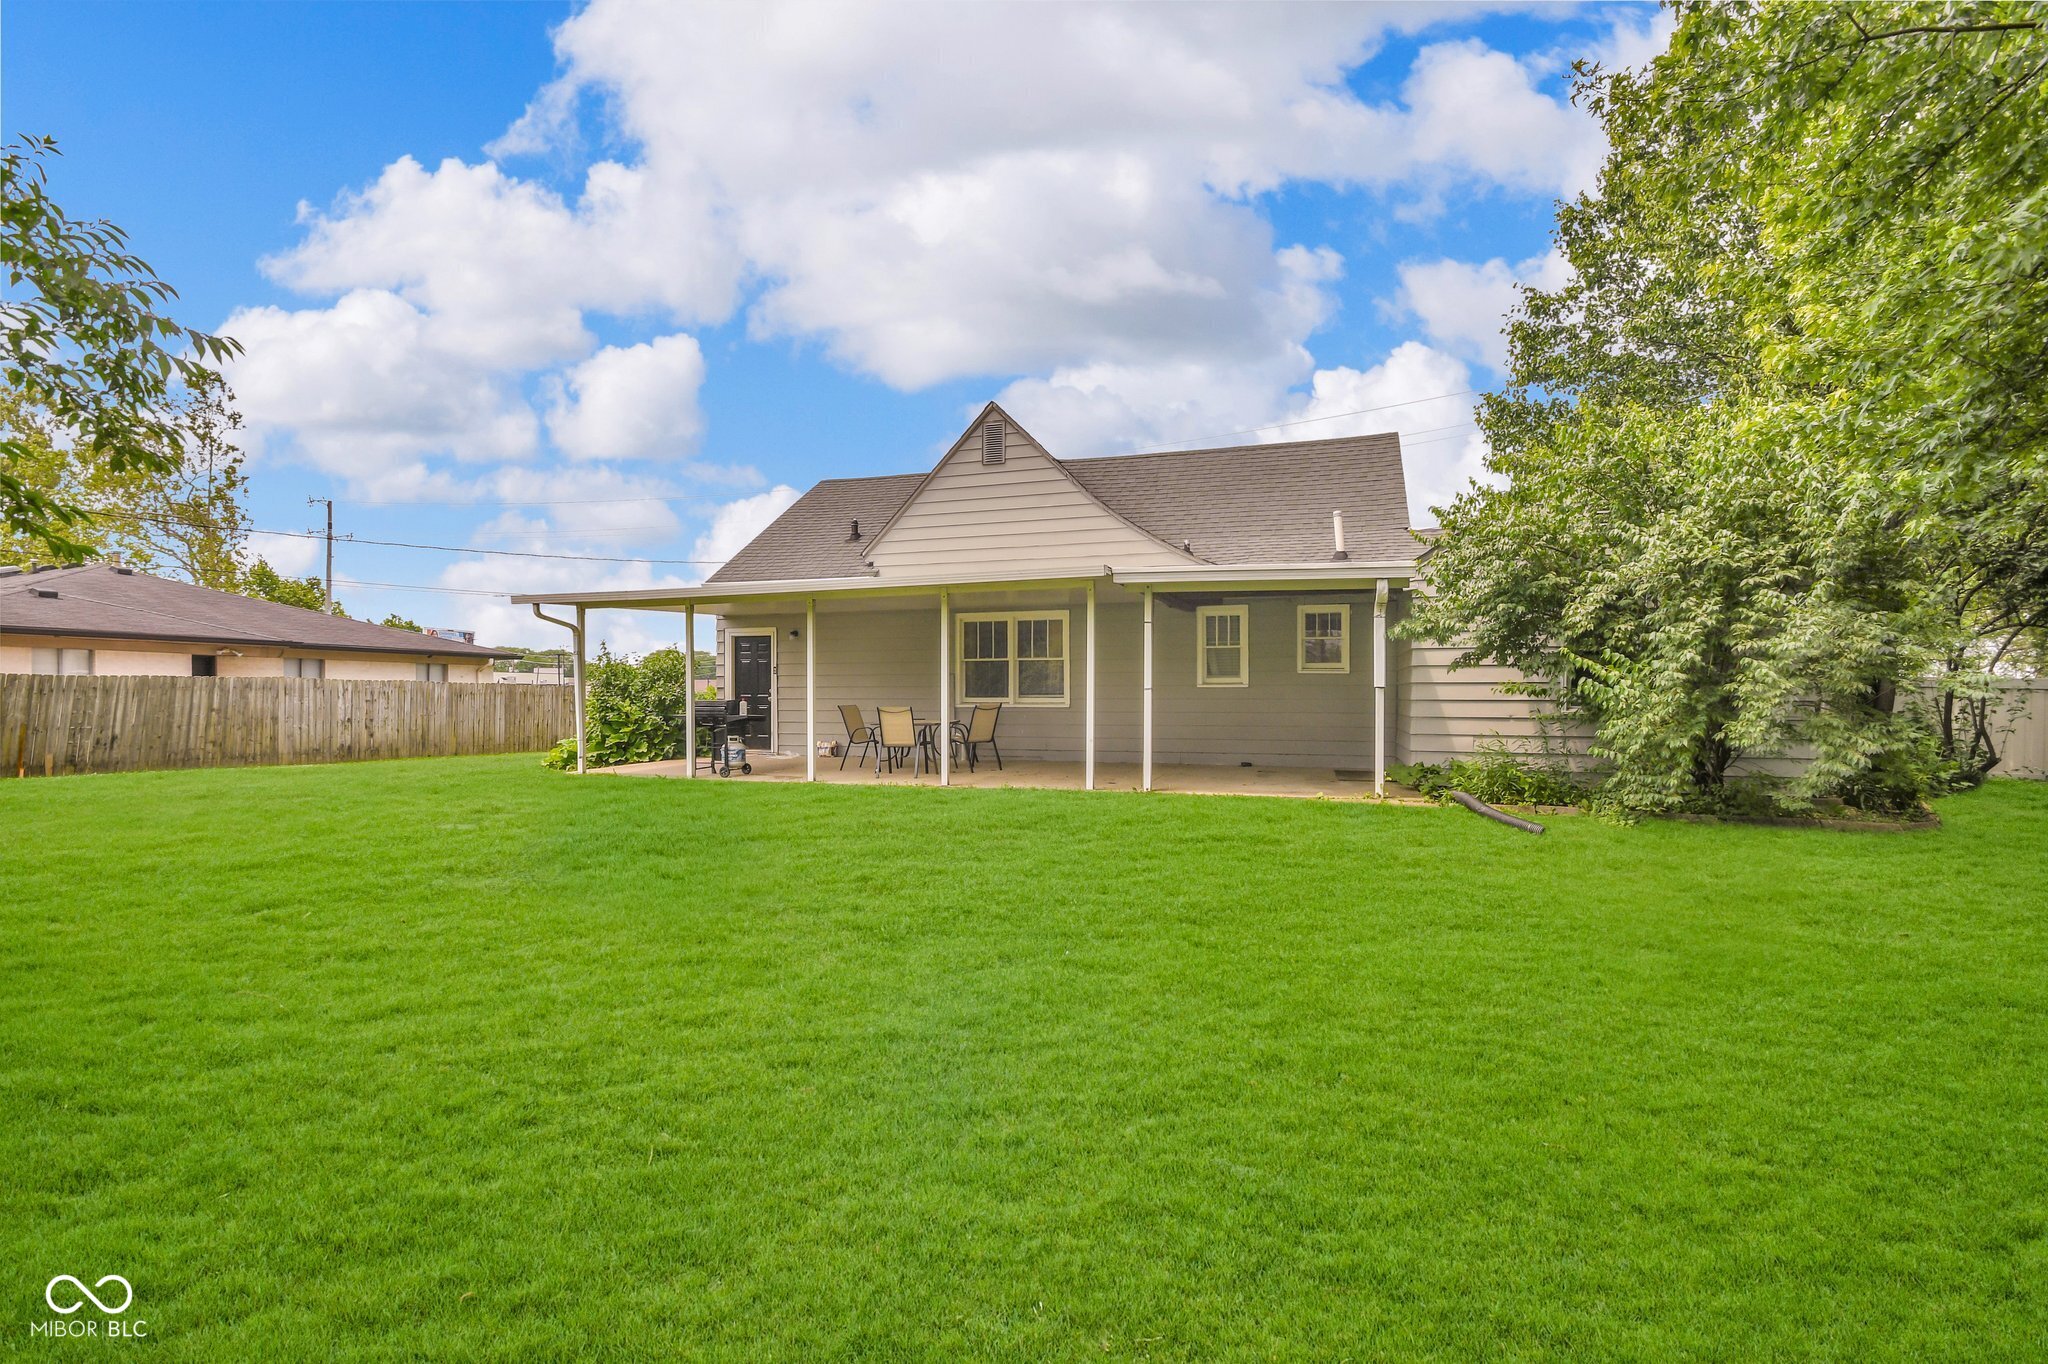
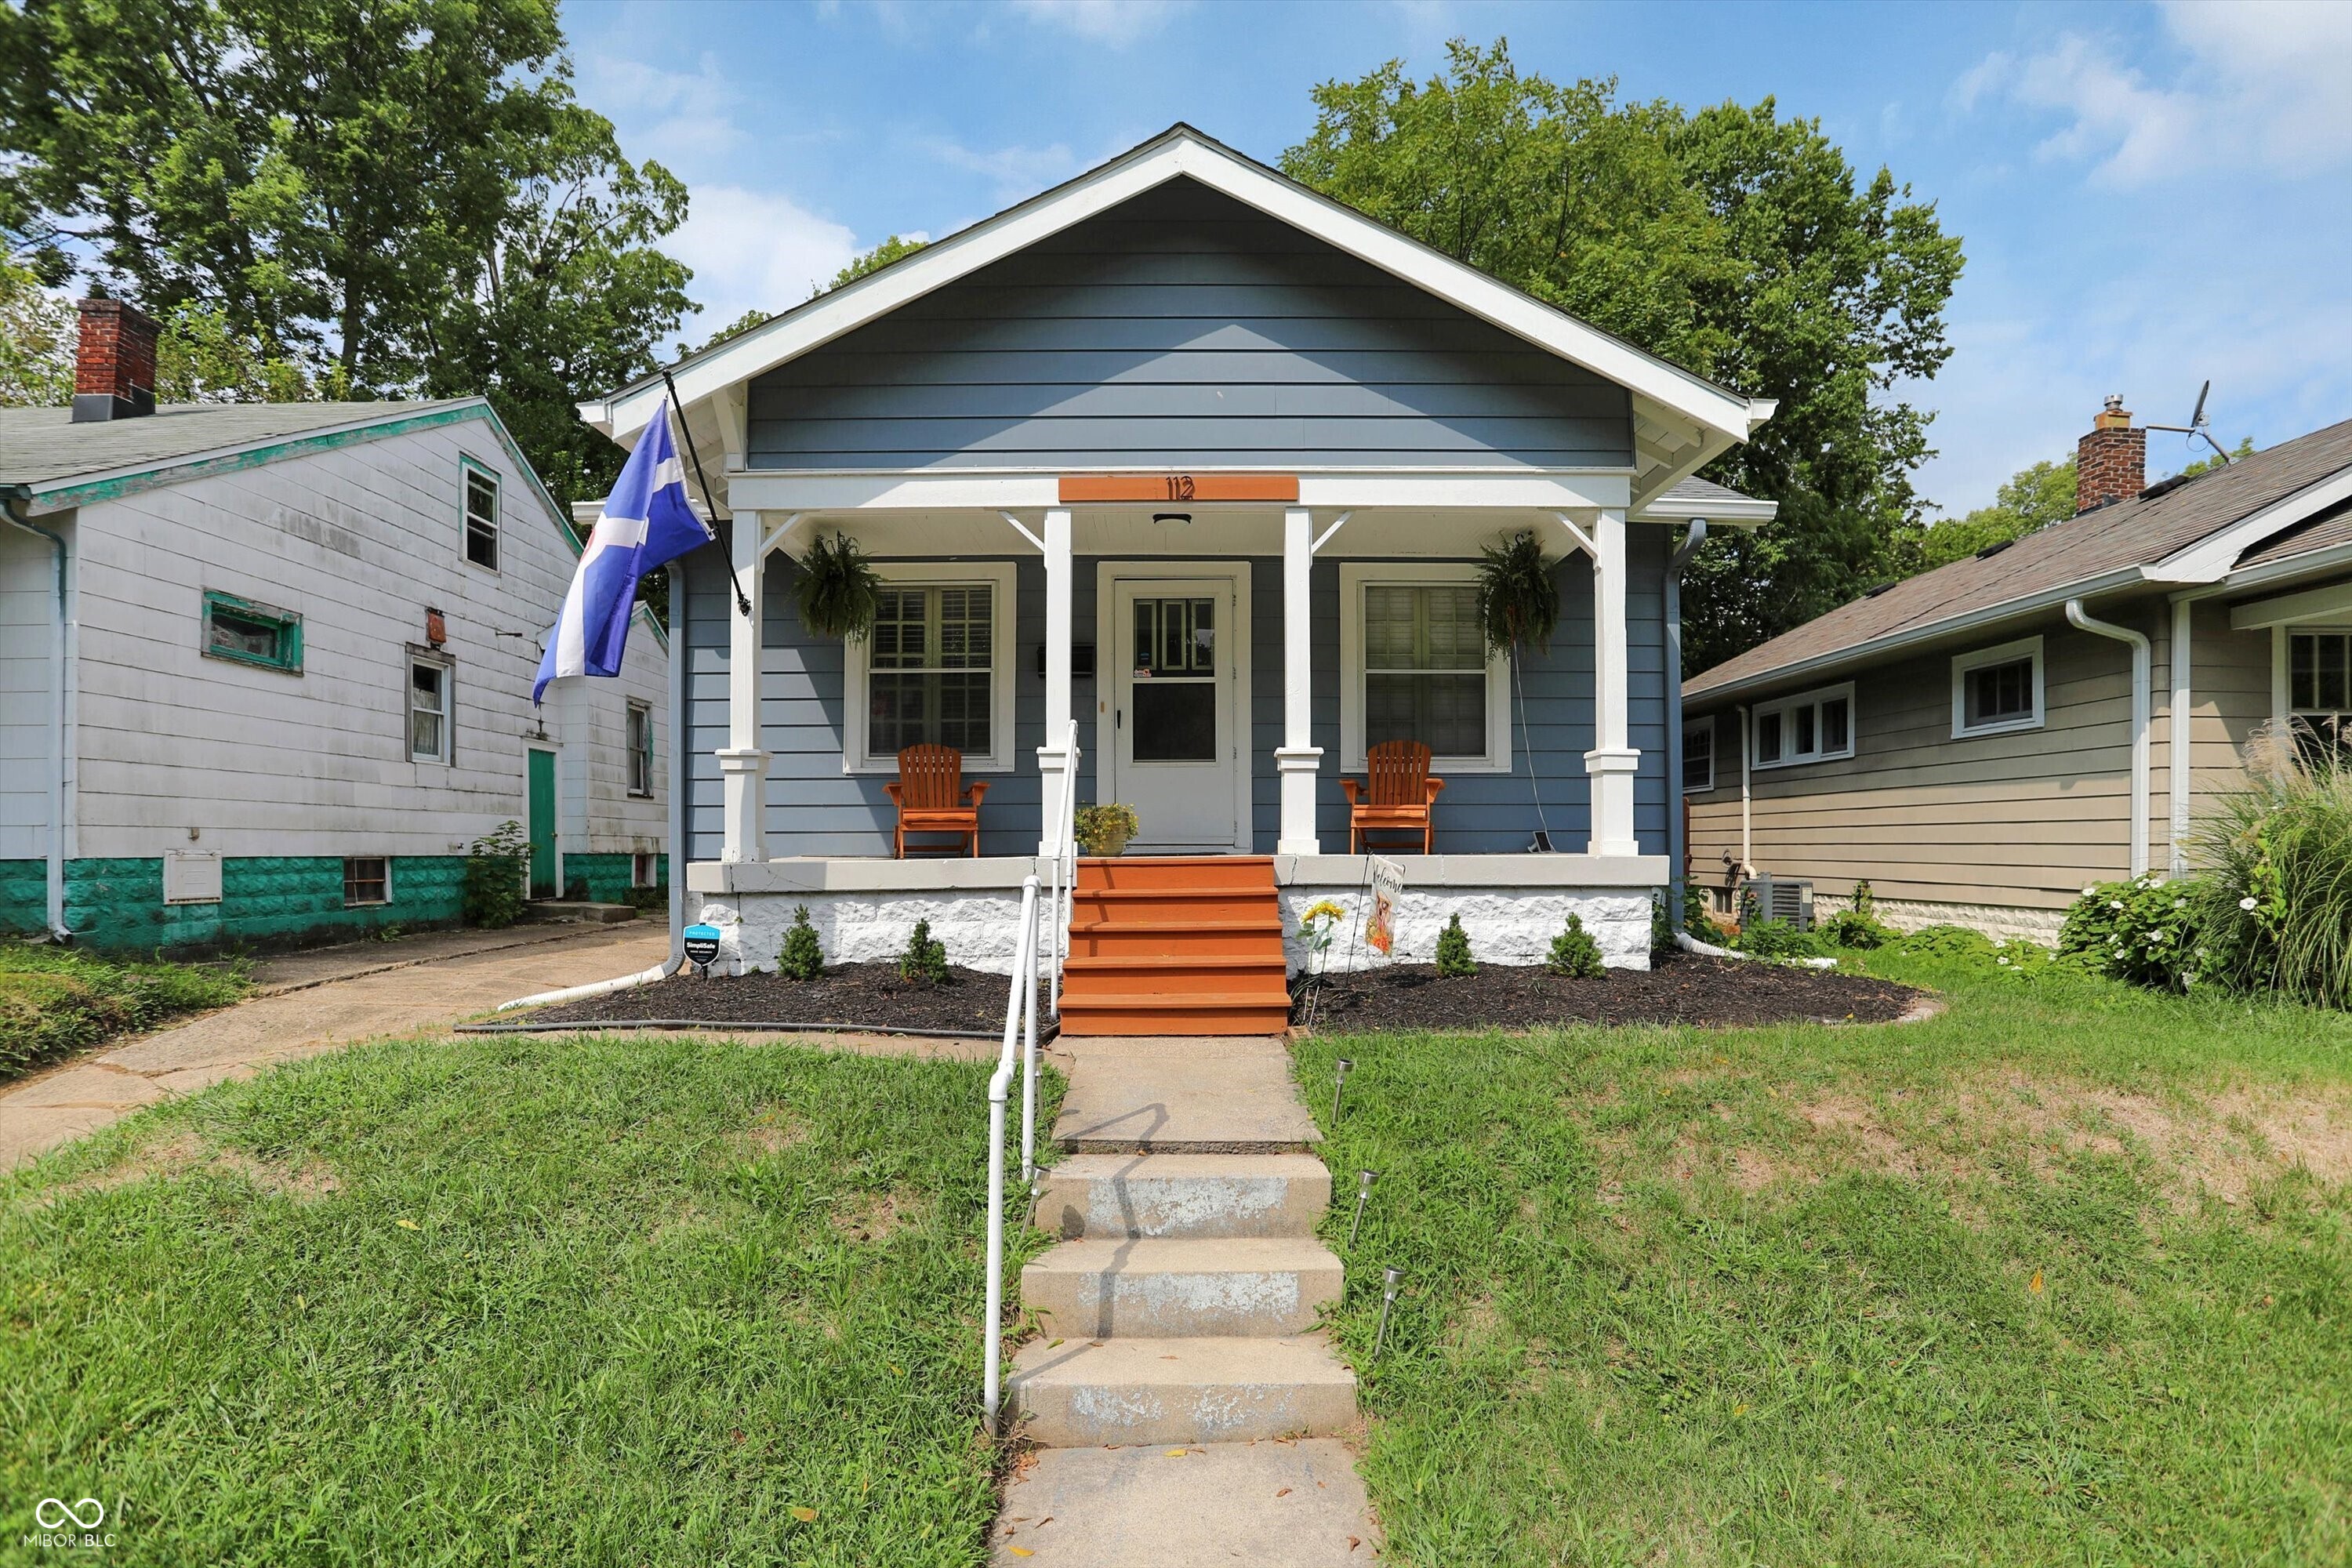
112 S Spencer Ave, Indianapolis, IN 46219
$-212
Cash flow
-4.8%
Cash-on-Cash Return
5.0%
Cap rate
0.6%
Rent to Value Ratio
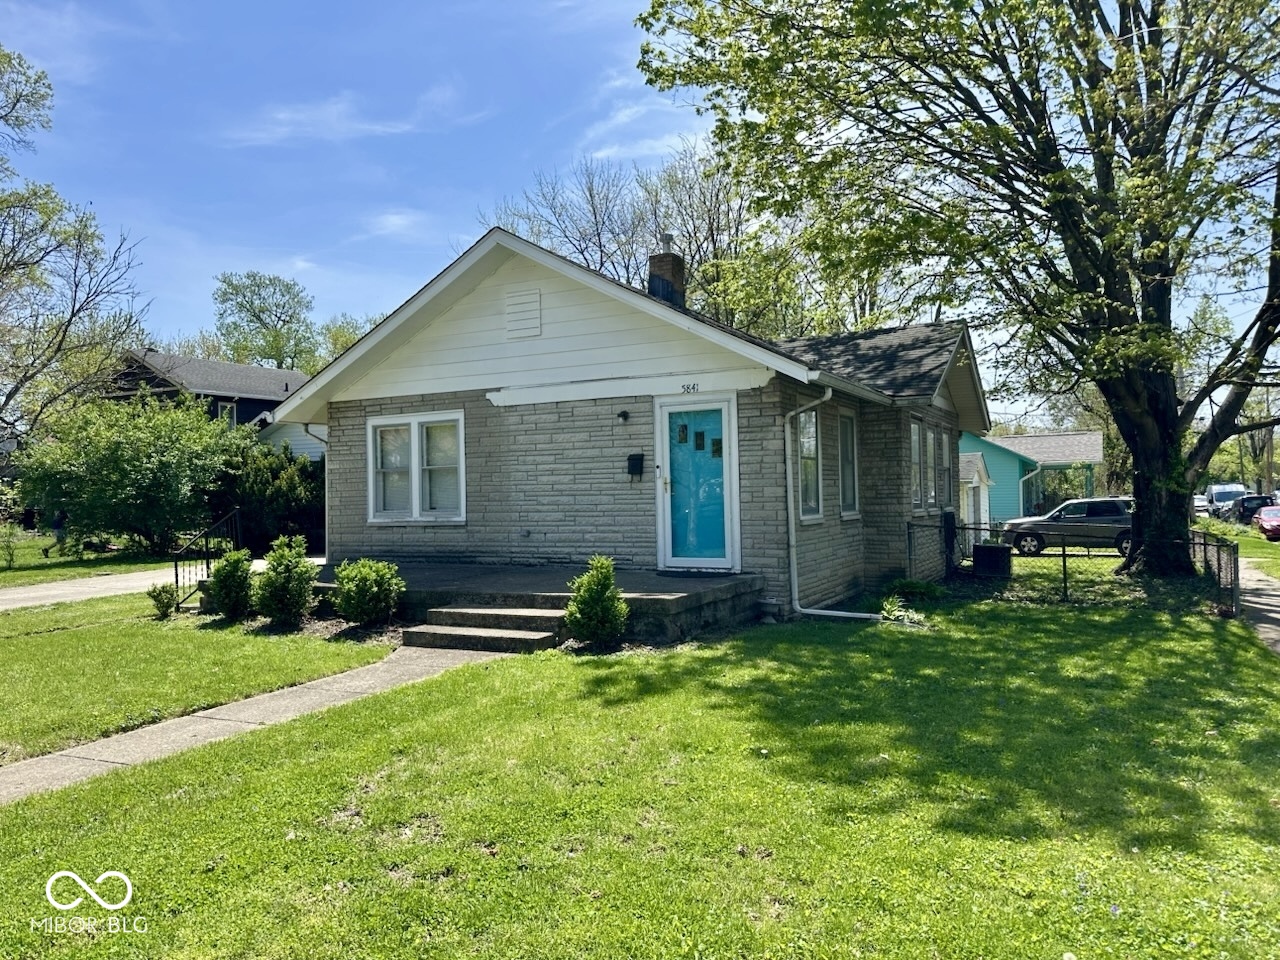
Active
$198,999
2
bds
|
1
ba
|
994
sqft
|
built
1925
5841 Julian Ave, Indianapolis, IN 46219
$-53
Cash flow
-1.4%
Cash-on-Cash Return
5.8%
Cap rate
0.7%
Rent to Value Ratio
Active
$159,499
3
bds
|
1
ba
|
1,025
sqft
|
built
1900
35 S Catherwood Ave, Indianapolis, IN 46219
$287
Cash flow
9.4%
Cash-on-Cash Return
8.3%
Cap rate
1.0%
Rent to Value Ratio
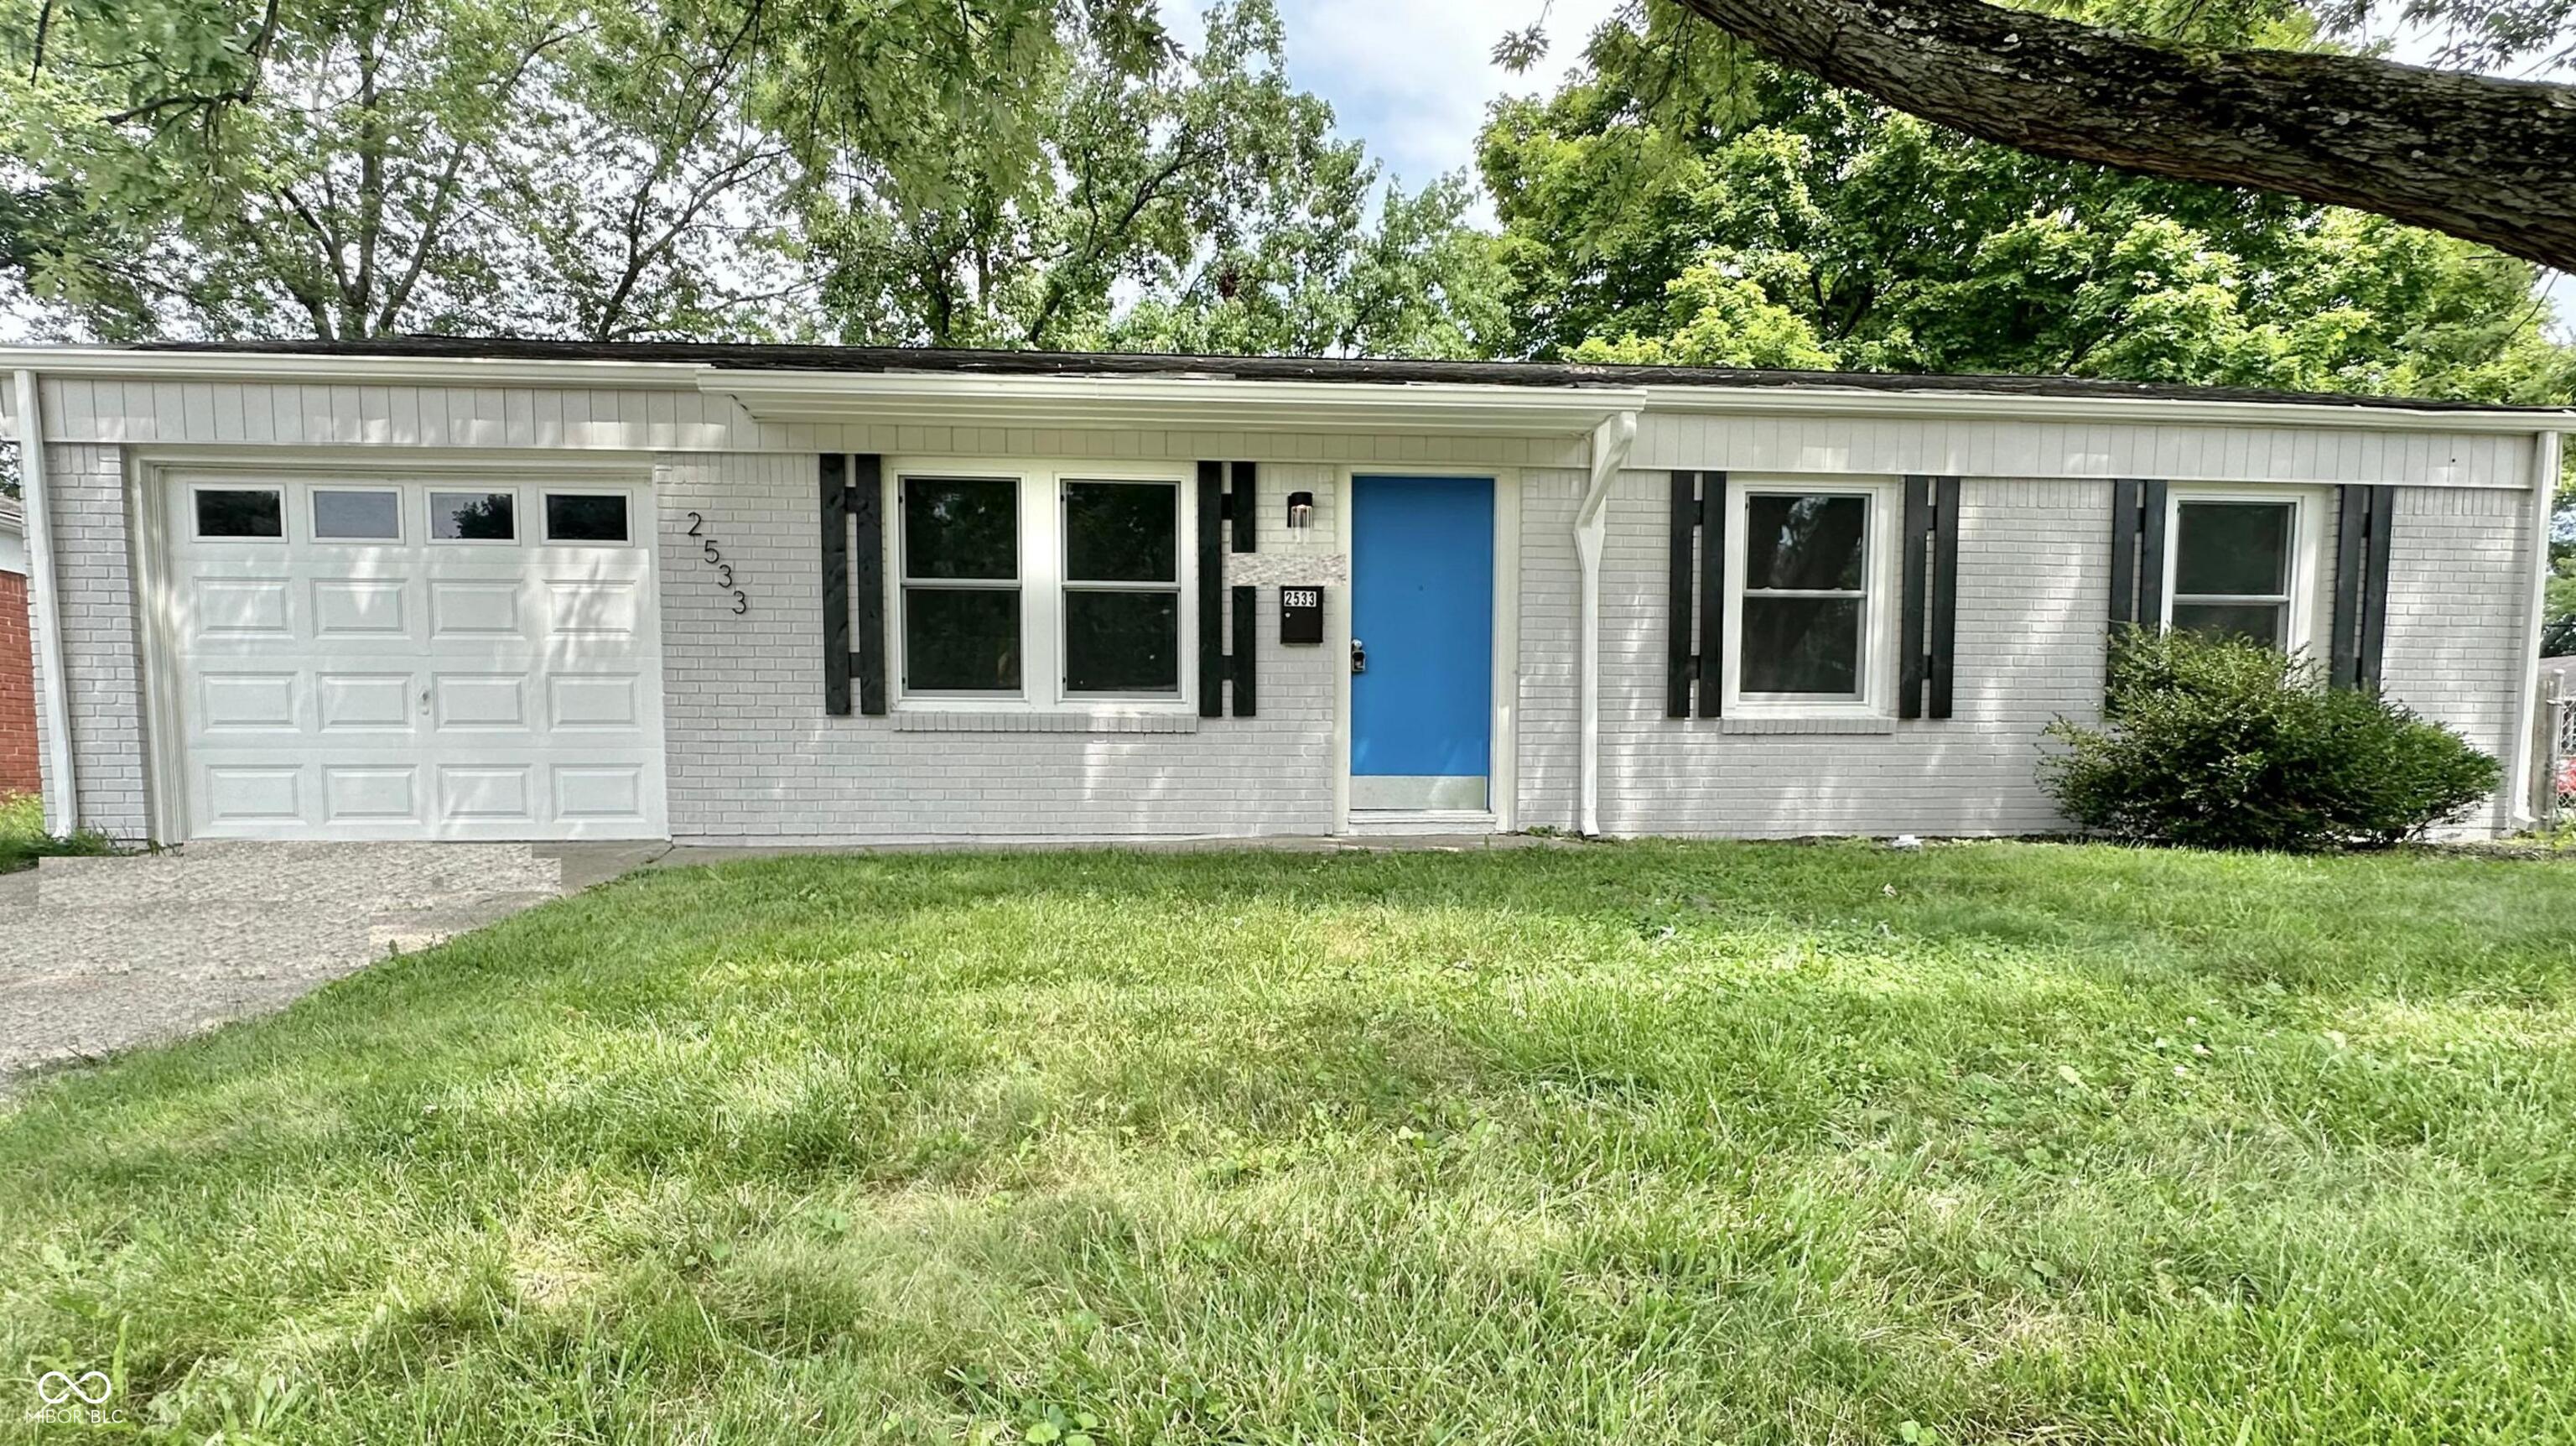
Active
$192,000
3
bds
|
1
ba
|
1,250
sqft
|
built
1959
2533 Aurie Dr, Indianapolis, IN 46219
$120
Cash flow
3.3%
Cash-on-Cash Return
6.9%
Cap rate
0.8%
Rent to Value Ratio
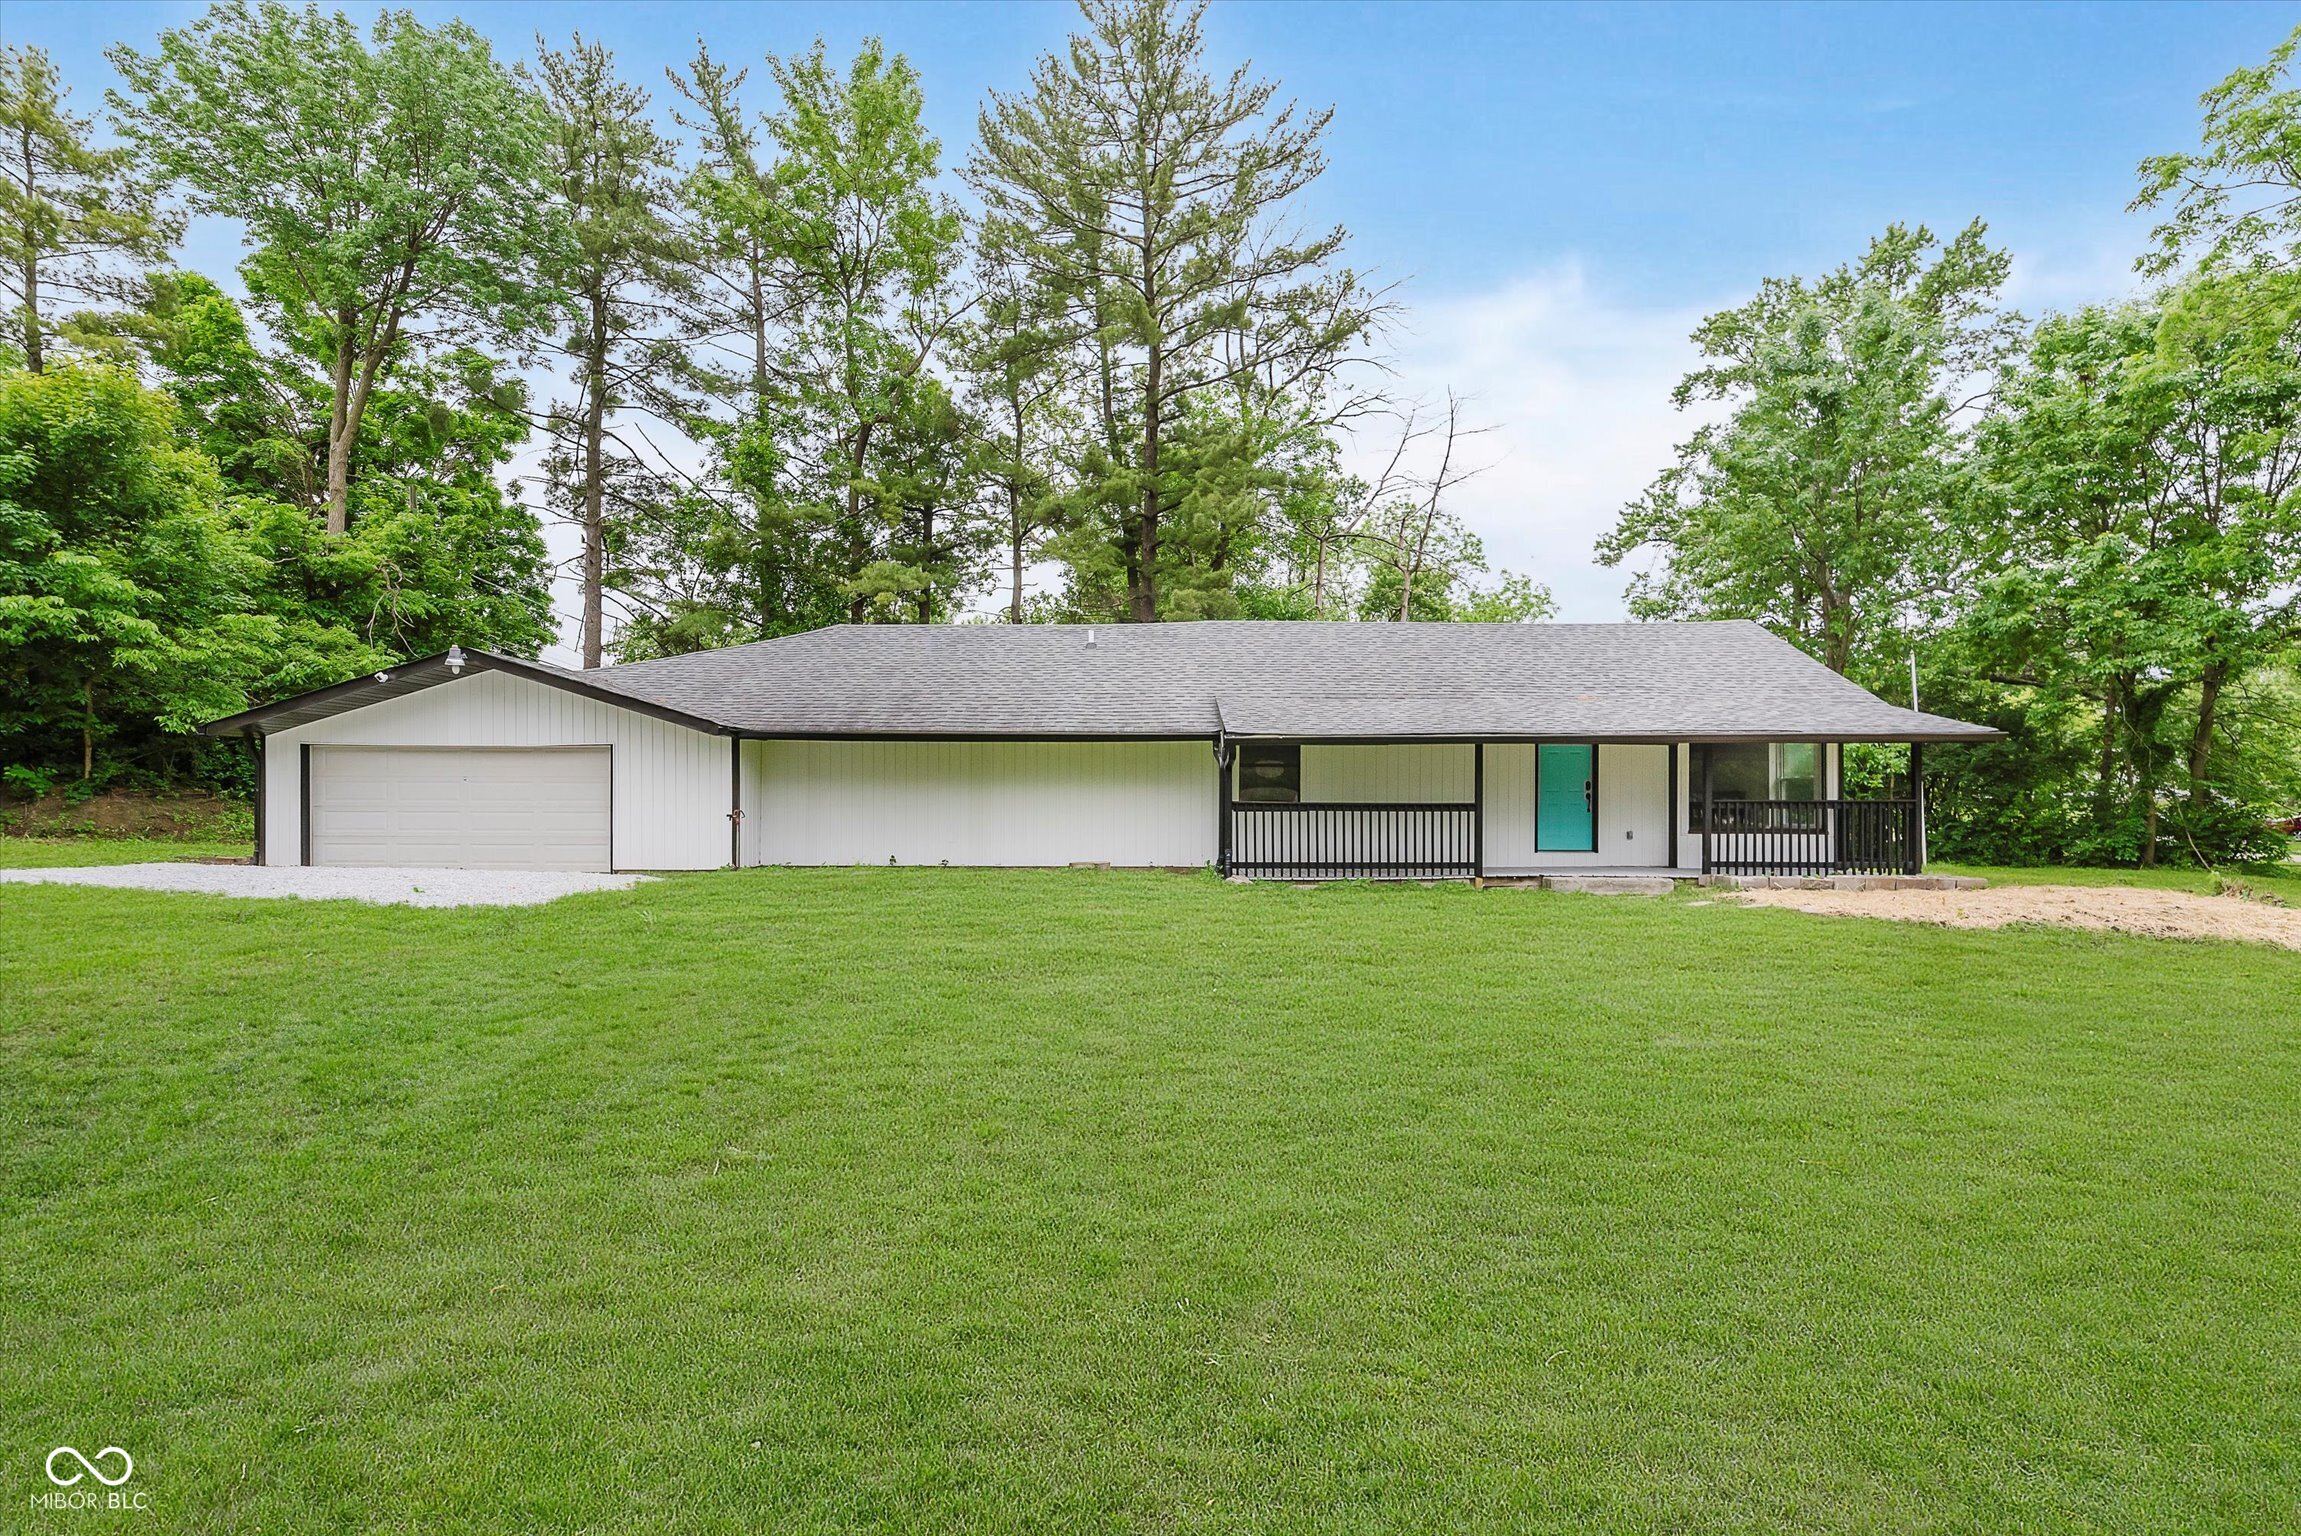
Active
$269,900
4
bds
|
3
ba
|
1,330
sqft
|
built
1947
233 N Devon Ave, Indianapolis, IN 46219
$-417
Cash flow
-8.1%
Cash-on-Cash Return
4.3%
Cap rate
0.5%
Rent to Value Ratio
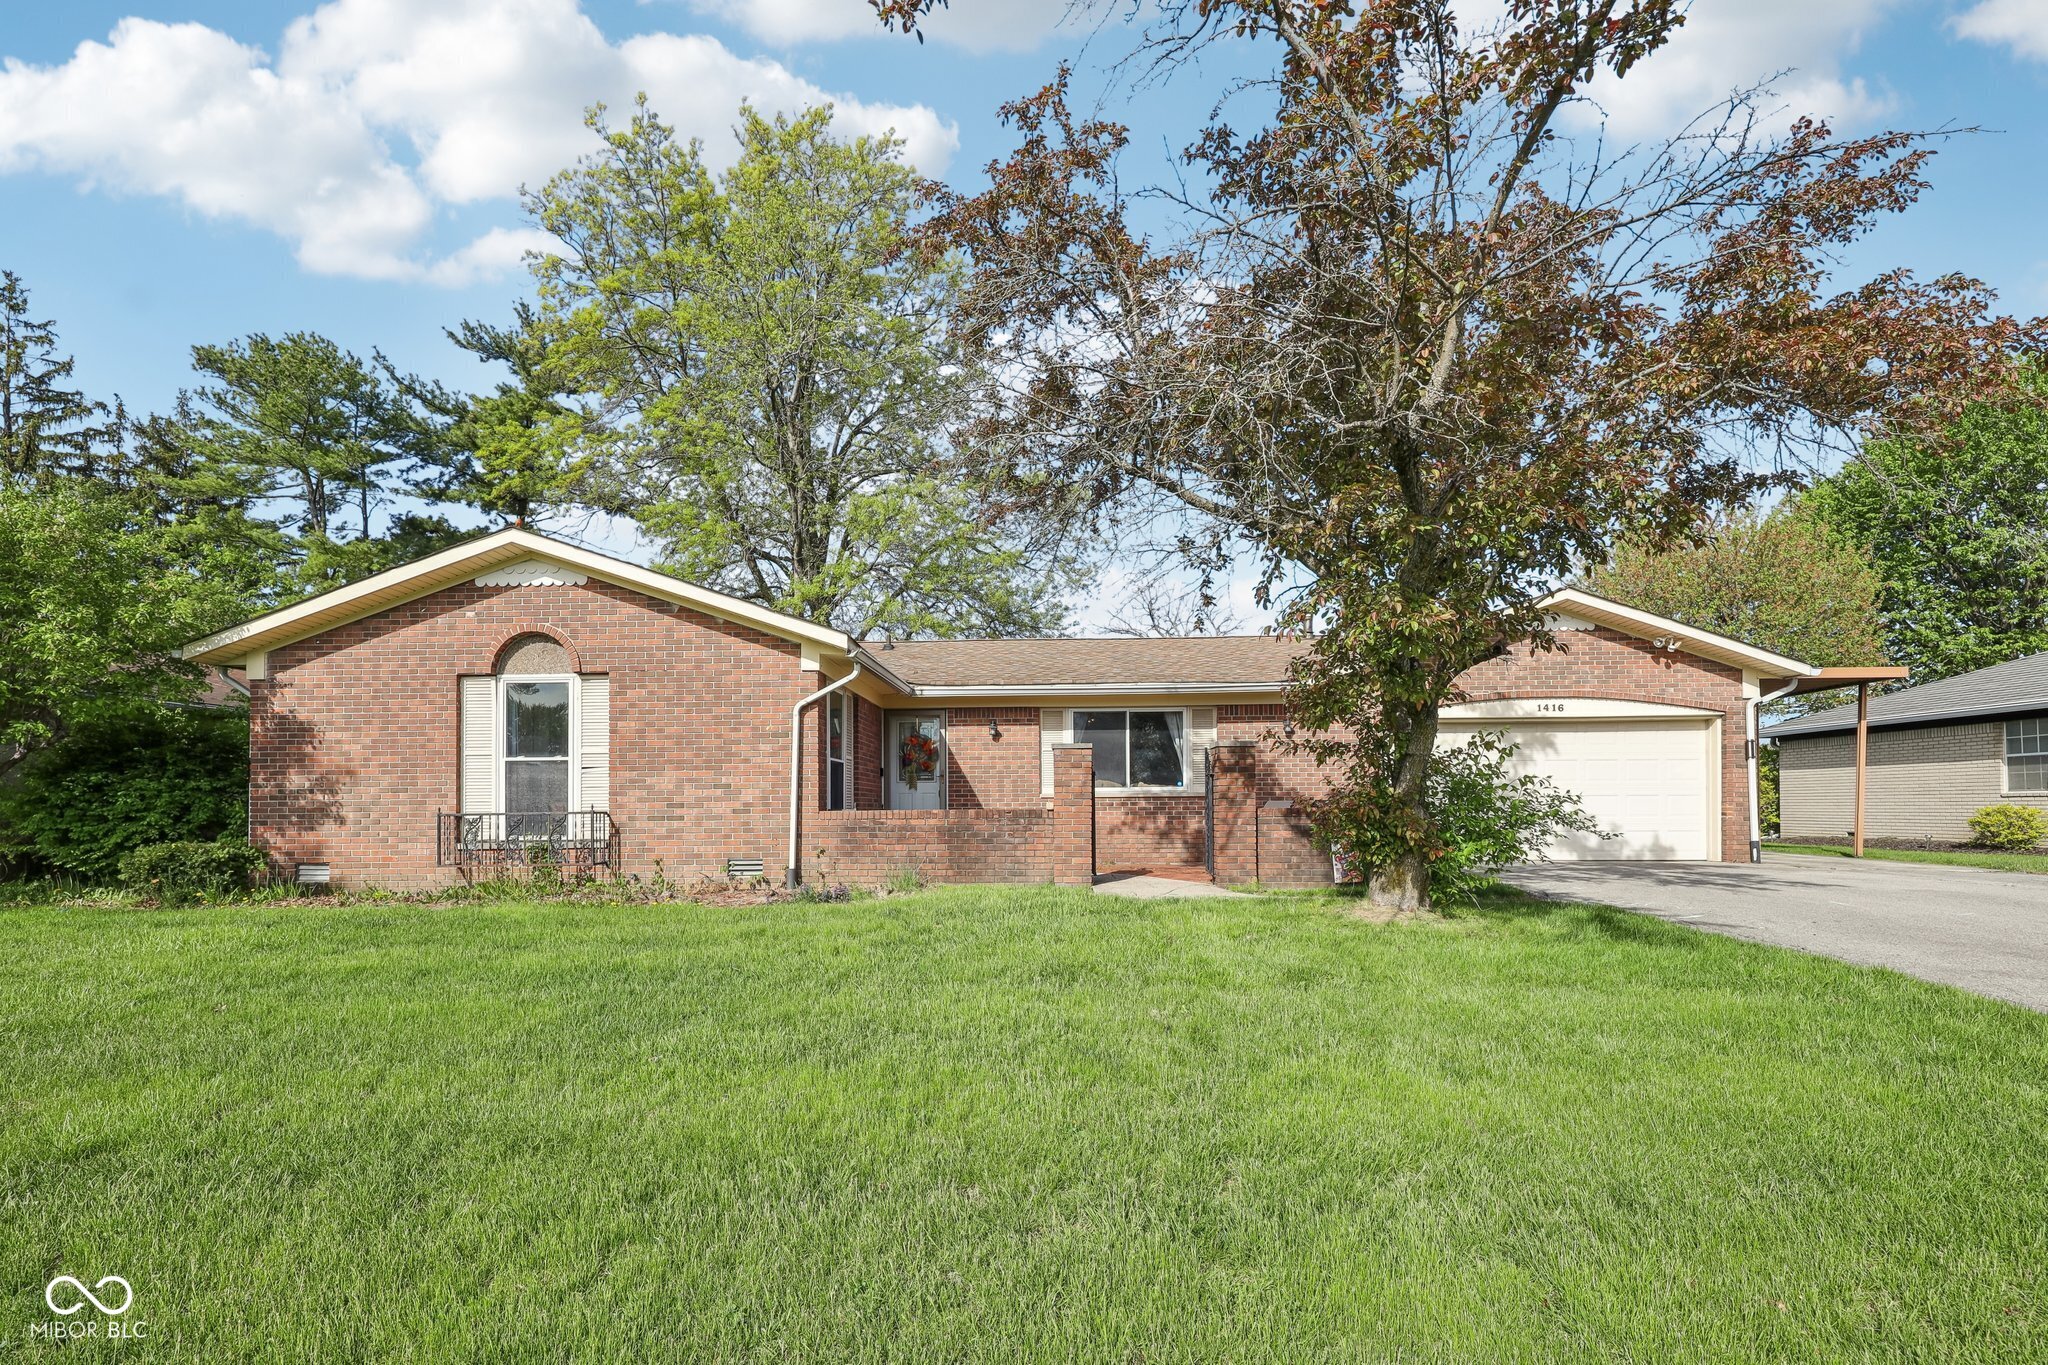
Active
$240,000
3
bds
|
2
ba
|
2,184
sqft
|
built
1968
1416 Wellington Ave, Indianapolis, IN 46219
$13
Cash flow
0.3%
Cash-on-Cash Return
6.2%
Cap rate
0.8%
Rent to Value Ratio
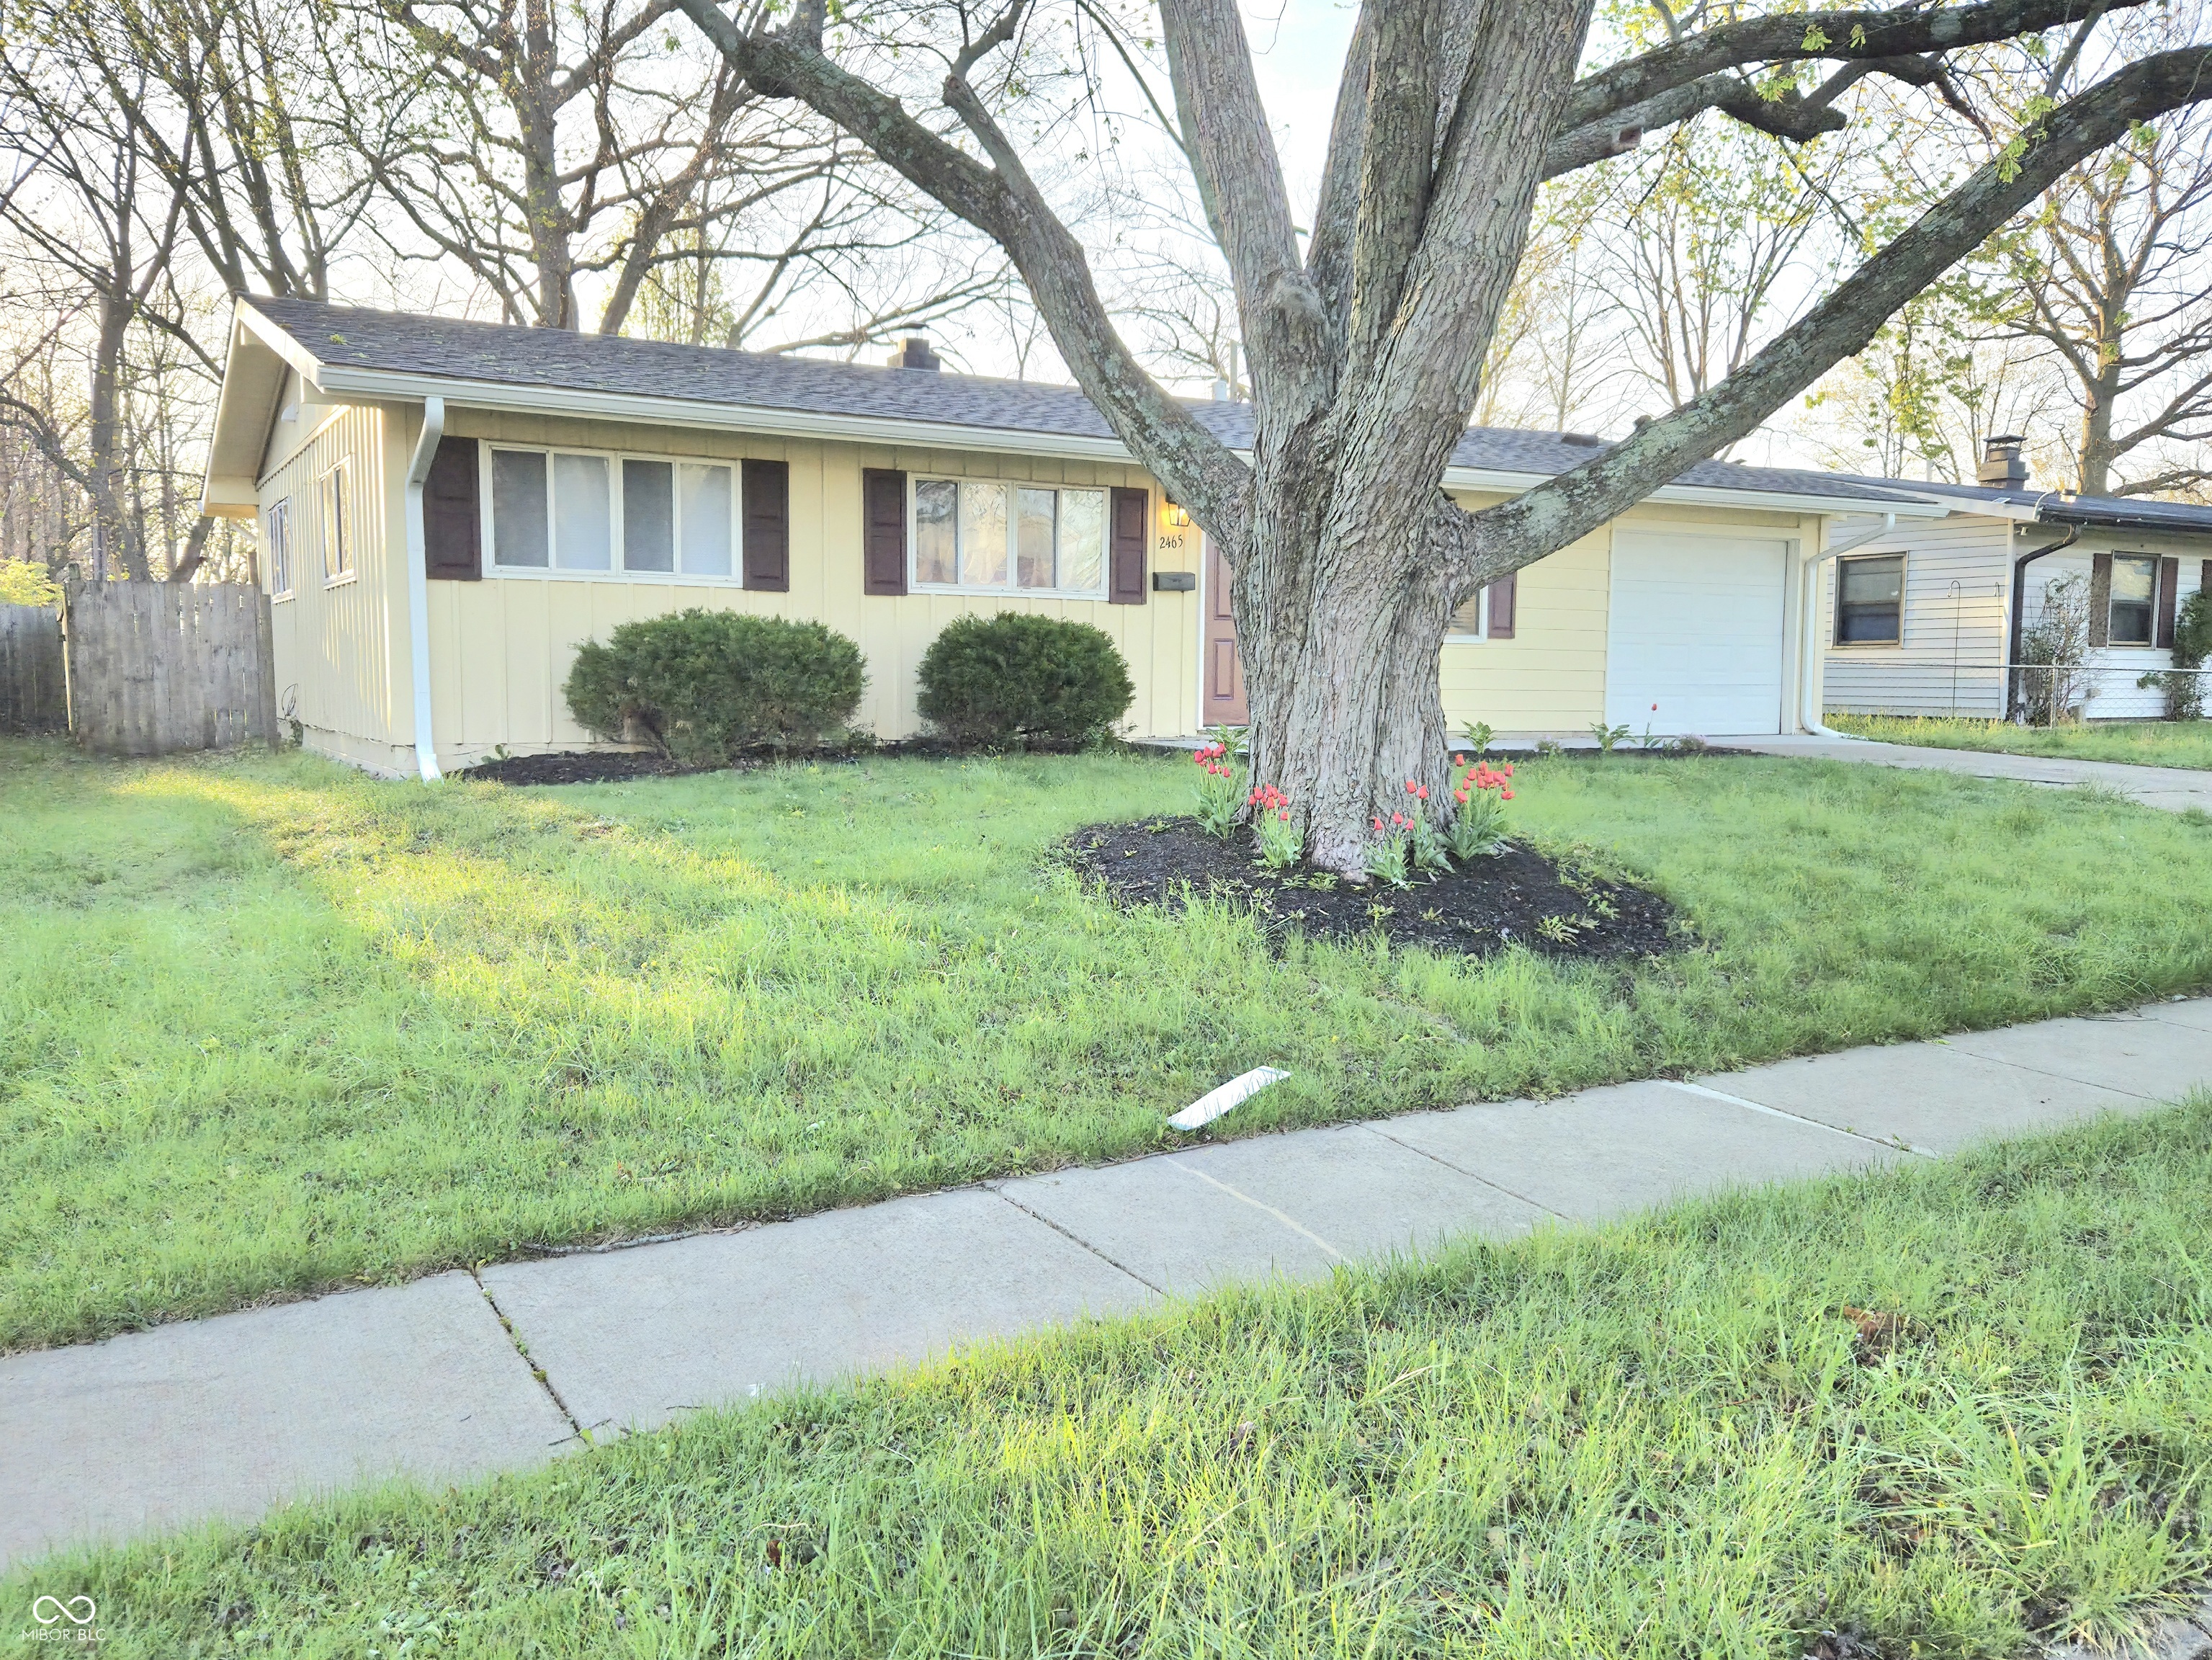
Pending
$179,900
3
bds
|
1
ba
|
1,205
sqft
|
built
1959
2465 N Eaton Ave, Indianapolis, IN 46219
$44
Cash flow
1.3%
Cash-on-Cash Return
6.4%
Cap rate
0.8%
Rent to Value Ratio
Active
$275,000
5
bds
|
3
ba
|
1,840
sqft
|
built
1935
6640 E Washington St, Indianapolis, IN 46219
$-29
Cash flow
-0.6%
Cash-on-Cash Return
6.0%
Cap rate
0.7%
Rent to Value Ratio
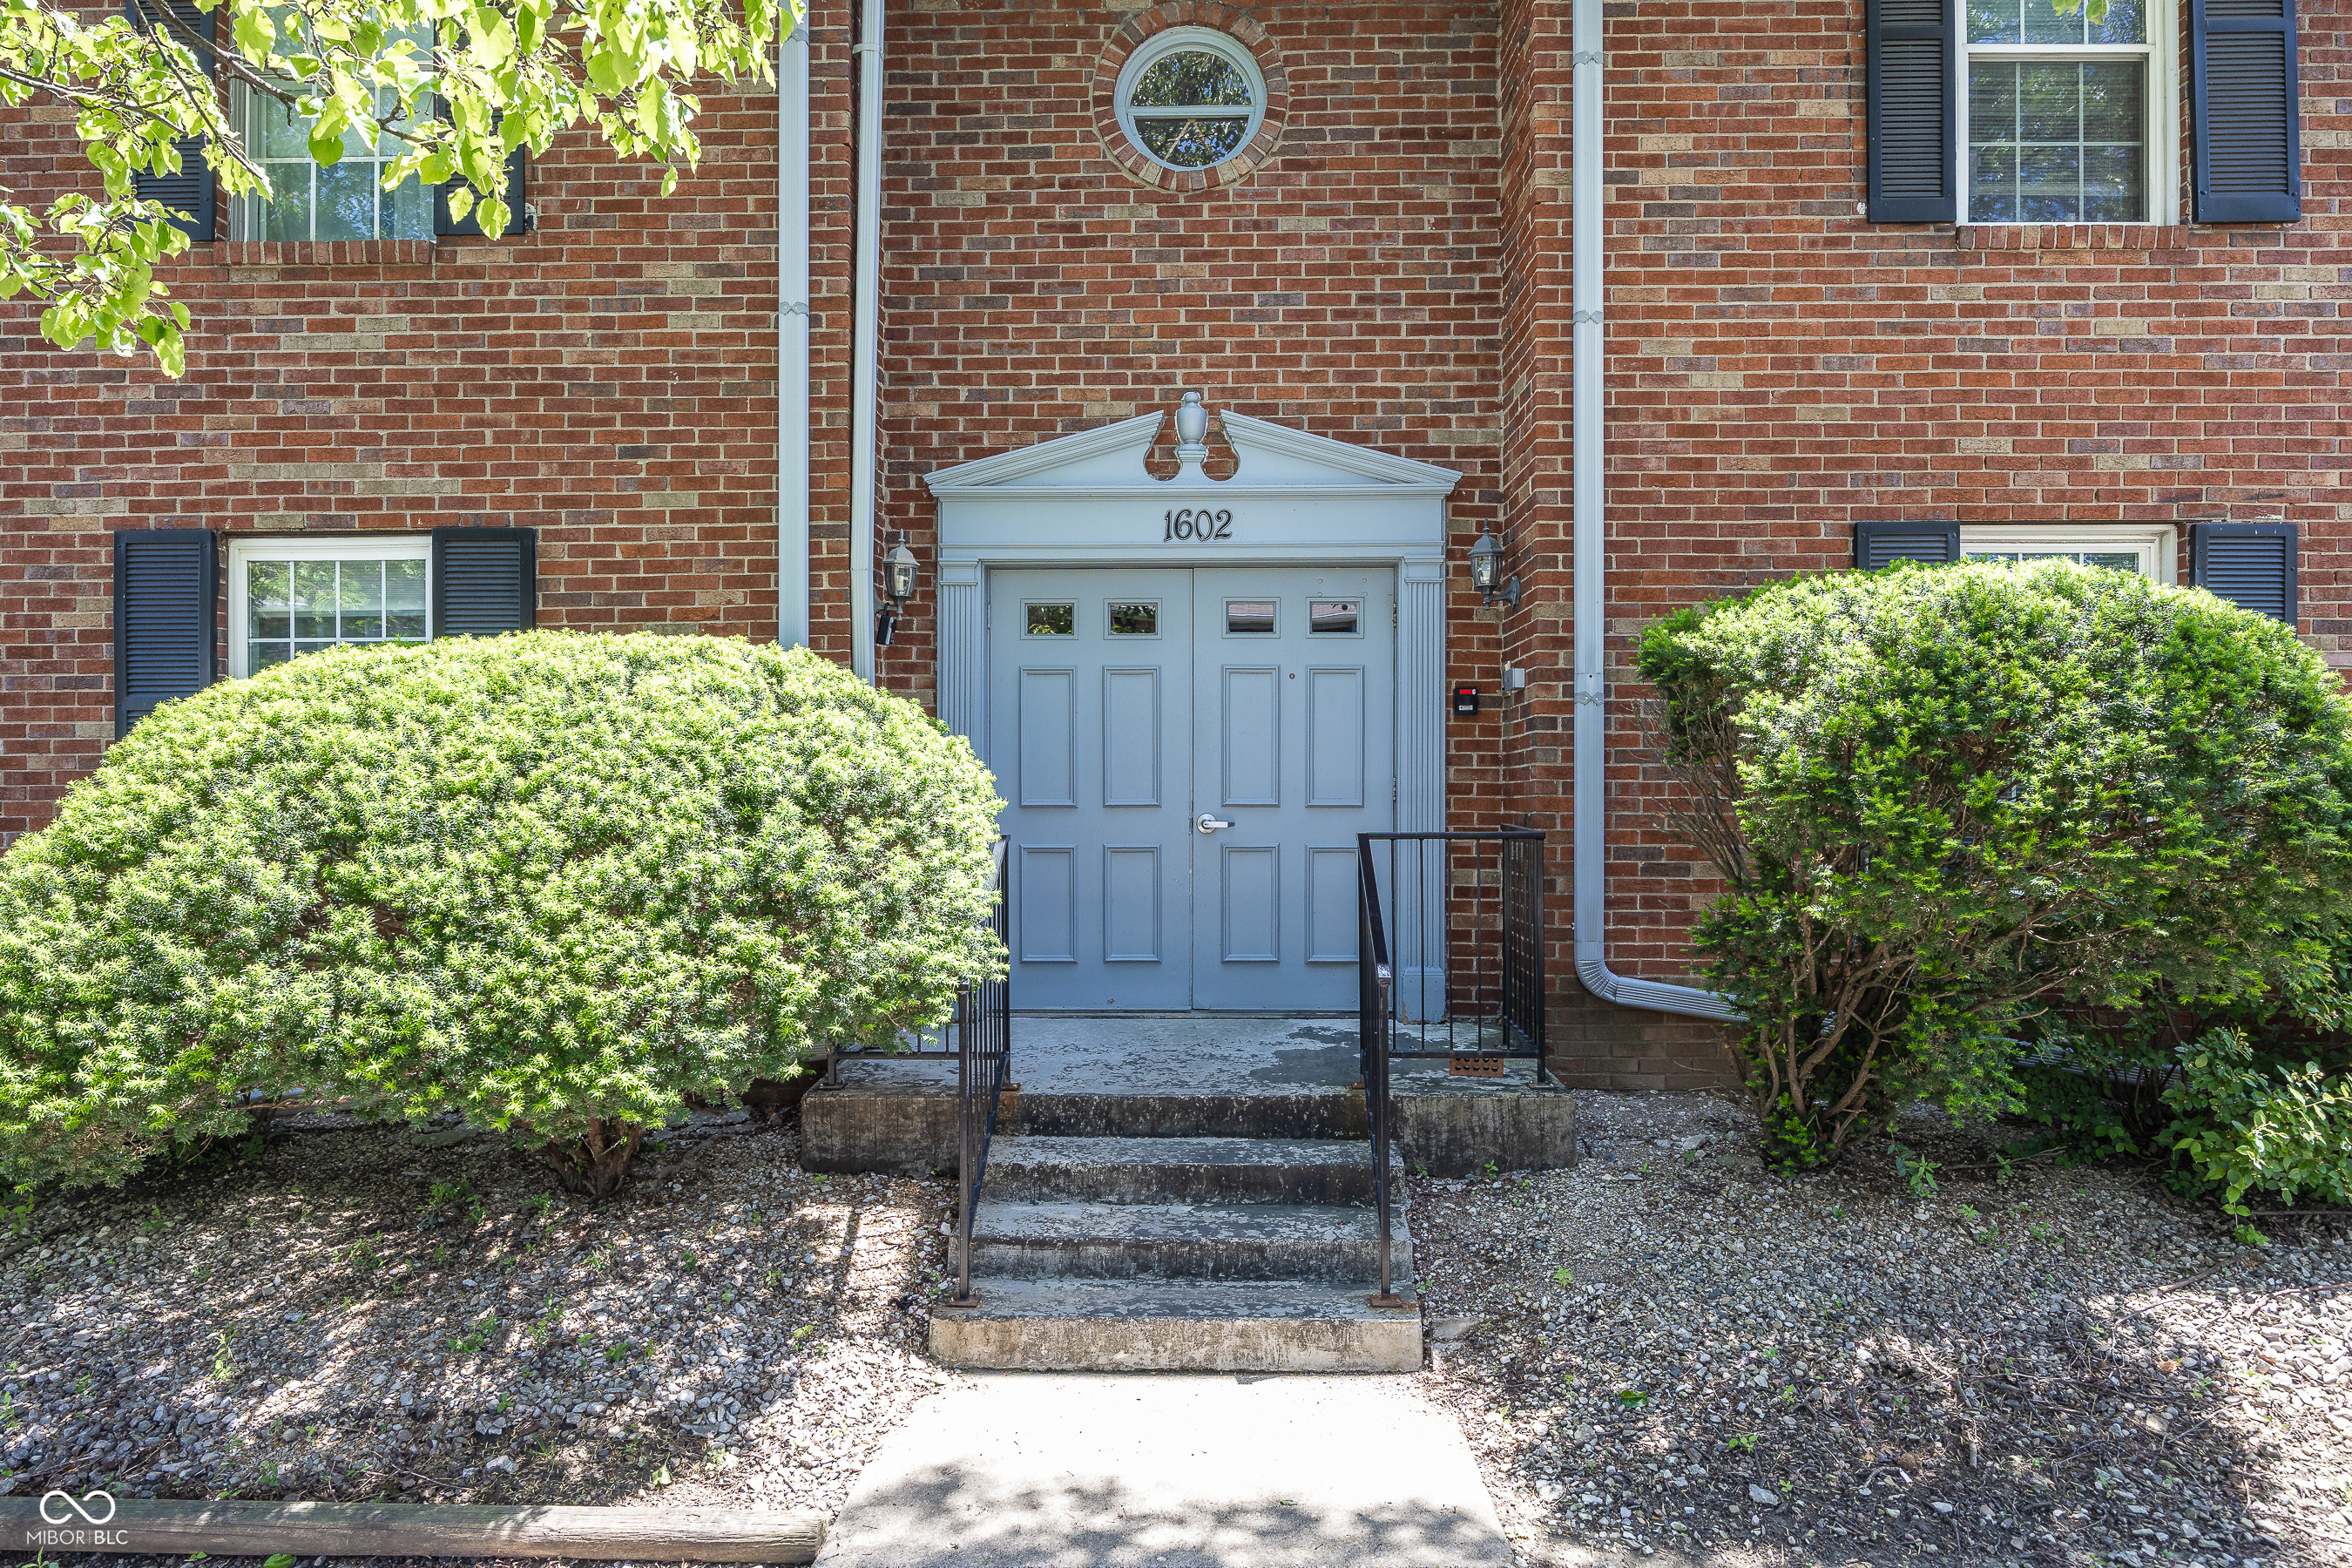
Active
$149,900
2
bds
|
2
ba
|
1,603
sqft
|
built
1974
1602 Queensbridge Sq, Indianapolis, IN 46219
$-112
Cash flow
-3.9%
Cash-on-Cash Return
5.3%
Cap rate
0.9%
Rent to Value Ratio
Pending
$209,000
4
bds
|
1
ba
|
1,500
sqft
|
built
1959
2538 Sickle Rd, Indianapolis, IN 46219
$33
Cash flow
0.8%
Cash-on-Cash Return
6.3%
Cap rate
0.8%
Rent to Value Ratio
Active
$261,900
3
bds
|
2
ba
|
1,440
sqft
|
built
1955
8810 Beechwood Ave, Indianapolis, IN 46219
$176
Cash flow
3.5%
Cash-on-Cash Return
7.0%
Cap rate
0.8%
Rent to Value Ratio
Active
$319,900
3
bds
|
3
ba
|
1,820
sqft
|
built
1928
6051 Lowell Ave, Indianapolis, IN 46219
$-397
Cash flow
-6.5%
Cash-on-Cash Return
4.7%
Cap rate
0.6%
Rent to Value Ratio