46219 Investment Properties for Sale
Browse homes for sale and investment properties in 46219. Refine your search by price, property type, or more.
Best cash flowing properties in 46219

Active
$62,000
1
bds
|
1
ba
|
624
sqft
|
built
1920
114 S Catherwood Ave, Indianapolis, IN 46219
$759
Cash flow
14.3%
Cash-on-Cash Return
14.7%
Cap rate
1.8%
Rent to Value Ratio

Active
$110,000
2
bds
|
1
ba
|
816
sqft
|
built
1949
2219 N Webster Ave, Indianapolis, IN 46219
$610
Cash flow
28.9%
Cash-on-Cash Return
12.8%
Cap rate
1.5%
Rent to Value Ratio
72 out of 74 properties for sale in 46219
Limited Results Shown
Create a free account, or log in to reveal all property listings and enjoy the complete experience.

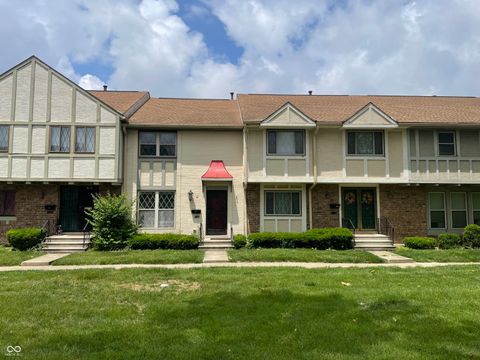
Pending
$209,000
4
bds
|
1
ba
|
1,500
sqft
|
built
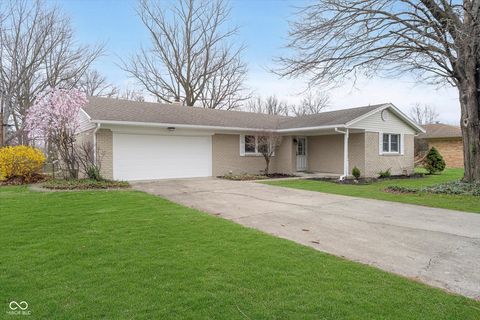
1959
2538 Sickle Rd, Indianapolis, IN 46219
$33
Cash flow
0.8%
Cash-on-Cash Return
6.3%
Cap rate
0.8%
Rent to Value Ratio
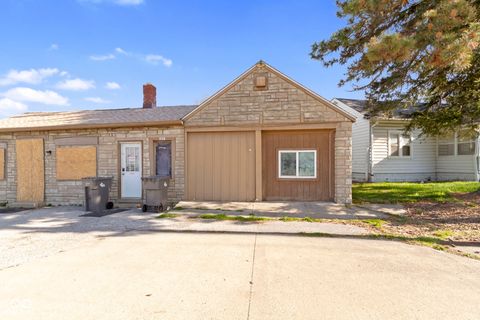
Active
$285,000
3
bds
|
2
ba
|
1,688
sqft
|
built
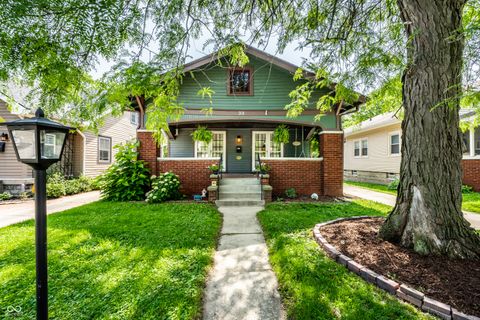
1920
33 N Webster Ave, Indianapolis, IN 46219
$58
Cash flow
1.1%
Cash-on-Cash Return
6.4%
Cap rate
0.8%
Rent to Value Ratio
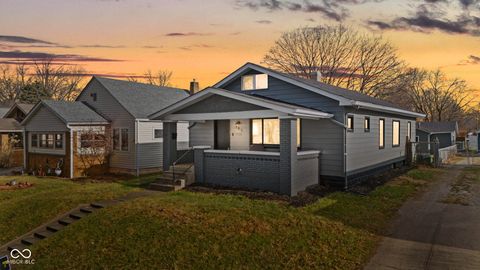
Pending
$308,000
2
bds
|
2
ba
|
1,324
sqft
|
built
1931
972 N Audubon Rd, Indianapolis, IN 46219
$-198
Cash flow
-3.4%
Cash-on-Cash Return
5.4%
Cap rate
0.6%
Rent to Value Ratio
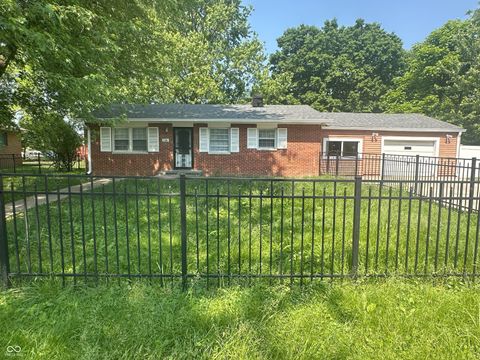
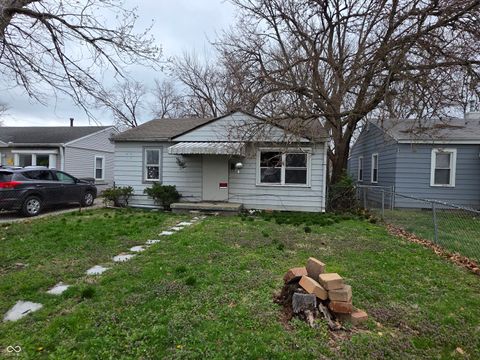
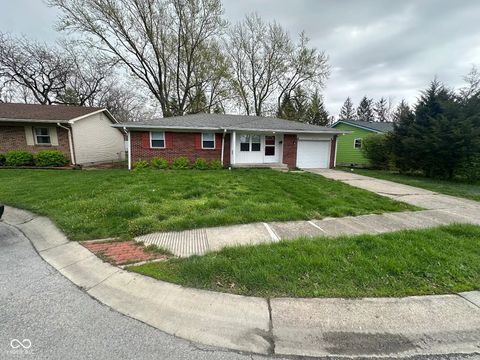
Active
$285,000
4
bds
|
2
ba
|
1,830
sqft
|
built
1964
1313 Roseway Dr, Indianapolis, IN 46219
$-218
Cash flow
-4.0%
Cash-on-Cash Return
5.2%
Cap rate
0.6%
Rent to Value Ratio

Active
$174,900
3
bds
|
1
ba
|
1,073
sqft
|
built
1959
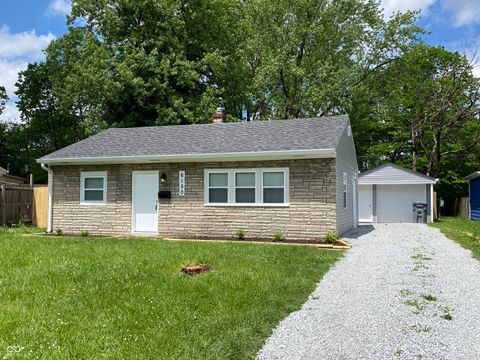
1716 Arlene Dr, Indianapolis, IN 46219
$70
Cash flow
2.1%
Cash-on-Cash Return
6.6%
Cap rate
0.8%
Rent to Value Ratio

Pending
$180,000
3
bds
|
1
ba
|
1,875
sqft
|
built
1959
2442 N Franklin Rd, Indianapolis, IN 46219
$320
Cash flow
9.3%
Cash-on-Cash Return
8.3%
Cap rate
1.0%
Rent to Value Ratio

Active
$189,900
2
bds
|
1
ba
|
832
sqft
|
built
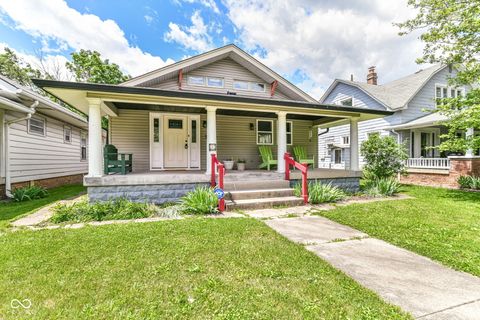
1920
5206 E Saint Clair St, Indianapolis, IN 46219
$131
Cash flow
3.6%
Cash-on-Cash Return
7.0%
Cap rate
0.8%
Rent to Value Ratio

Active
$290,000
3
bds
|
3
ba
|
1,728
sqft
|
built
1901
360 S Spencer Ave, Indianapolis, IN 46219
$-796
Cash flow
-14.3%
Cash-on-Cash Return
2.9%
Cap rate
0.3%
Rent to Value Ratio

Pending
$350,000
4
bds
|
3
ba
|
2,650
sqft
|
built
1930
40 N Ritter Ave, Indianapolis, IN 46219
$-68
Cash flow
-1.0%
Cash-on-Cash Return
5.9%
Cap rate
0.7%
Rent to Value Ratio
Active
$235,000
3
bds
|
2
ba
|
1,611
sqft
|
built
1924
518 N Emerson Ave, Indianapolis, IN 46219
$-307
Cash flow
-6.8%
Cash-on-Cash Return
4.6%
Cap rate
0.6%
Rent to Value Ratio
Active
$169,500
2
bds
|
1
ba
|
789
sqft
|
built
1941
330 S Butler Ave, Indianapolis, IN 46219
$98
Cash flow
3.0%
Cash-on-Cash Return
6.8%
Cap rate
0.8%
Rent to Value Ratio
Active
$209,900
3
bds
|
2
ba
|
1,216
sqft
|
built
1951
450 N Fenton Ave, Indianapolis, IN 46219
$-109
Cash flow
-2.7%
Cash-on-Cash Return
5.5%
Cap rate
0.7%
Rent to Value Ratio
Active
$145,000
2
bds
|
1
ba
|
725
sqft
|
built
1950
719 Melvenia St, Indianapolis, IN 46219
$-53
Cash flow
-1.9%
Cash-on-Cash Return
5.7%
Cap rate
0.7%
Rent to Value Ratio

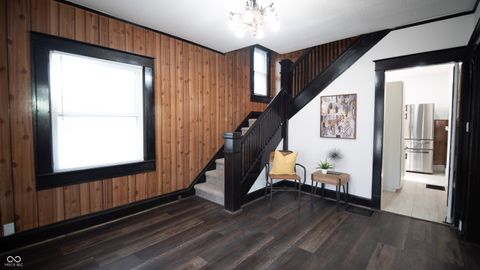
Pending
$287,500
3
bds
|
1
ba
|
1,542
sqft
|
built
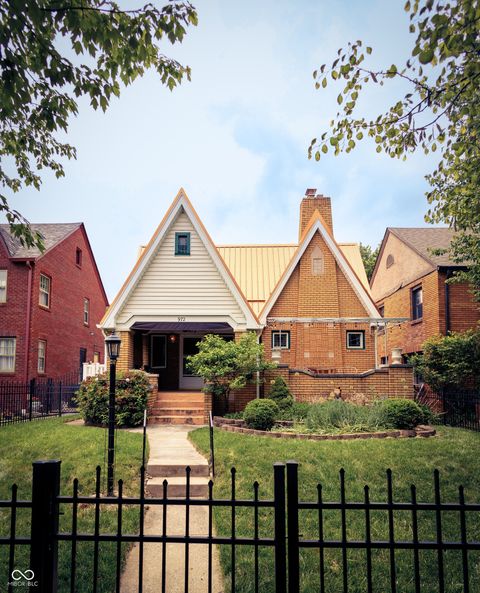
1921
357 N Kenyon St, Indianapolis, IN 46219
$45
Cash flow
0.8%
Cash-on-Cash Return
6.3%
Cap rate
0.8%
Rent to Value Ratio
Pending
$219,900
2
bds
|
2
ba
|
975
sqft
|
built
1952
1108 N Ritter Ave, Indianapolis, IN 46219
$-22
Cash flow
-0.5%
Cash-on-Cash Return
6.0%
Cap rate
0.7%
Rent to Value Ratio
Active
$125,000
2
bds
|
3
ba
|
1,638
sqft
|
built
1972
8021 E 20th St, Indianapolis, IN 46219
$14
Cash flow
0.6%
Cash-on-Cash Return
6.3%
Cap rate
1.3%
Rent to Value Ratio
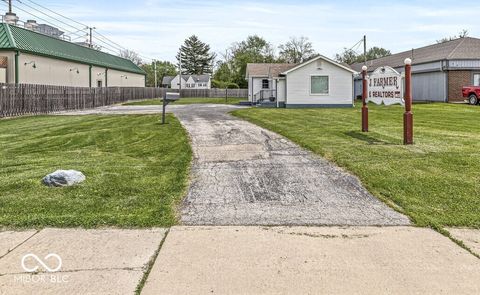
Active
$340,000
2
bds
|
0
ba
|
0
sqft
|
built
1936
6102 Brookville Rd, Indianapolis, IN 46219
$-638
Cash flow
-9.8%
Cash-on-Cash Return
3.9%
Cap rate
0.5%
Rent to Value Ratio
Active
$220,000
3
bds
|
1
ba
|
1,144
sqft
|
built
1930
385 S Arlington Ave, Indianapolis, IN 46219
$115
Cash flow
2.7%
Cash-on-Cash Return
6.8%
Cap rate
0.8%
Rent to Value Ratio
Active
$175,900
3
bds
|
2
ba
|
1,170
sqft
|
built
1957
2180 N Irwin St, Indianapolis, IN 46219
$65
Cash flow
1.9%
Cash-on-Cash Return
6.6%
Cap rate
0.8%
Rent to Value Ratio
Active
$75,000
2
bds
|
1
ba
|
725
sqft
|
built
1949
5842 Greenfield Ave, Indianapolis, IN 46219
$444
Cash flow
30.9%
Cash-on-Cash Return
13.2%
Cap rate
1.6%
Rent to Value Ratio
Active
$210,000
4
bds
|
2
ba
|
1,736
sqft
|
built
1929
123 S Butler Ave, Indianapolis, IN 46219
$-317
Cash flow
-7.9%
Cash-on-Cash Return
4.3%
Cap rate
0.5%
Rent to Value Ratio
Pending
$199,900
2
bds
|
0
ba
|
0
sqft
|
built
1941
1251 N Emerson Ave, Indianapolis, IN 46219
$-127
Cash flow
-3.3%
Cash-on-Cash Return
5.4%
Cap rate
0.7%
Rent to Value Ratio
Active
$270,000
3
bds
|
2
ba
|
2,732
sqft
|
built
1940
310 S Butler Ave, Indianapolis, IN 46219
$-141
Cash flow
-2.7%
Cash-on-Cash Return
5.5%
Cap rate
0.7%
Rent to Value Ratio
Active
$165,000
3
bds
|
1
ba
|
960
sqft
|
built
1948
6150 E 25th St, Indianapolis, IN 46219
$52
Cash flow
1.6%
Cash-on-Cash Return
6.5%
Cap rate
0.8%
Rent to Value Ratio
Active
$165,000
2
bds
|
1
ba
|
732
sqft
|
built
1921
1391 N Shadeland Ave, Indianapolis, IN 46219
$-17
Cash flow
-0.5%
Cash-on-Cash Return
6.0%
Cap rate
0.7%
Rent to Value Ratio
Active
$110,000
2
bds
|
1
ba
|
816
sqft
|
built
1949
2219 N Webster Ave, Indianapolis, IN 46219
$610
Cash flow
28.9%
Cash-on-Cash Return
12.8%
Cap rate
1.5%
Rent to Value Ratio
Active
$62,000
1
bds
|
1
ba
|
624
sqft
|
built
1920
114 S Catherwood Ave, Indianapolis, IN 46219
$759
Cash flow
14.3%
Cash-on-Cash Return
14.7%
Cap rate
1.8%
Rent to Value Ratio
Active
$271,000
3
bds
|
2
ba
|
2,194
sqft
|
built
1912
526 N Emerson Ave, Indianapolis, IN 46219
$-8
Cash flow
-0.2%
Cash-on-Cash Return
6.1%
Cap rate
0.7%
Rent to Value Ratio

Active
$219,900
3
bds
|
2
ba
|
1,368
sqft
|
built
1959
8230 E 11th St, Indianapolis, IN 46219
$-22
Cash flow
-0.5%
Cash-on-Cash Return
6.0%
Cap rate
0.7%
Rent to Value Ratio
Active
$194,900
3
bds
|
2
ba
|
1,191
sqft
|
built
1973
2453 Larnie Ln, Indianapolis, IN 46219
$106
Cash flow
2.8%
Cash-on-Cash Return
6.8%
Cap rate
0.8%
Rent to Value Ratio

Active
$324,900
4
bds
|
0
ba
|
0
sqft
|
built
1951
307 N Arlington Ave, Indianapolis, IN 46219
$-698
Cash flow
-11.2%
Cash-on-Cash Return
3.6%
Cap rate
0.4%
Rent to Value Ratio

Active
$185,000
3
bds
|
2
ba
|
1,473
sqft
|
built
1961
2519 N Boehning St, Indianapolis, IN 46219
$156
Cash flow
4.4%
Cash-on-Cash Return
7.2%
Cap rate
0.9%
Rent to Value Ratio