46221 Investment Properties for Sale
Browse homes for sale and investment properties in 46221. Refine your search by price, property type, or more.
Best cash flowing properties in 46221
Active
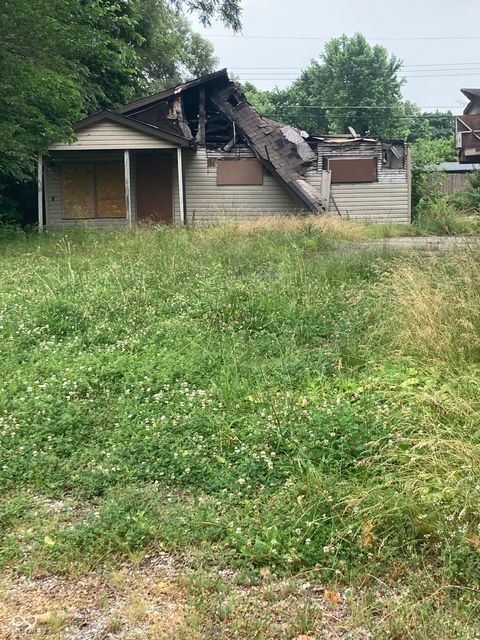
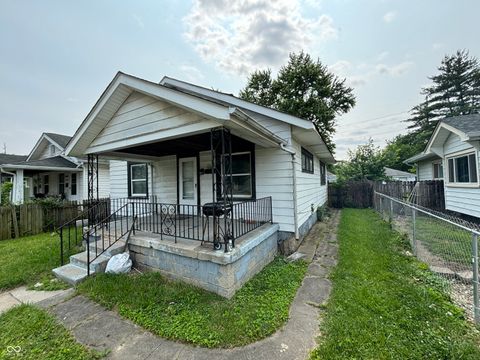
$50,000
1
bds
|
0
ba
|
840
sqft
|
built
1935
3343 S Lyons Ave, Indianapolis, IN 46221
$759
Cash flow
17.7%
Cash-on-Cash Return
18.2%
Cap rate
2.2%
Rent to Value Ratio

Active
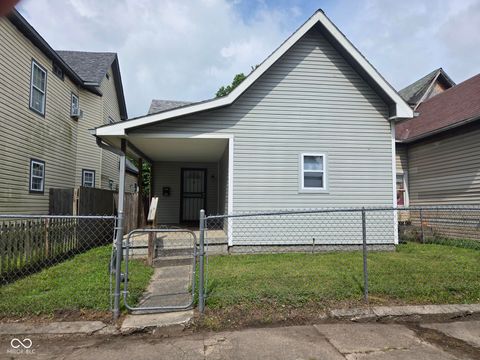
$65,000
2
bds
|
1
ba
|
780
sqft
|
built
1940
3336 S Rybolt Ave, Indianapolis, IN 46221
$621
Cash flow
11.1%
Cash-on-Cash Return
11.5%
Cap rate
1.4%
Rent to Value Ratio
50 out of 55 properties for sale in 46221
Limited Results Shown
Create a free account, or log in to reveal all property listings and enjoy the complete experience.
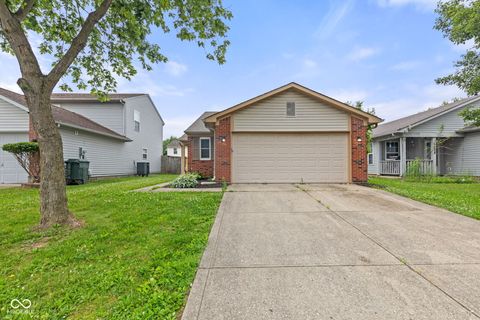
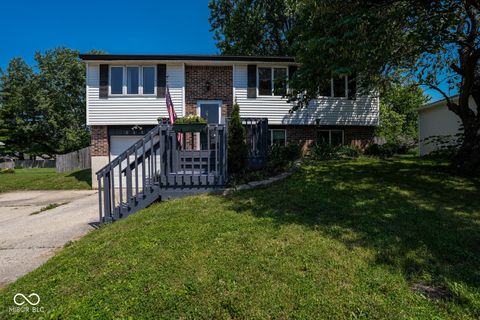
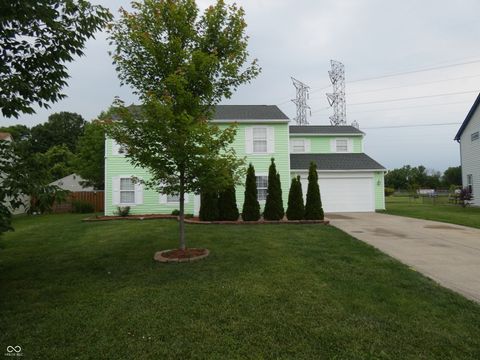
Active
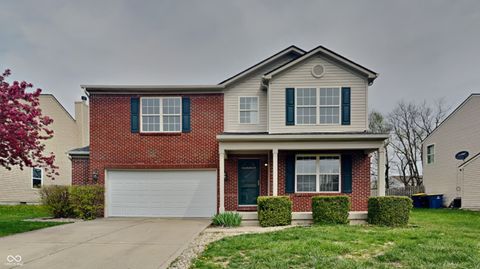
$239,900
3
bds
|
2
ba
|
1,207
sqft
|
built
1999
6332 Long River Ln, Indianapolis, IN 46221
$-141
Cash flow
-3.1%
Cash-on-Cash Return
5.4%
Cap rate
0.7%
Rent to Value Ratio
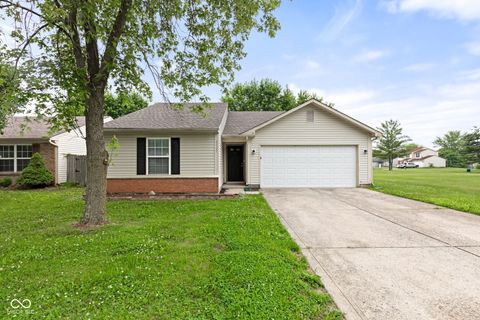
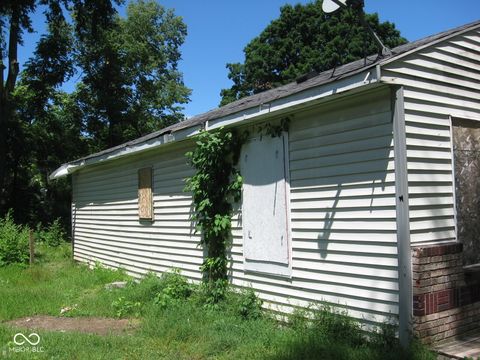
Active
$249,900
3
bds
|
2
ba
|
1,236
sqft
|
built
1999
6227 Long River Ln, Indianapolis, IN 46221
$-192
Cash flow
-4.0%
Cash-on-Cash Return
5.2%
Cap rate
0.6%
Rent to Value Ratio
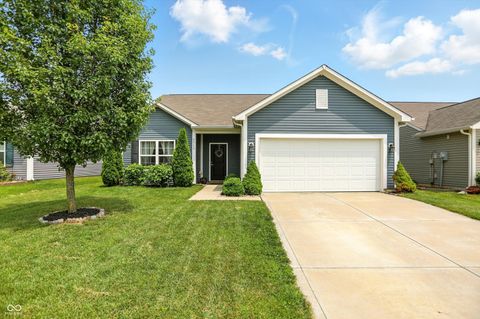
Active
$275,000
3
bds
|
2
ba
|
1,600
sqft
|
built
2016
6315 Emerald Field Way, Indianapolis, IN 46221
$-192
Cash flow
-3.6%
Cash-on-Cash Return
5.3%
Cap rate
0.7%
Rent to Value Ratio
Active
$230,000
4
bds
|
2
ba
|
1,894
sqft
|
built
1979
5522 Closser Ct, Indianapolis, IN 46221
$-5
Cash flow
-0.1%
Cash-on-Cash Return
6.1%
Cap rate
0.7%
Rent to Value Ratio

Active
$200,000
3
bds
|
1
ba
|
1,722
sqft
|
built
1910
853 S Belleview Pl, Indianapolis, IN 46221
$60
Cash flow
1.6%
Cash-on-Cash Return
6.6%
Cap rate
0.8%
Rent to Value Ratio

Active
$129,900
2
bds
|
1
ba
|
870
sqft
|
built
1940
703 Kappes St, Indianapolis, IN 46221
$288
Cash flow
11.6%
Cash-on-Cash Return
8.9%
Cap rate
1.1%
Rent to Value Ratio
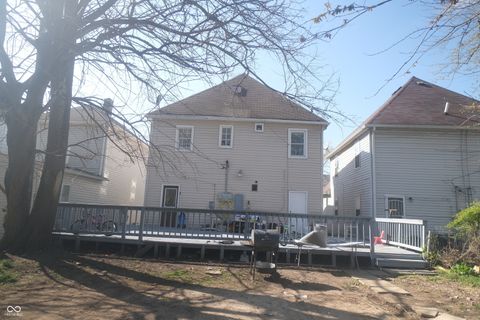
Active
$245,000
3
bds
|
0
ba
|
0
sqft
|
built
1990
653 Birch Ave, Indianapolis, IN 46221
$-589
Cash flow
-12.5%
Cash-on-Cash Return
3.4%
Cap rate
0.4%
Rent to Value Ratio
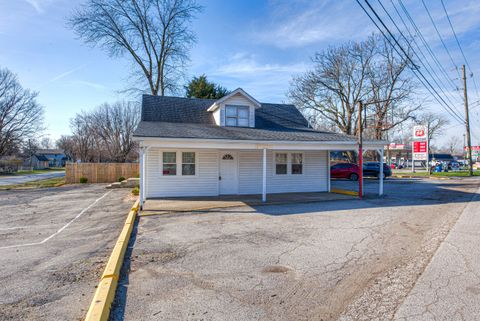
Active
$254,900
bds
|
0
ba
|
0
sqft
|
built
1939
3135 Kentucky Ave, Indianapolis, IN 46221
$-365
Cash flow
-7.5%
Cash-on-Cash Return
4.5%
Cap rate
0.5%
Rent to Value Ratio
Active
$50,000
1
bds
|
0
ba
|
840
sqft
|
built
1935
3343 S Lyons Ave, Indianapolis, IN 46221
$759
Cash flow
17.7%
Cash-on-Cash Return
18.2%
Cap rate
2.2%
Rent to Value Ratio

Active
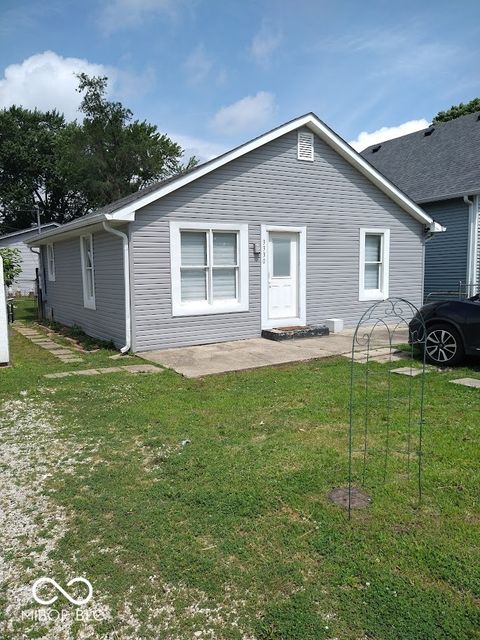
$68,000
2
bds
|
1
ba
|
960
sqft
|
built
1949
3242 S Rybolt Ave, Indianapolis, IN 46221
$621
Cash flow
10.6%
Cash-on-Cash Return
11.0%
Cap rate
1.3%
Rent to Value Ratio

Active
$145,000
2
bds
|
1
ba
|
726
sqft
|
built
1946
3128 S Holt Rd, Indianapolis, IN 46221
$140
Cash flow
5.0%
Cash-on-Cash Return
7.4%
Cap rate
0.9%
Rent to Value Ratio
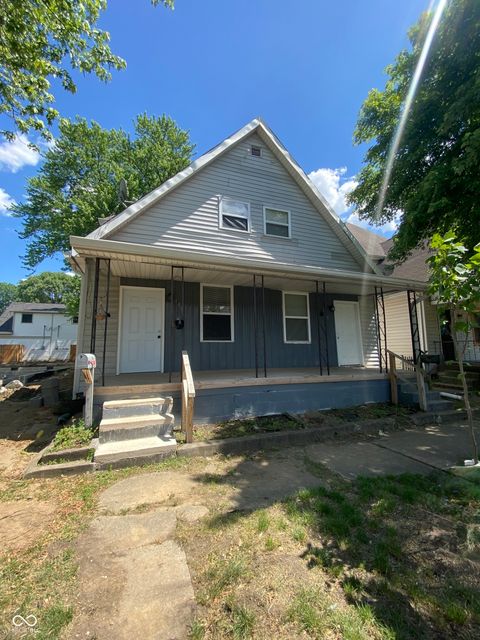
Active
$175,000
3
bds
|
1
ba
|
1,008
sqft
|
built
1900
657 Birch Ave, Indianapolis, IN 46221
$-17
Cash flow
-0.5%
Cash-on-Cash Return
6.2%
Cap rate
0.7%
Rent to Value Ratio

Active
$232,000
4
bds
|
1
ba
|
1,424
sqft
|
built
1973
5041 Norcroft Dr, Indianapolis, IN 46221
$-107
Cash flow
-2.4%
Cash-on-Cash Return
5.7%
Cap rate
0.7%
Rent to Value Ratio
Active
$87,500
2
bds
|
1
ba
|
1,040
sqft
|
built
1910
1226 Hiatt St, Indianapolis, IN 46221
$449
Cash flow
26.8%
Cash-on-Cash Return
12.3%
Cap rate
1.5%
Rent to Value Ratio
Active
$187,500
2
bds
|
1
ba
|
994
sqft
|
built
1920
624 Warren Ave, Indianapolis, IN 46221
$-270
Cash flow
-7.5%
Cash-on-Cash Return
4.4%
Cap rate
0.5%
Rent to Value Ratio

Active
$379,900
3
bds
|
2
ba
|
1,486
sqft
|
built
1960
5324 Mann Rd, Indianapolis, IN 46221
$-51
Cash flow
-0.7%
Cash-on-Cash Return
6.1%
Cap rate
0.7%
Rent to Value Ratio
Active
$340,000
5
bds
|
3
ba
|
2,192
sqft
|
built
1995
6714 Colleens Way, Indianapolis, IN 46221
$-409
Cash flow
-6.3%
Cash-on-Cash Return
4.8%
Cap rate
0.6%
Rent to Value Ratio
Active
$65,000
2
bds
|
1
ba
|
576
sqft
|
built
1939
3318 S Rybolt Ave, Indianapolis, IN 46221
$483
Cash flow
8.7%
Cash-on-Cash Return
8.9%
Cap rate
1.1%
Rent to Value Ratio
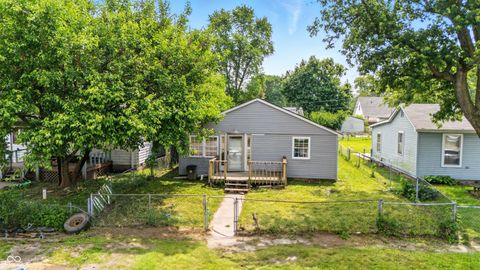
Active
$65,000
2
bds
|
1
ba
|
780
sqft
|
built
1940
3336 S Rybolt Ave, Indianapolis, IN 46221
$621
Cash flow
11.1%
Cash-on-Cash Return
11.5%
Cap rate
1.4%
Rent to Value Ratio

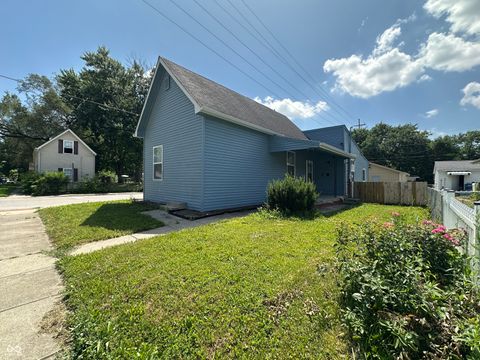
Active
$134,900
3
bds
|
1
ba
|
1,296
sqft
|
built
1915
836 S Tremont St, Indianapolis, IN 46221
$400
Cash flow
15.5%
Cash-on-Cash Return
9.8%
Cap rate
1.2%
Rent to Value Ratio
Active
$334,900
4
bds
|
4
ba
|
3,328
sqft
|
built
2004
6420 Greenspire Pl, Indianapolis, IN 46221
$-230
Cash flow
-3.6%
Cash-on-Cash Return
5.4%
Cap rate
0.7%
Rent to Value Ratio

Active
$299,900
4
bds
|
3
ba
|
1,924
sqft
|
built
2019
6540 Mc Creery Ct, Indianapolis, IN 46221
$-294
Cash flow
-5.1%
Cash-on-Cash Return
5.1%
Cap rate
0.6%
Rent to Value Ratio

Active
$150,000
3
bds
|
1
ba
|
855
sqft
|
built
1920
1845 W Wilkins St, Indianapolis, IN 46221
$183
Cash flow
6.4%
Cash-on-Cash Return
7.7%
Cap rate
0.9%
Rent to Value Ratio

Active
$79,900
2
bds
|
1
ba
|
1,040
sqft
|
built
1950
837 S Warman Ave, Indianapolis, IN 46221
$342
Cash flow
22.3%
Cash-on-Cash Return
11.4%
Cap rate
1.4%
Rent to Value Ratio
Active
$195,000
3
bds
|
1
ba
|
1,176
sqft
|
built
1948
3330 S Mooresville Rd, Indianapolis, IN 46221
$105
Cash flow
2.8%
Cash-on-Cash Return
6.8%
Cap rate
0.8%
Rent to Value Ratio
Active
$104,900
2
bds
|
1
ba
|
1,050
sqft
|
built
1940
3251 Mars Hill St, Indianapolis, IN 46221
$360
Cash flow
17.9%
Cash-on-Cash Return
10.3%
Cap rate
1.2%
Rent to Value Ratio
Active
$190,000
3
bds
|
2
ba
|
1,186
sqft
|
built
1910
1256 Kappes St, Indianapolis, IN 46221
$-26
Cash flow
-0.7%
Cash-on-Cash Return
6.1%
Cap rate
0.7%
Rent to Value Ratio
Active
$170,000
3
bds
|
2
ba
|
1,360
sqft
|
built
1922
1322 S Belmont Ave, Indianapolis, IN 46221
$-129
Cash flow
-4.0%
Cash-on-Cash Return
5.4%
Cap rate
0.6%
Rent to Value Ratio

Active
$265,000
3
bds
|
2
ba
|
1,578
sqft
|
built
2006
5832 Cabot Dr, Indianapolis, IN 46221
$-164
Cash flow
-3.2%
Cash-on-Cash Return
5.5%
Cap rate
0.7%
Rent to Value Ratio
Active
$114,900
1
bds
|
1
ba
|
692
sqft
|
built
1955
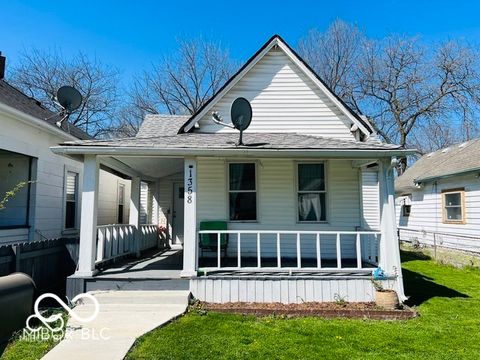
1358 Hiatt St, Indianapolis, IN 46221
$101
Cash flow
4.6%
Cash-on-Cash Return
7.2%
Cap rate
0.9%
Rent to Value Ratio
Active
$263,000
3
bds
|
3
ba
|
1,540
sqft
|
built
1996
6354 River Run Dr, Indianapolis, IN 46221
$-10
Cash flow
-0.2%
Cash-on-Cash Return
6.2%
Cap rate
0.8%
Rent to Value Ratio
Active
$210,000
0
bds
|
0
ba
|
0
sqft
|
built
1900
1344 S Belmont Ave, Indianapolis, IN 46221
$-199
Cash flow
-4.9%
Cash-on-Cash Return
5.1%
Cap rate
0.6%
Rent to Value Ratio
Active
$214,000
3
bds
|
1
ba
|
1,034
sqft
|
built
1911
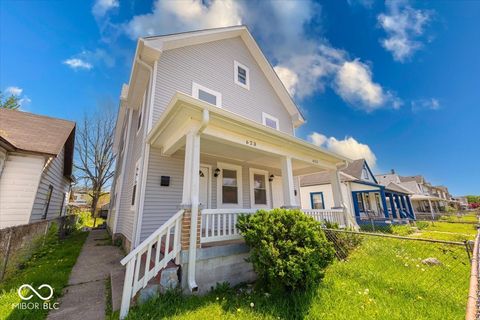
623 Arbor Ave, Indianapolis, IN 46221
$-665
Cash flow
-16.2%
Cash-on-Cash Return
2.5%
Cap rate
0.4%
Rent to Value Ratio
Active
$102,500
3
bds
|
1
ba
|
1,053
sqft
|
built
1938
3346 S Lockburn St, Indianapolis, IN 46221
$293
Cash flow
14.9%
Cash-on-Cash Return
9.7%
Cap rate
1.2%
Rent to Value Ratio
Active
$269,900
4
bds
|
3
ba
|
1,830
sqft
|
built
1997
6320 River Valley Way, Indianapolis, IN 46221
$-185
Cash flow
-3.6%
Cash-on-Cash Return
5.4%
Cap rate
0.7%
Rent to Value Ratio
Active
$135,000
2
bds
|
1
ba
|
579
sqft
|
built
1930
733 S Holmes Ave, Indianapolis, IN 46221
$-15
Cash flow
-0.6%
Cash-on-Cash Return
6.1%
Cap rate
0.7%
Rent to Value Ratio

Active
$244,900
4
bds
|
2
ba
|
1,380
sqft
|
built
2003
5437 Powder River Ct, Indianapolis, IN 46221
$-193
Cash flow
-4.1%
Cash-on-Cash Return
5.3%
Cap rate
0.7%
Rent to Value Ratio

Active
$119,000
3
bds
|
2
ba
|
834
sqft
|
built
1955
1342 Lee St, Indianapolis, IN 46221
$345
Cash flow
15.1%
Cash-on-Cash Return
9.7%
Cap rate
1.2%
Rent to Value Ratio
Active
$149,900
2
bds
|
0
ba
|
0
sqft
|
built
1920
1445 Lee St, Indianapolis, IN 46221
$-162
Cash flow
-5.6%
Cash-on-Cash Return
5.0%
Cap rate
0.6%
Rent to Value Ratio
Active
$262,900
3
bds
|
3
ba
|
1,824
sqft
|
built
2006
5924 Sable Dr, Indianapolis, IN 46221
$14
Cash flow
0.3%
Cash-on-Cash Return
6.2%
Cap rate
0.8%
Rent to Value Ratio